
Sample Category Title
Markets Await US ADP and ISM Services as Dollar Drops Further
Risk sentiment was mixed in Asian trading today. The Nikkei outperformed thanks to a rebound in SoftBank and renewed enthusiasm for tech and AI names, but the index failed to break back above 50,000 psychological level—highlighting lingering hesitation among investors despite the intraday gains. Outside Japan, the tone was considerably weaker, particularly in Hong Kong, where declines in property and China-linked names weighed on the broader market. Regional divergence highlights an indecisive backdrop. Clarity may emerge later in the day as US markets react to the ADP employment report and ISM services data.
In the currency markets, Dollar is back under selling pressure through the session, extending a soft patch that some expect to persist into year-end. The gradual release of delayed US economic data is expected to show a softer underlying growth profile—especially in the job market—which could reinforce expectations for additional Fed easing next year. Additionally, a stable global risk environment only deepens headwinds for the greenback.
Fed rate-cut expectations continue to build as investors look for data confirming the slowdown in consumption and hiring. Combined with an improving risk backdrop globally, the Dollar is increasingly vulnerable to further downside, particularly if today’s ISM services numbers reinforce the softer tone seen in this week's manufacturing data.
In the meantime, Aussie leads the days' performance board, buoyed by hawkish comments from RBA Governor Michele Bullock that overshadowed the softer-than-expected Q3 GDP figures. Kiwi follows as the second-strongest, while Sterling also trades firmer on cross-flow demand. At the weaker end of the board, Dollar is the day’s worst performer so far, followed by Loonie and Swiss Franc. Euro and Yen sit mid-table.
In Asia, Nikkei closed up 1.14%. Hong Kong HSI is down -1.30%. China Shanghai SSE is down -0.54%. Singapore Strait Times is up 0.23%. Japan 10-year JGB yield rose 0.029 to 1.892, edging closer to 1.9 handle. Overnight, DOW rose 0.39%. S&P 500 rose 0.25%. NASDAQ rose 0.59%. 10-year yield fell -0.010 to 4.860.
RBA’s Bullock warns inflation persistence may require renewed tightening
RBA Governor Michele Bullock told the Senate Economics Legislation Committee that the bank remains on high alert for renewed inflation pressure and is prepared to act if price gains prove "more persistent" than expected. She noted that upcoming data in the next few months will be crucial in determining whether demand pressures are easing, adding that officials may still have to pivot back toward tightening if inflation shows signs of regaining strength.
Facing questions on past budget and inflation mis-projections, Bullock conceded the RBA “hasn’t done it yet” in bringing inflation sustainably back to target, and must continue working toward that objective. She stressed that the board must “keep working on this”.
With national debt set to exceed AUD 1 trillion and a deficit of AUD 42 billion projected, she noted that lower public and private savings—if paired with unchanged investment—could "put upward pressure on the neutral rate,” she said."
But she added that that such an outcome is possible but contingent on both domestic and global forces. She emphasized that while the RBA can respond to domestic dynamics, but we don’t control global factors."
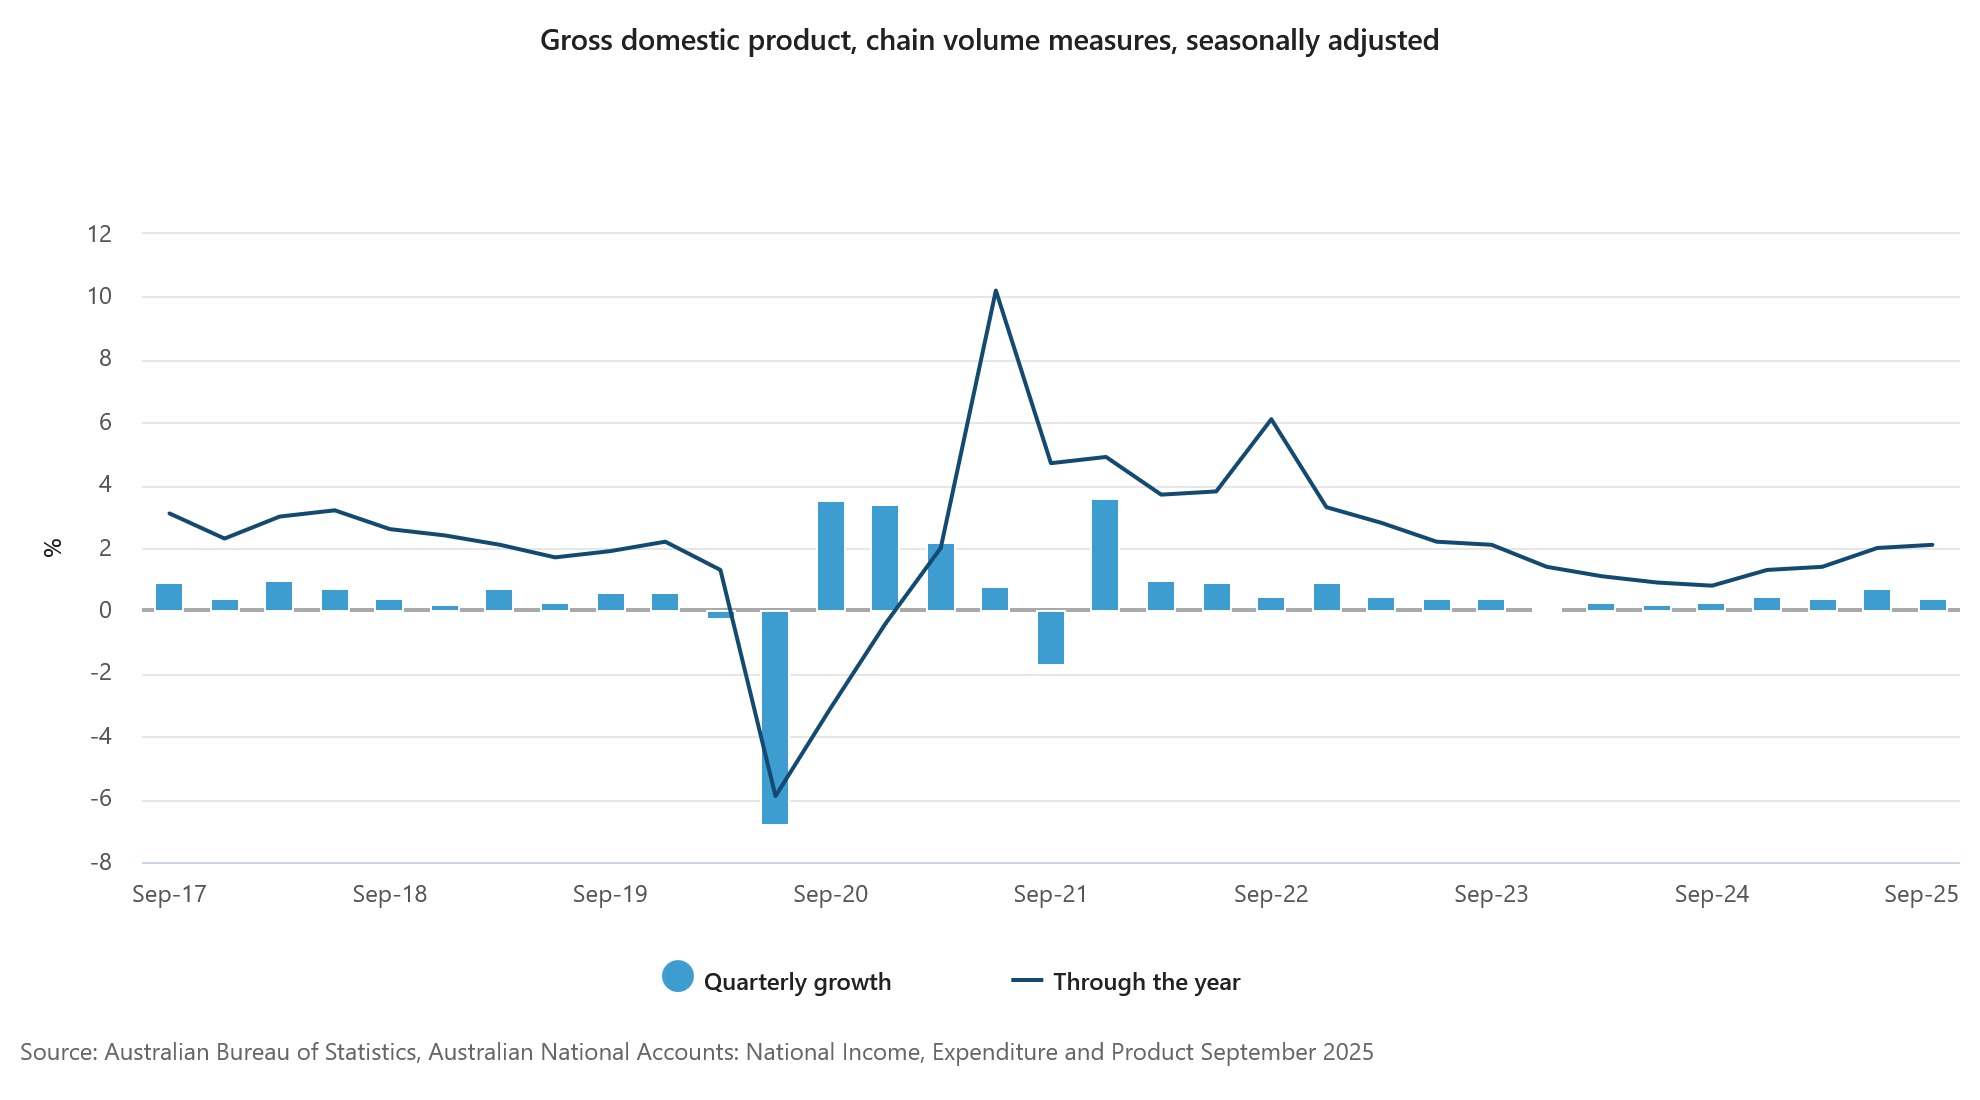
Australia Q3 GDP misses forecast at 0.4%, per capita output stagnates
Australia’s economy expanded 0.4% qoq in Q3, below expectations for 0.7% and marking a softer outcome despite a 2.1% yoy rise from a year earlier. The headline result reflected steady domestic activity supported by private investment and household consumption. However, GDP per capita was flat, suggesting growth is tracking population gains rather than delivering broad-based improvement in living standards.
A key drag came from external accounts. Inventory rundown—used to support export volumes—subtracted meaningfully from growth, while net trade also weighed as imports rose faster than exports. The pattern highlights ongoing pressure on Australia’s trade balance even as domestic demand remains resilient.
Grace Kim, ABS head of National Accounts, described Q3 performance as “steady,” noting growth matched the post-pandemic quarterly average. Kim added that per capita GDP stagnation reflected population dynamics rather than outright weakness in activity, with the measure still 0.4% above its level a year earlier.
AUD/USD and AUD/JPY both eye breakouts after hawkish RBA remarks
Australian Dollar rallied sharply today after RBA Governor Michele Bullock signaled to Parliament that policymakers remain ready to tighten policy if inflation shows renewed persistence. Markets took her remarks as a clear indication that a rate hike in 2026 is possible—and that easing is firmly off the table for now. .
Soft Q3 GDP numbers briefly tempered expectations, but failed to stall Aussie’s advance. While quarterly growth undershot forecasts at 0.4% qoq, the 2.1% yoy expansion was still the strongest pace in two years, keeping concerns alive that domestic demand may be too resilient for inflation to retreat as quickly as hoped.
Markets now largely agree that rate cuts are off the table for an extended period, and a pre-emptive hike cannot be ruled out if upcoming data surprise on the upside.
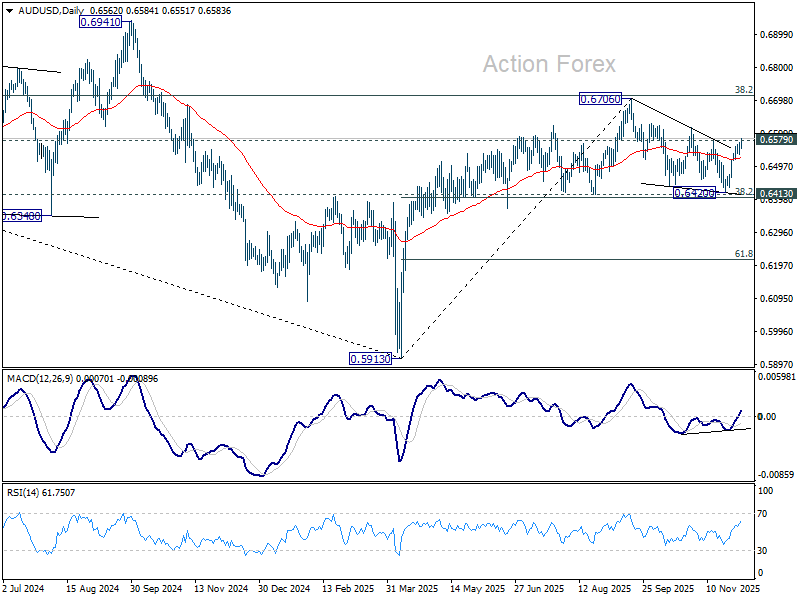
Technically, AUD/USD’s break above 0.6579 reinforces that the correction from 0.6706 likely ended at 0.6420. The uptrend from the 2025 trough at 0.5913 may now be resuming, setting up a retest of 0.6706 peak. The key question is whether bullish momentum can build into that level or whether upside energy fades on approach.
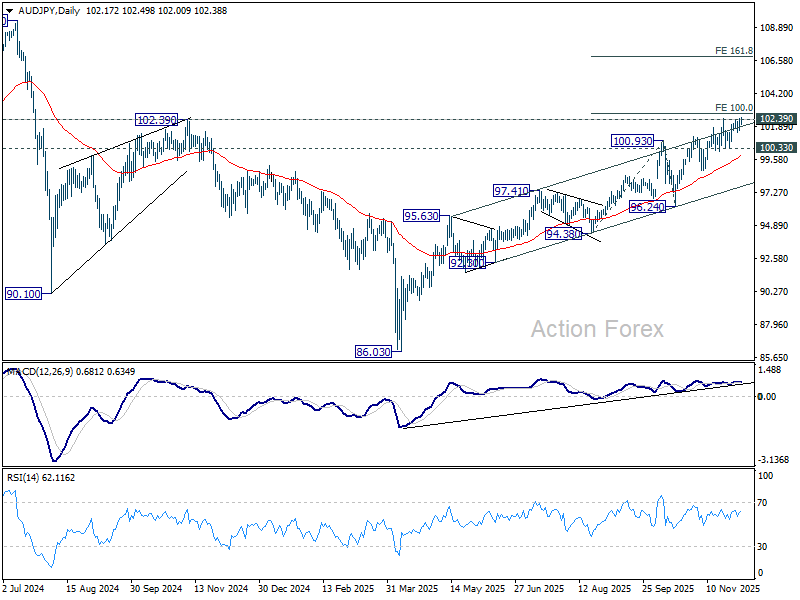
AUD/JPY is also attempting a significant breakout as it challenges a dense cluster of resistance around 102. This zone includes the medium-term rising channel ceiling and the key 102.39 structural pivot. A clean break would represent an important bullish confirmation for longer-term AUD strength.
As long as 100.33 support holds, outlook for AUD/JPY stays bullish. Decisive break above 100% Projection of 94.38 to 100.93 from 96.24 at 102.79 should trigger upside acceleration towards 161.8% projection at 106.83.
Japan PMI services holds strong at 53.2, optimism hits year high
Japan’s Services PMI was finalized at 53.2 in November, edging up from 53.1 in October. Composite PMI also improved, rising to 52.0 from 51.5. S&P Global’s Annabel Fiddes noted “a number of positive developments,” with the sector consistently driving overall activity since mid-year.
Forward-looking indicators strengthened notably. Business optimism and hiring intentions both climbed to their highest levels since early 2025. New orders also accelerated modestly, the first pickup in three months, signaling a gradual improvement in underlying demand even if the pace remains mild. However, the positive momentum was accompanied by firmer inflation pressures. Input costs rose at the fastest rate since May, prompting another solid increase in selling prices as firms sought to protect margins.
With Japan’s new stimulus package now approved—aimed at supporting growth and offsetting rising costs—markets will be watching closely to see whether demand and output continue to improve in the coming months.
China's RatingDog PMI services falls to 52.1, expansion loses pace, employment and margins under pressure
China’s RatingDog Services PMI eased in November, slipping from 52.6 to 52.1, while Composite PMI fell from 51.8 to 51.2. Both measures remained in expansionary territory, but the decline signaled moderation in growth momentum heading into year-end.
Yao Yu, Founder of RatingDog, said the services sector remained “relatively stable,” though November’s reading marked the weakest level since Q2. External demand showed mild improvement and offered “marginal support,” but domestic conditions were less encouraging.
Employment contracted again, profit margins came under pressure, and business expectations weakened—factors Yao described as the “main constraints” on the sector.
EUR/USD Daily Outlook
Daily Pivots: (S1) 1.1602; (P) 1.1615; (R1) 1.1638; More….
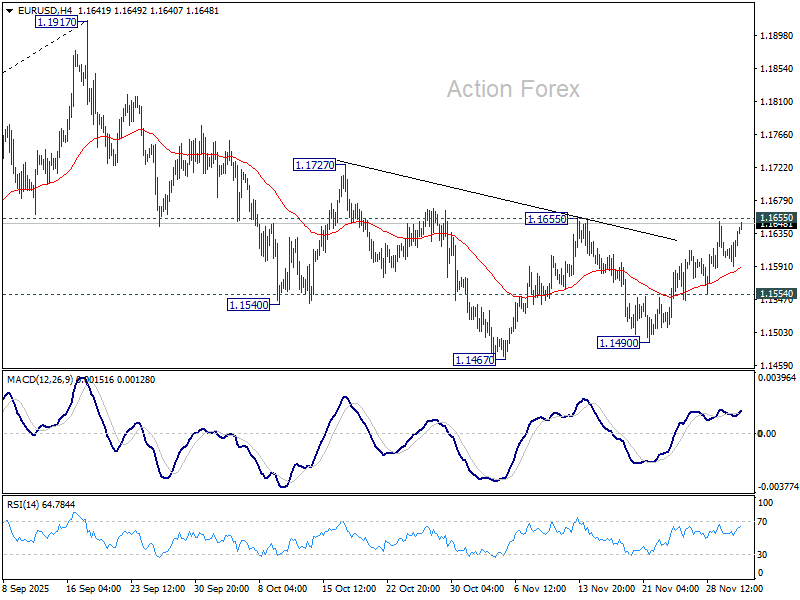
EIUR/USD rises slightly today but stays below 1.1655 resistance. Intraday bias remains neutral. On the upside, decisive break of 1.1655 will complete a head and should bottom pattern (ls: 1.1540, h: 1.1467, rs: 1.1490). That would argue that whole fall from 1.1917 has completed as a correction. Further rise should then be seen to 1.1727 resistance first. On the downside, though, below 1.1554 will turn bias to the downside for 1.1490 support first.
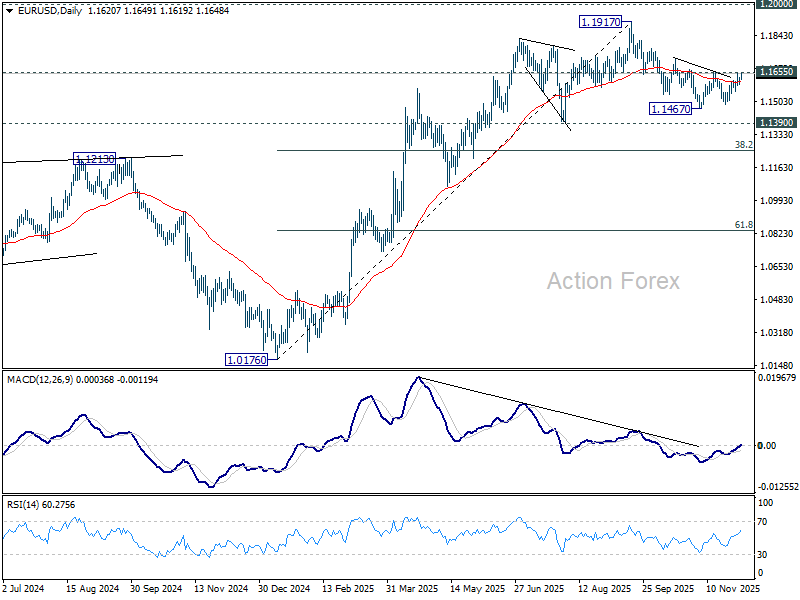
In the bigger picture, considering bearish divergence condition in D MACD, a medium term top is likely in place at 1.1917, just ahead of 1.2 key psychological level. As long as 55 W EMA (now at 1.1345) holds, the up trend from 0.9534 (2022 low) is still in favor to continue. Decisive break of 1.2000 will carry larger bullish implications. However, sustained trading below 55 W EMA will argue that rise from 0.9534 has completed as a three wave corrective bounce, and keep long term outlook bearish.
AUD/USD and AUD/JPY both eye breakouts after hawkish RBA remarks
Australian Dollar rallied sharply today after RBA Governor Michele Bullock signaled to Parliament that policymakers remain ready to tighten policy if inflation shows renewed persistence. Markets took her remarks as a clear indication that a rate hike in 2026 is possible—and that easing is firmly off the table for now. .
Soft Q3 GDP numbers briefly tempered expectations, but failed to stall Aussie’s advance. While quarterly growth undershot forecasts at 0.4% qoq, the 2.1% yoy expansion was still the strongest pace in two years, keeping concerns alive that domestic demand may be too resilient for inflation to retreat as quickly as hoped.
Markets now largely agree that rate cuts are off the table for an extended period, and a pre-emptive hike cannot be ruled out if upcoming data surprise on the upside.
Technically, AUD/USD’s break above 0.6579 reinforces that the correction from 0.6706 likely ended at 0.6420. The uptrend from the 2025 trough at 0.5913 may now be resuming, setting up a retest of 0.6706 peak. The key question is whether bullish momentum can build into that level or whether upside energy fades on approach.
AUD/JPY is also attempting a significant breakout as it challenges a dense cluster of resistance around 102. This zone includes the medium-term rising channel ceiling and the key 102.39 structural pivot. A clean break would represent an important bullish confirmation for longer-term AUD strength.
As long as 100.33 support holds, outlook for AUD/JPY stays bullish. Decisive break above 100% Projection of 94.38 to 100.93 from 96.24 at 102.79 should trigger upside acceleration towards 161.8% projection at 106.83.
China’s RatingDog PMI services falls to 52.1, expansion loses pace, employment and margins under pressure
China’s RatingDog Services PMI eased in November, slipping from 52.6 to 52.1, while Composite PMI fell from 51.8 to 51.2. Both measures remained in expansionary territory, but the decline signaled moderation in growth momentum heading into year-end.
Yao Yu, Founder of RatingDog, said the services sector remained “relatively stable,” though November’s reading marked the weakest level since Q2. External demand showed mild improvement and offered “marginal support,” but domestic conditions were less encouraging.
Employment contracted again, profit margins came under pressure, and business expectations weakened—factors Yao described as the “main constraints” on the sector.
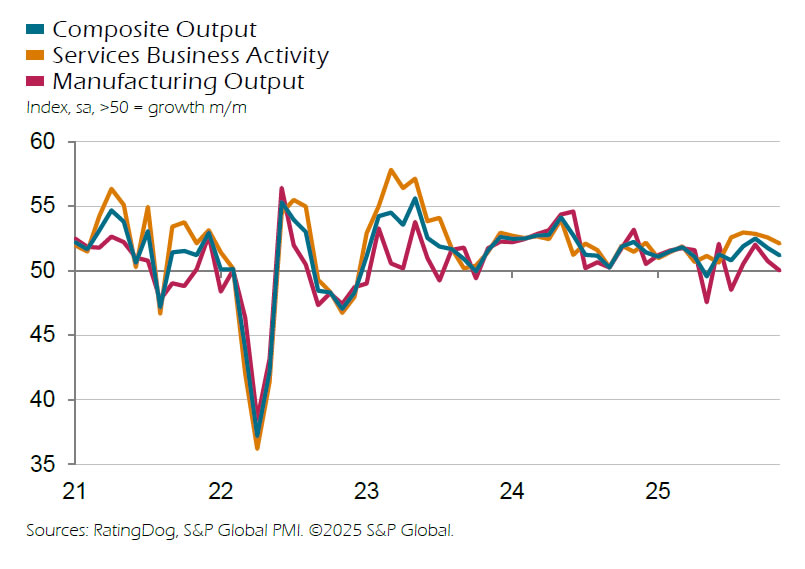
Japan PMI services holds strong at 53.2, optimism hits year high
Japan’s Services PMI was finalized at 53.2 in November, edging up from 53.1 in October. Composite PMI also improved, rising to 52.0 from 51.5. S&P Global’s Annabel Fiddes noted “a number of positive developments,” with the sector consistently driving overall activity since mid-year.
Forward-looking indicators strengthened notably. Business optimism and hiring intentions both climbed to their highest levels since early 2025. New orders also accelerated modestly, the first pickup in three months, signaling a gradual improvement in underlying demand even if the pace remains mild. However, the positive momentum was accompanied by firmer inflation pressures. Input costs rose at the fastest rate since May, prompting another solid increase in selling prices as firms sought to protect margins.
With Japan’s new stimulus package now approved—aimed at supporting growth and offsetting rising costs—markets will be watching closely to see whether demand and output continue to improve in the coming months.
RBA’s Bullock warns inflation persistence may require renewed tightening
RBA Governor Michele Bullock told the Senate Economics Legislation Committee that the bank remains on high alert for renewed inflation pressure and is prepared to act if price gains prove "more persistent" than expected. She noted that upcoming data in the next few months will be crucial in determining whether demand pressures are easing, adding that officials may still have to pivot back toward tightening if inflation shows signs of regaining strength.
Facing questions on past budget and inflation mis-projections, Bullock conceded the RBA “hasn’t done it yet” in bringing inflation sustainably back to target, and must continue working toward that objective. She stressed that the board must “keep working on this”.
With national debt set to exceed AUD 1 trillion and a deficit of AUD 42 billion projected, she noted that lower public and private savings—if paired with unchanged investment—could "put upward pressure on the neutral rate,” she said."
But she added that that such an outcome is possible but contingent on both domestic and global forces. She emphasized that while the RBA can respond to domestic dynamics, but we don’t control global factors."
Australia Q3 GDP misses forecast at 0.4%, per capita output stagnates
Australia’s economy expanded 0.4% qoq in Q3, below expectations for 0.7% and marking a softer outcome despite a 2.1% yoy rise from a year earlier. The headline result reflected steady domestic activity supported by private investment and household consumption. However, GDP per capita was flat, suggesting growth is tracking population gains rather than delivering broad-based improvement in living standards.
A key drag came from external accounts. Inventory rundown—used to support export volumes—subtracted meaningfully from growth, while net trade also weighed as imports rose faster than exports. The pattern highlights ongoing pressure on Australia’s trade balance even as domestic demand remains resilient.
Grace Kim, ABS head of National Accounts, described Q3 performance as “steady,” noting growth matched the post-pandemic quarterly average. Kim added that per capita GDP stagnation reflected population dynamics rather than outright weakness in activity, with the measure still 0.4% above its level a year earlier.
First Impressions: Australian National Accounts, September Quarter 2025
Meeting Demand Through Stockpiles Today, Productivity Tomorrow
- The September quarter National Accounts show growth slowed to 0.4%qtr – this was softer than both the 0.8%qtr expected by Westpac Economics and the 0.7%qtr expected by the market. Despite this, upward revisions to previous activity saw the year-ended outcome accelerate to 2.1%yr – this year-ended growth rate was in line with Westpac Economics forecasts of 2.3%yr.
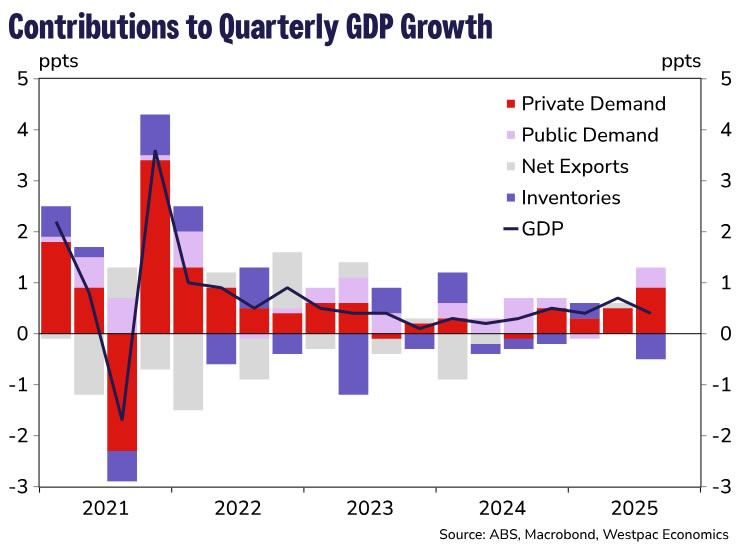
- Domestic demand was strong, accelerating as Australia’s economic upswing broadened to include business investment and the construction sector, while new public demand resumed its climb after going sideways over the past two quarters. However, the pickup in housing construction and business investment was a little softer than we expected.
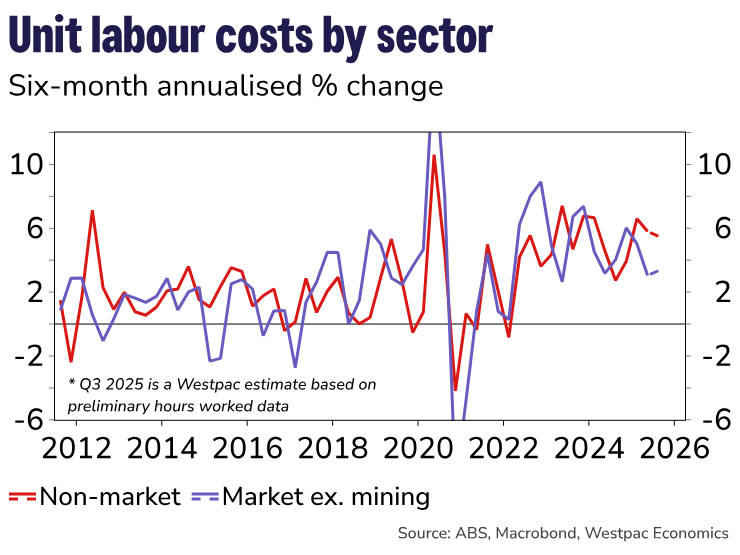
- Inventory stockpiles were run down to meet this demand. Going forward increasing demand is likely to be met by more capacity with productivity growth accelerating to 0.8%yr. Looking at the market (ex-mining) sector, the productivity turnaround appears to be more impressive, accelerating to 1.4%yr.
The detail
The September quarter National Accounts show growth slowed to 0.4% over the quarter while upward revisions to previous activity saw the year-ended outcome accelerate to 2.1%yr – a touch above the RBA’s updated trend estimate of +2.0%yr but slightly below Westpac Economics’ estimate of trend.
Domestic demand (spending by consumers, businesses, and governments) grew a solid 1.2%qtr over the September quarter and 2.6% in year-ended terms – the strongest quarterly growth since the June quarter 2012 (outside the pandemic). There was no need for a ‘handover’ with both the private and public sectors contributing to the pickup in domestic demand.
New private demand grew a strong 1.2%qtr and 3.1% in year-ended terms – also the fastest quarterly pace since the March quarter 2012 (outside the pandemic). While the consumer contributed, the standout was new business investment which grew 3.4%qtr and 3.8%yr. Despite this lift, the outcome was a touch softer than our 5.8%qtr forecast as engineering construction disappointed on the downside (-0.7%qtr v forecast of 2.0%qtr). Victoria recorded an outsized sharp 8.0% fall in engineering construction activity. Timing difference with the construction work done partial is one possible explanation of this discrepancy.
The positive news was that we saw investment increases across most of the asset classes, including machinery (7.5%qtr and 6.2%yr); and new building (2.0%qtr and 2.1%yr). And while data centre fit outs and the purchase of civil aircrafts were the main contributors to the boost in machinery, capex data showed that the lift was broader to also include consumer facing industries (such as accommodation and food services) and some business facing industries (such as administrative and support services).
Housing construction activity grew 1.8%qtr and 6.5%yr. Here too the quarterly outcome was softer than we expected based on the partial data (+1.8%qtr v +3.2%qtr). However, the year ended outcome was in line with our forecasts as activity in previous quarters was revised higher. The quarterly outcome was driven by both the construction of new dwellings (2.6%qtr) and renovation activity (0.5%qtr). There remains a healthy pipeline of projects to work through, which should support housing construction activity going forward.
Firmer consumer spending extended into Q3, with household spending growing 0.5%qtr and 2.5%yr. This follows the bumper June quarter outcome of 0.9%qtr, which was partly driven by one-offs including the roll-off of state electricity rebates, larger than usual EOFY discounting, and holiday spend around Easter and ANZAC Day.
With population growth projections running at 1.7%yr, this implies consumption per capita has started to post sizable increases. The Aussie consumer continues to be supported by rising real incomes which grew 0.9%qtr and 3.8%yr. A key uncertainty is whether this income boost will fade if interest rates were to remain on hold for longer and as the Stage 3 tax cuts are chewed away by bracket creep (we saw personal income tax increase as a share of household income this quarter). Without this boost, consumption could slow which would have implications for the labour market.
On the flip side, the upswing is likely to gain greater momentum the longer it runs, which increases the likelihood it will become self-sustaining, boosting incomes and supporting consumption going forward. The Westpac–DataX Card Tracker Index shows spending picked up in October, suggesting momentum is extending to the December quarter.
Net exports and inventories were broadly in line with expectations. A rundown in mining, public sector, and consumer goods inventories has detracted around 0.5ppts from Q3 growth, while net exports added a further 0.1ppt drag.
Note, the statistical discrepancy detracted 0.1ppt from growth over the quarter, compared to a 0.2ppt contribution last quarter.
It’s not only demand, supply is also responding
Labour productivity bounced to grow 0.8%yr. Digging a little deeper, we estimate that productivity in the market (ex-mining) sector grew at around 1.4%yr in Q3 (estimates will be finalised after Friday’s Labour Accounts).
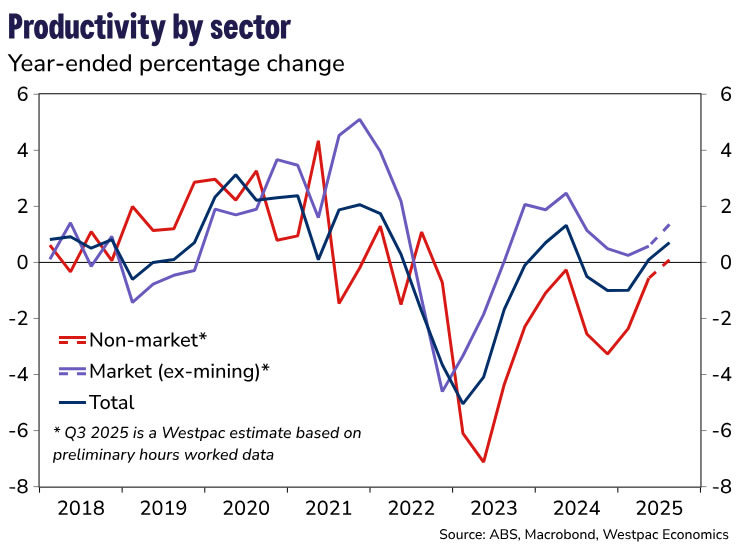
As well as moderating growth in the sector’s unit labour costs to around 3.3% in six-month annualised terms, this supports the view that whole-economy productivity growth will recover as the sector-specific factors in mining and the care economy wash out.
WTI Crude Oil Struggles To Extend Gains, Risk of Another Drop?
Key Highlights
- WTI Crude Oil prices started a recovery wave from $57.20.
- A key bearish trend line is forming with resistance at $60.30 on the 4-hour chart.
- Gold started a fresh increase above $4,150 and $4,180.
- EUR/USD is consolidating below the 1.1650 resistance zone.
WTI Crude Oil Price Technical Analysis
WTI Crude Oil price found support near $57.20 against the US Dollar. It started a recovery wave above the $58.20 and $58.50 levels.
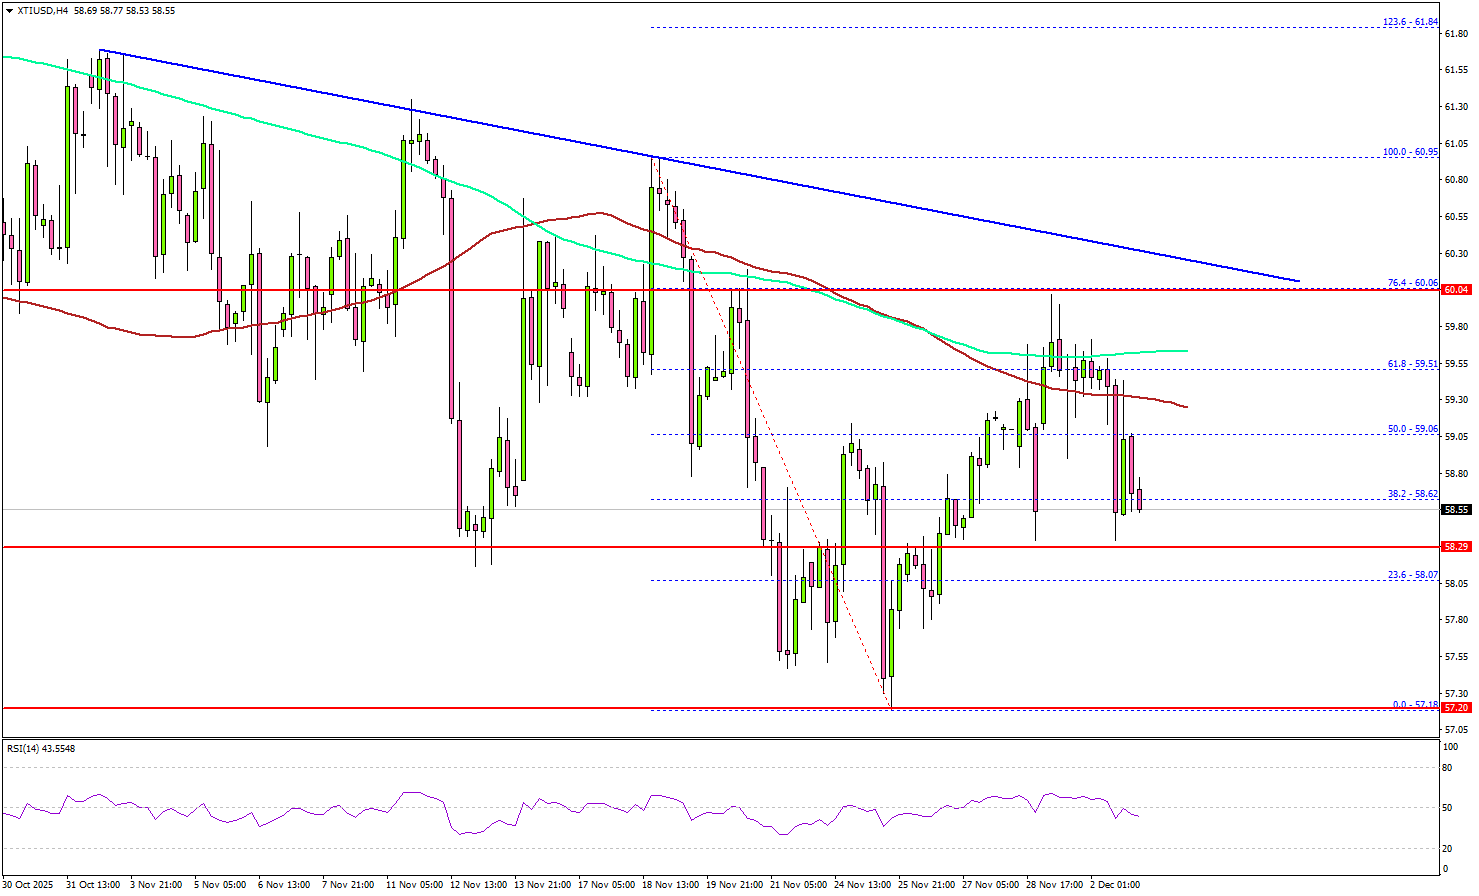
Looking at the 4-hour chart of XTI/USD, the price surpassed the 50% Fib retracement level of the downward move from the $60.95 swing high to the $57.18 low. However, the bears remained active near the 100 simple moving average (red, 4-hour) and the 200 simple moving average (green, 4-hour).
On the upside, immediate resistance is near the $59.60 level. The first key hurdle for the bulls could be $60.00. The main hurdle sits at $60.50. There is also a bearish trend line forming with resistance at $60.30.
A close above $60.50 might send Oil prices toward $62.20. Any more gains might call for a test of $65.00 in the near term.
On the downside, the first major support sits near the $58.60 zone. The next support could be $58.30. A daily close below $58.30 could open the doors for a larger decline. In the stated case, the bears might aim for a drop toward $56.20. Any more losses could open the doors for a test of the $55.00 zone.
Looking at Gold, the bulls remained in action, and the price started a fresh increase above the $4,180 resistance.
Economic Releases to Watch Today
- Euro Zone Services PMI for Sep 2025 – Forecast 53.1, versus 53.1 previous.
- UK Services PMI for Sep 2025 – Forecast 50.5, versus 50.5 previous.
- US S&P Services PMI for Sep 2025 – Forecast 55.0, versus 55.0 previous.
- US ISM Manufacturing Index for Sep 2025 – Forecast 52.1, versus 52.4 previous.
Gold Price Forecast: Bullion Retreats to $4,205 on Profit-Taking; US Data Hints at December Rate Cut
Falling to $4,205, down 0.63%, gold pricing has retraced from recent highs in today’s trading.
Having recently painted new six-week highs, rallying from support at $4,056, downside in today’s session can be considered primarily technical profit-taking.
While the fundamental footing for precious metals remains firm, recent US data, particularly in the US labour market, continues to add to the dovish narrative, bolstering metal pricing.
What’s next for gold?
Gold (XAU/USD): Key takeaways 02/12/2025
- Fair to say, recent gold upside comes almost entirely from developments around the Federal Reserve, with commentary suggesting an increasingly dovish stance ahead of their December decision
- Particularly regarding recent US labour data, made worse by a ninth consecutive decline in industrial activity confirmed in yesterday’s US Manufacturing PMI report, the case for rate cuts is growing, benefiting gold pricing
- Otherwise, the running for the next Chair of the Federal Reserve, the likely installation of a more Trump-aligned candidate, and the associated expectations of rate cuts, are further boosting the current rally
Gold (XAU/USD): Dovish Fed tilt in ascendancy
I usually write about precious metal markets once a week or so, and seven days ago, I mentioned that something of a ‘dovish U-turn’ was currently underway, offering a new lease of life to recent gold upside.
Since then, not only has gold price continued to rise by over 2%, but the dovish narrative also appears to be expanding, owing to recent US economic data. This is no coincidence, of course - the two variables are inextricably linked.
As ever, let’s dive into some of the macroeconomic themes, but fair warning: this is going to be Federal Reserve-heavy.
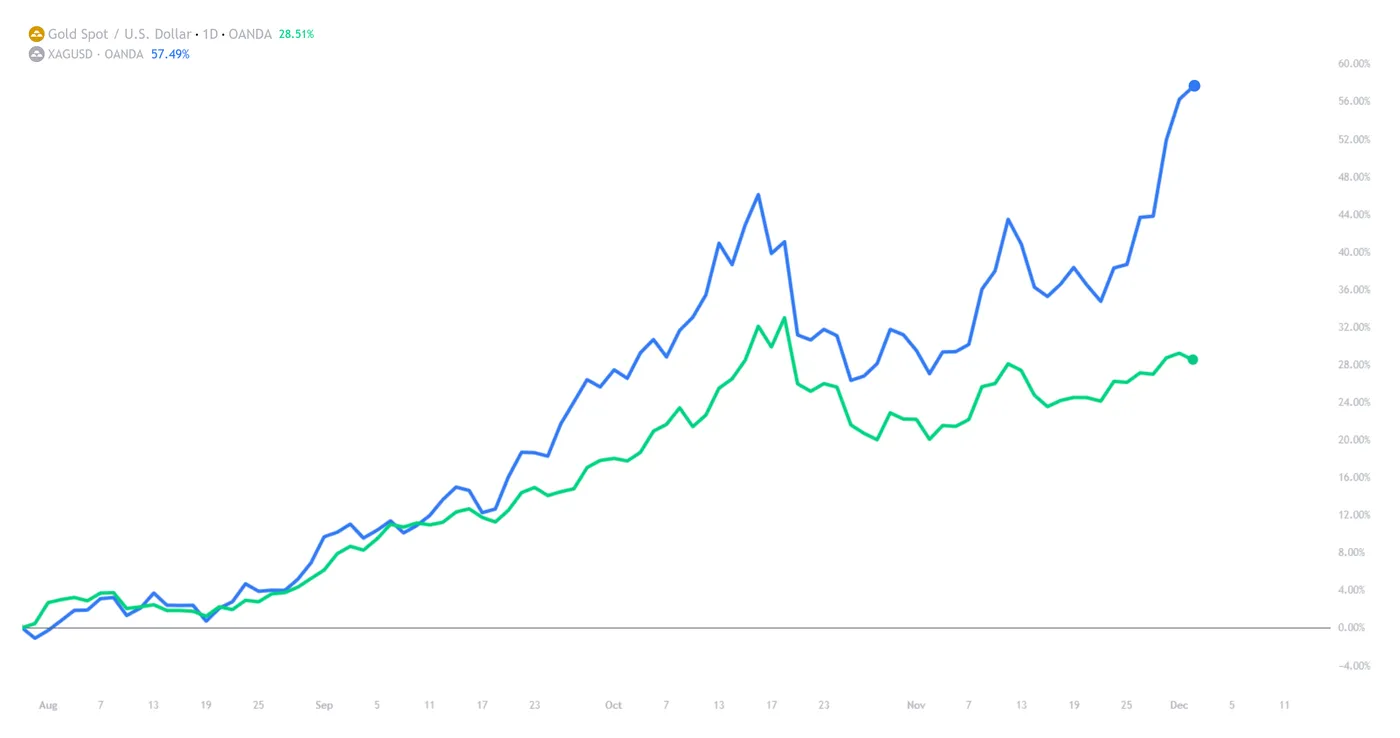
Gold (XAU/USD) vs Silver (XAG/USD), D1, OANDA, TradingView, 02/12/2025
Gold (XAU/USD): Fundamental Analysis 02/12/2025
Policymakers Daly and Waller further dovish Fed narrative:
It seems like yesterday that I was not only writing, but also appearing on the Market Insights Podcast, commenting on the Federal Reserve’s decision to cut rates in October, with the obvious question being if a third consecutive cut would follow in December.
While it would be fair to say that markets anticipate rate cuts to come, the speed at which their easing cycle would continue was, of course, the $1,000,000 question.
And by most accounts, the answer was a resounding yes, with many expecting a third 25 basis point cut would conclude 2025, leaving the target rate at 3.50-3.75%, its lowest level since late 2022.
Since then, however, a growing hawkish sentiment emerged from the Federal Reserve, with odds of a December rate cut falling to less than ~50%, in line with policymaker commentary.
At the time, Powell had previously cautioned markets on the assumption that cuts would continue thick and fast, and it seemed the markets were starting to believe that the December decision would be his chance to stand his ground, especially with a handsome beat to consensus for September’s NFP.
In hindsight, however, this was the peak of the hawkish narrative, with what’s happened since signifying one of the most contested periods of monetary policy stance that I can remember.
What started with Fed Williams, who made some dovish commentary speaking at a central bank conference in Chile, has continued with further dovish remarks from Daly and Waller, who have both cited the labour market as a larger priority than inflation, at least for now, with the latter generally trending lower.

CME FedWatch, 02/12/2025
The result, as seen above, is a return to the same level of conviction seen directly after the October interest rate decision, with markets predicting an 89.0% chance of a 25-basis-point cut in December and rates remaining unchanged in January.
While markets have seemingly come full circle on monetary policy expectations, the notion of lower interest rates directly benefits gold, which explains, in no small part, recent upside.
US economic data to support rate cut notions
Positives
- The most recent NFP reading, and the last report before the Fed’s December decision, showed jobs added for September handsomely surpassed expectations, at +119,000 vs +50,000 expected
Negatives
- NFP numbers for both July and August were revised lower in the September report, with +33,000 less jobs added to the US economy than previously expected#
- NFP number for both July and August were historically low when compared to previous years
- Unemployment is rising, up 4.3% to 4.4% August to September
The astute amongst you will realise that the negatives far outweigh the positives.
While September’s result somewhat vindicated the previous hawkish stance of the Federal Reserve, it appears that, over time, the markets have become less convinced about the US labour market, alongside key Fed policymakers.
While it would be a challenging task to use three-month-old data in a decision to maintain rates, the real kicker is that inflation appears to be under control at 2.1%, removing the primary justification for rates being so historically high in the first place.
As a personal aside, it’s interesting to see that, despite the most significant labour data remaining unchanged, markets have been able to carve two separate narratives, using the same data to support both a hawkish or dovish stance - myself included.
With that said, nothing in the market is black and white, although the Fed’s opinion is the one that matters.
As such, the current angle on the US labour market adds to expectations for lower rates in December, boosting gold pricing.
Gold (XAU/USD): Technical Analysis 02/12/2025
XAU/USD: Daily (D1) chart analysis:

Gold (XAU/USD), D1, OANDA, TradingView, 02/12/2025
While the above paints a rosy picture for gold, it would be remiss not to mention that price has fallen somewhat in today’s trading, likely owing to technical profit-taking, albeit having recovered losses from earlier in the session.
I would be comfortable saying, however, that gold remains well supported both technically and fundamentally, with previous highs of $4,202 acting as the closest level of support.
Otherwise, and to the upside, our previous target of $4,240 has been met, with the price forming a pin bar to represent resistance.
To the upside, our next target is, of course, all-time highs; however, traders should be aware of the impending reduction in volatility due to the holiday season.
Price targets and support/resistance levels:
- Resistance #1 - $4,240 - Previous support/resistance
- Price target/Resistance #2 - $4,381 - All-time highs
- Support #1 - $4,202 - Previous high
- Support #2 - $4,056 - 20-Period SMA
- Support #3 - $4,000 - Key psychological level
- Support #4 - $3,889 - Swing low
Silver (XAG/USD) the Sole Performer, Heading Toward a New ATH
Our preceding analysis on Silver could not have been more wrong.
With the FOMC approaching and bouts of up-and-down action across all metals, what we thought to be a temporary top leading to a potential range was, in fact, just a retracement.
And that retracement was an opportunity not lost on Silver traders: a stark run during month-end trading took the precious metal to new record highs, grazing the $58.85 level.
The dovish repricing for the Fed's December 10 Meeting—main catalyst of the renewed "everything-rally" (or Debasement Trade) seen throughout stocks in the past week—was fuel for a sharp rally across the entire metals complex.
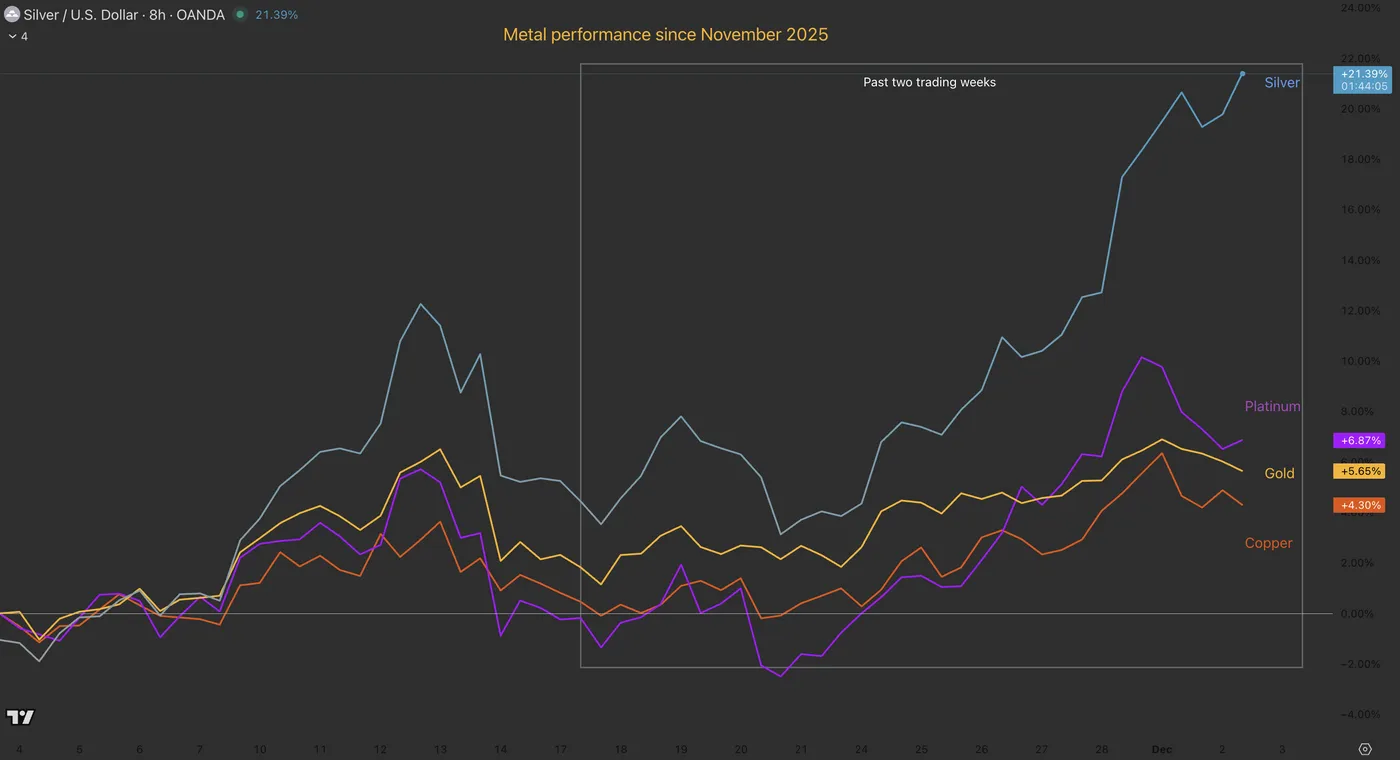
Metals performance since November 2025 – Source: TradingView
However, a distinct divergence has emerged in today's session.
Gold, Platinum, and Copper have all rejected their recent highs established on Friday, correcting lower as traders book profits.
It is a different story for Silver, which is showing remarkable relative strength, hanging less than 1% below its $58.85 record and running towards its retest.
Will it keep rallying or is the move finally over? Let's dive into the charts to see if this breakout has legs.
Silver (XAG/USD) Multi-timeframe Technical Analysis
Daily Chart
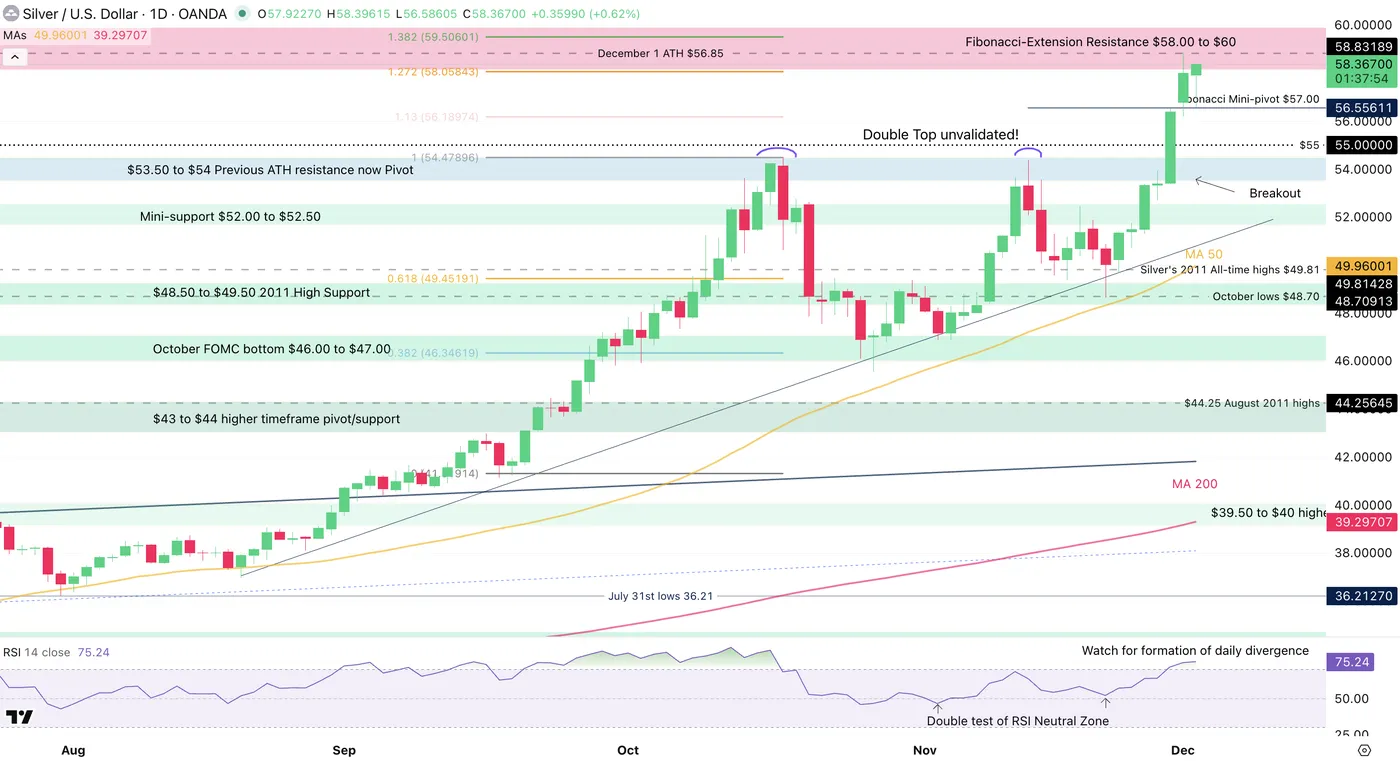
Silver Daily Chart, December 2, 2025 – Source: TradingView
The month-end action took Silver prices to a strong breakout after a month-and-half consolidation.
A double top did form throughout the two tests of the preceding $55.00 record, however, double top doesn't mean instant bear market.
On the other hand, it may have acted as a contrarian-fuel for higher prices as bearish positions accumulated before the month-end rally changed the plans.
Back to current trading, bulls have brought the metal right back into its $58.00 to $60 Resistance Zone, precedingly obtained with Fibonacci Extensions (see explanation here).
With the zone extending over a $2 range, there is space for trading but what traders should look is whether prices break and close above $60 on a daily session or if prices actually close below $58, indicating some rejection.
4H Chart and Technical Levels
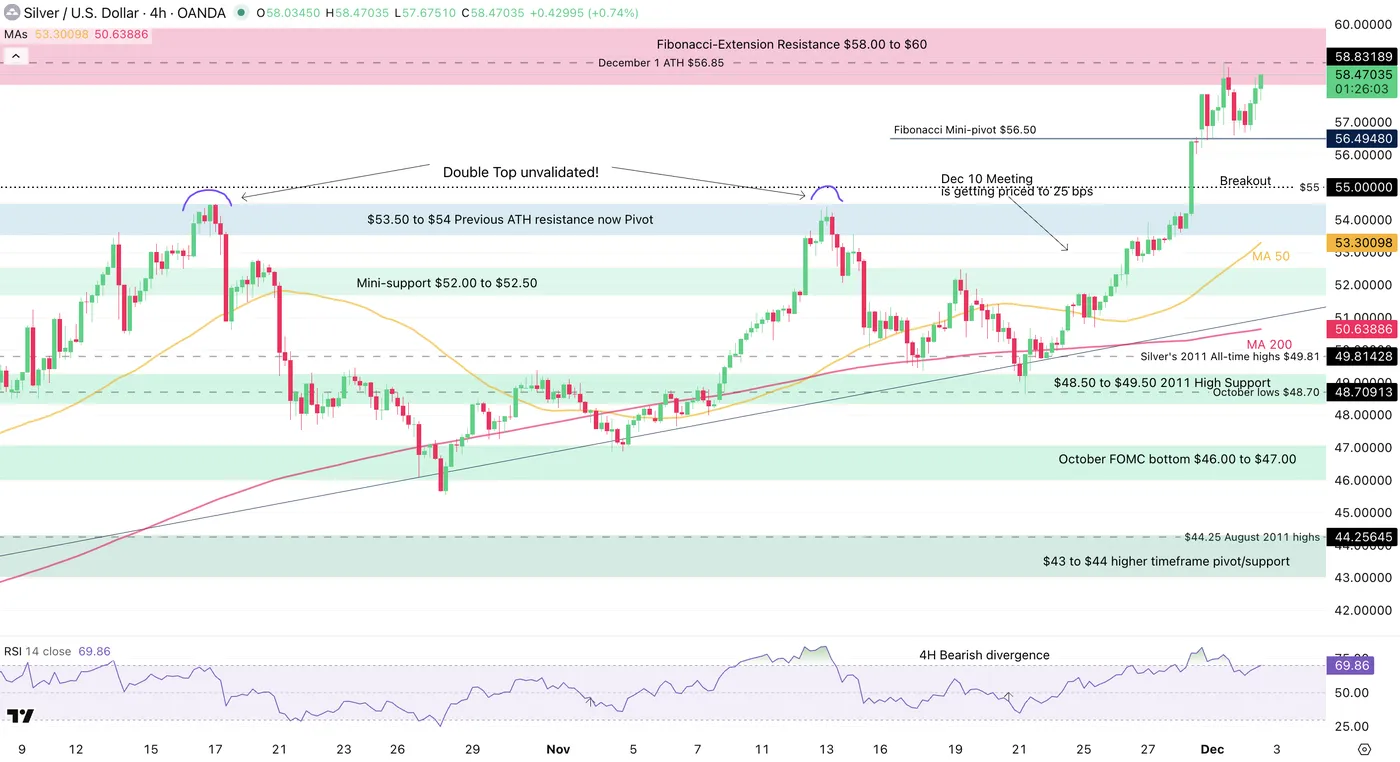
Silver 4H Chart, December 2, 2025 – Source: TradingView
The price action is getting tricky as buyer strength stands strong and prices are consolidating at the highs (typically bullish) but a 4H divergence is appearing.
Levels to watch for Silver (XAG) trading:
Resistance Levels:
- Fibonacci-Extension Resistance $58.00 to $60
- December 1 All-Time Highs $56.85
- $53.50 to $54 current ATH resistance
- Potential resistance $62 to $65 (1.618 from Impulsive Move)
Support Levels:
- $53.50 to $54 Previous ATH resistance now Pivot
- Mini-support $52.00 to $52.50
- $48.50 to $49.50 2011 High Support
- October FOMC bottom $46.00 to $47.00
- $45.55 October 28 lows
1H Chart
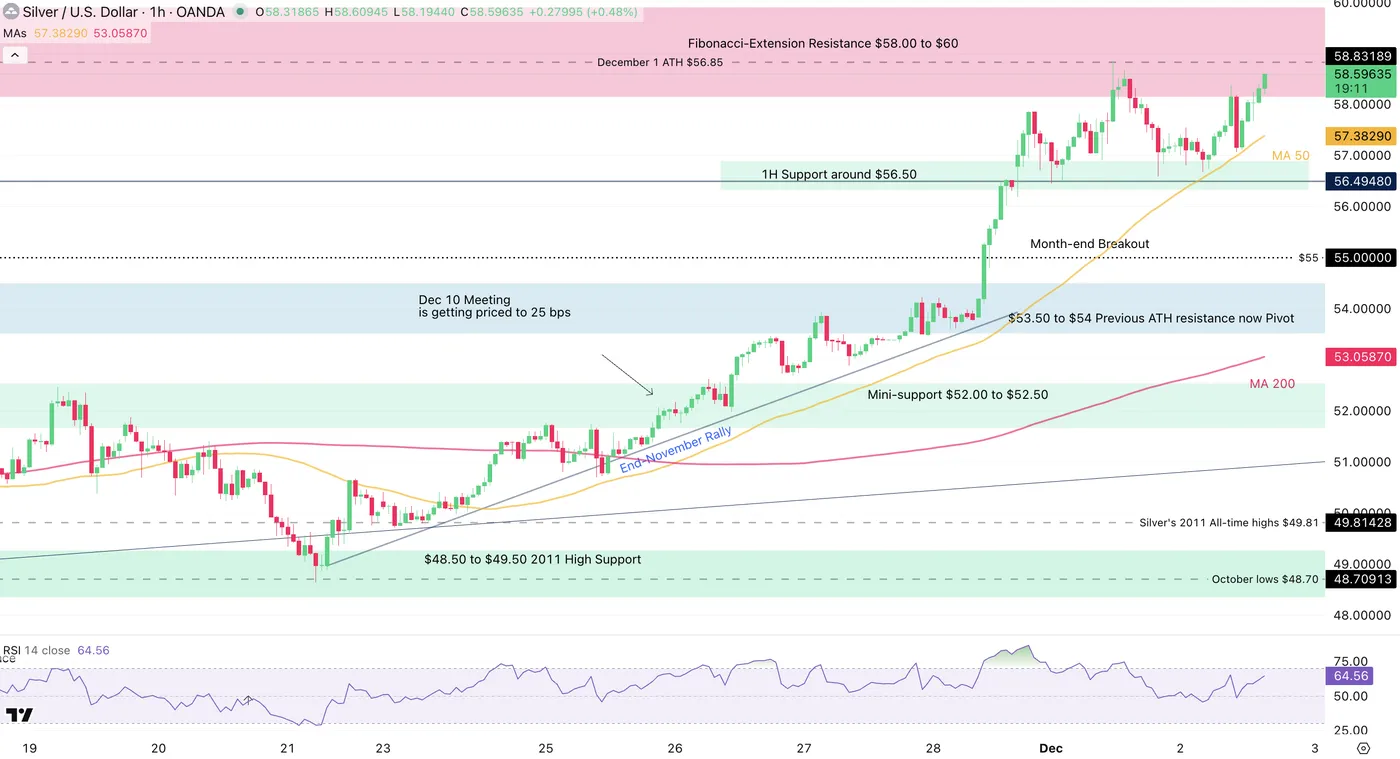
Silver 1H Chart, December 2, 2025 – Source: TradingView
The rangebound action is occuring much higher than last week – As higher momentum charts stand in overbought territory, short-term consolidation at the highs serve to reduce effect of overbought trading.
An ongoing move might take on the record highs reached yesterday – For intraday analysis look at the 1H 50-period Moving Average, frequently used by buyers in this uptrend.
Holding it provides entry points to join the rally, while breaking the Moving Averages gives signal of a short-term bearish reversal.
Safe Trades!