Sample Category Title
EUR/USD: Larger Bulls Remain in Play Ahead of Key Economic Events
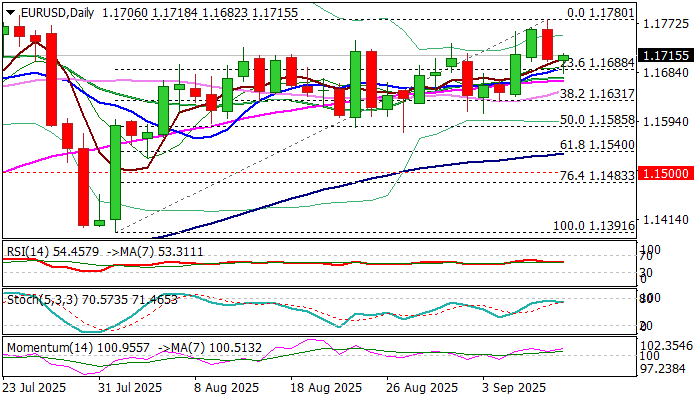
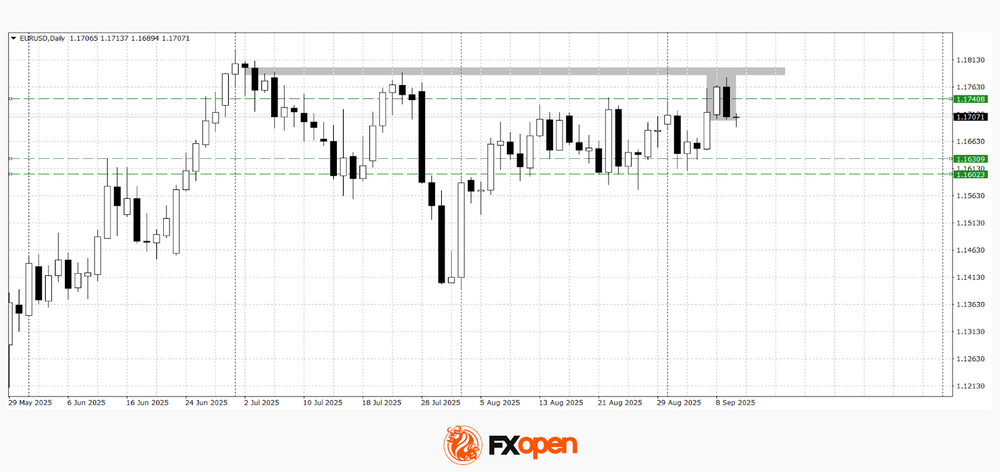
EURUSD extended pullback on early Wednesday, following nearly 0.5% drop on Tuesday, but fresh bears were so far limited despite initial negative signal on formation of bearish engulfing pattern on daily chart.
Initial Fibo support at 1.1690 (23.6% of 1.1391/1.1780) reinforced by 10DMA provides solid support which contained today’s dips.
Technical picture on daily chart is predominantly bullish, though early next week’s daily cloud twist would be magnetic and attract bears for probe through 1.1690 and attack at next key levels at 1.1630/10 zone (Fibo 38.2%/Sep 2,3 higher lows.
Traders eye key economic events, ECB interest rate decision and US Aug CPI, due on Thursday.
The European Central Bank is expected to keep rates on hold at 2%, as Eurozone consumer prices are steady around the ECB’s target.
Fed meets next week, and it is widely expected to deliver the first rate cut (25 basis points), with strong weakening in the US labor sector increasing pressure for policy easing, as US policymakers see still elevated inflation as temporary, with current restrictive monetary policy expected to absorb negative impacts.
Res: 1.1736; 1.1780; 1.1800; 1.1830.
Sup: 1.1690; 1.1630; 1.1610; 1.1574.
Low Inflation in China Supports the Yuan
Deflation persists, creating opportunities to stimulate the Chinese economy. Without these measures, conditions are created for the yuan to strengthen.
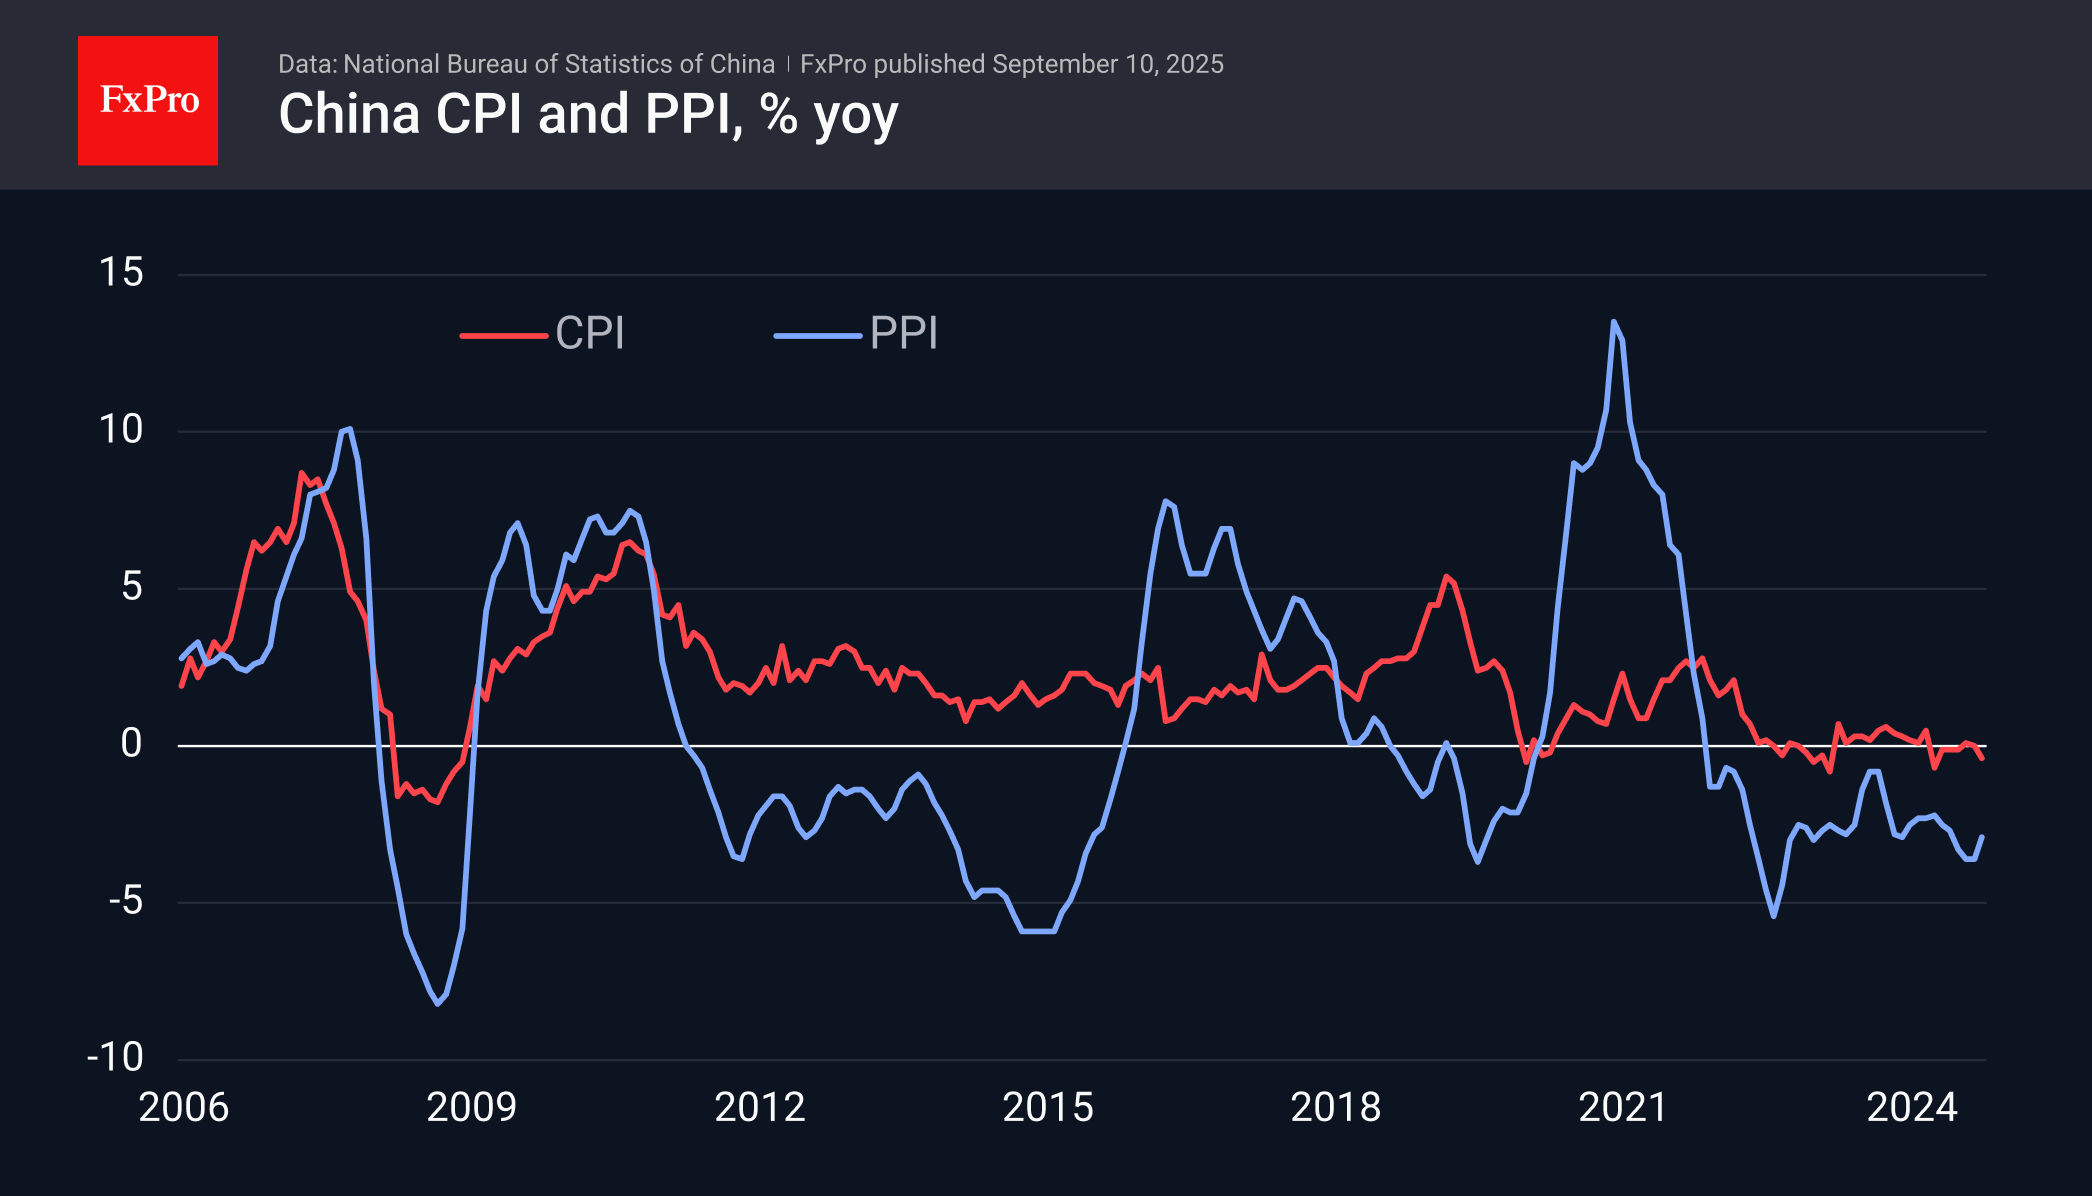
In August, the consumer price index returned to negative territory, dropping 0.4% year over year. Over the past two years, the average inflation rate has been zero, making it appropriate to discuss deflation in China.
The producer price index was 2.9% lower than a year earlier. While this represents a slowdown in the rate of decline, it is still a negative trend that has been evident in this indicator for the last 35 months, or nearly three years. Producer prices are an important factor that puts pressure on final selling prices, allowing China to retain its title as an exporter of deflation.
Developed countries would consider such inflation rates a reason to ease monetary policy, lower rates, or stimulate final demand in some other way. However, the People’s Bank of China is pursuing a different strategy. It has kept rates unchanged since May to avoid creating bubbles in the housing sector.
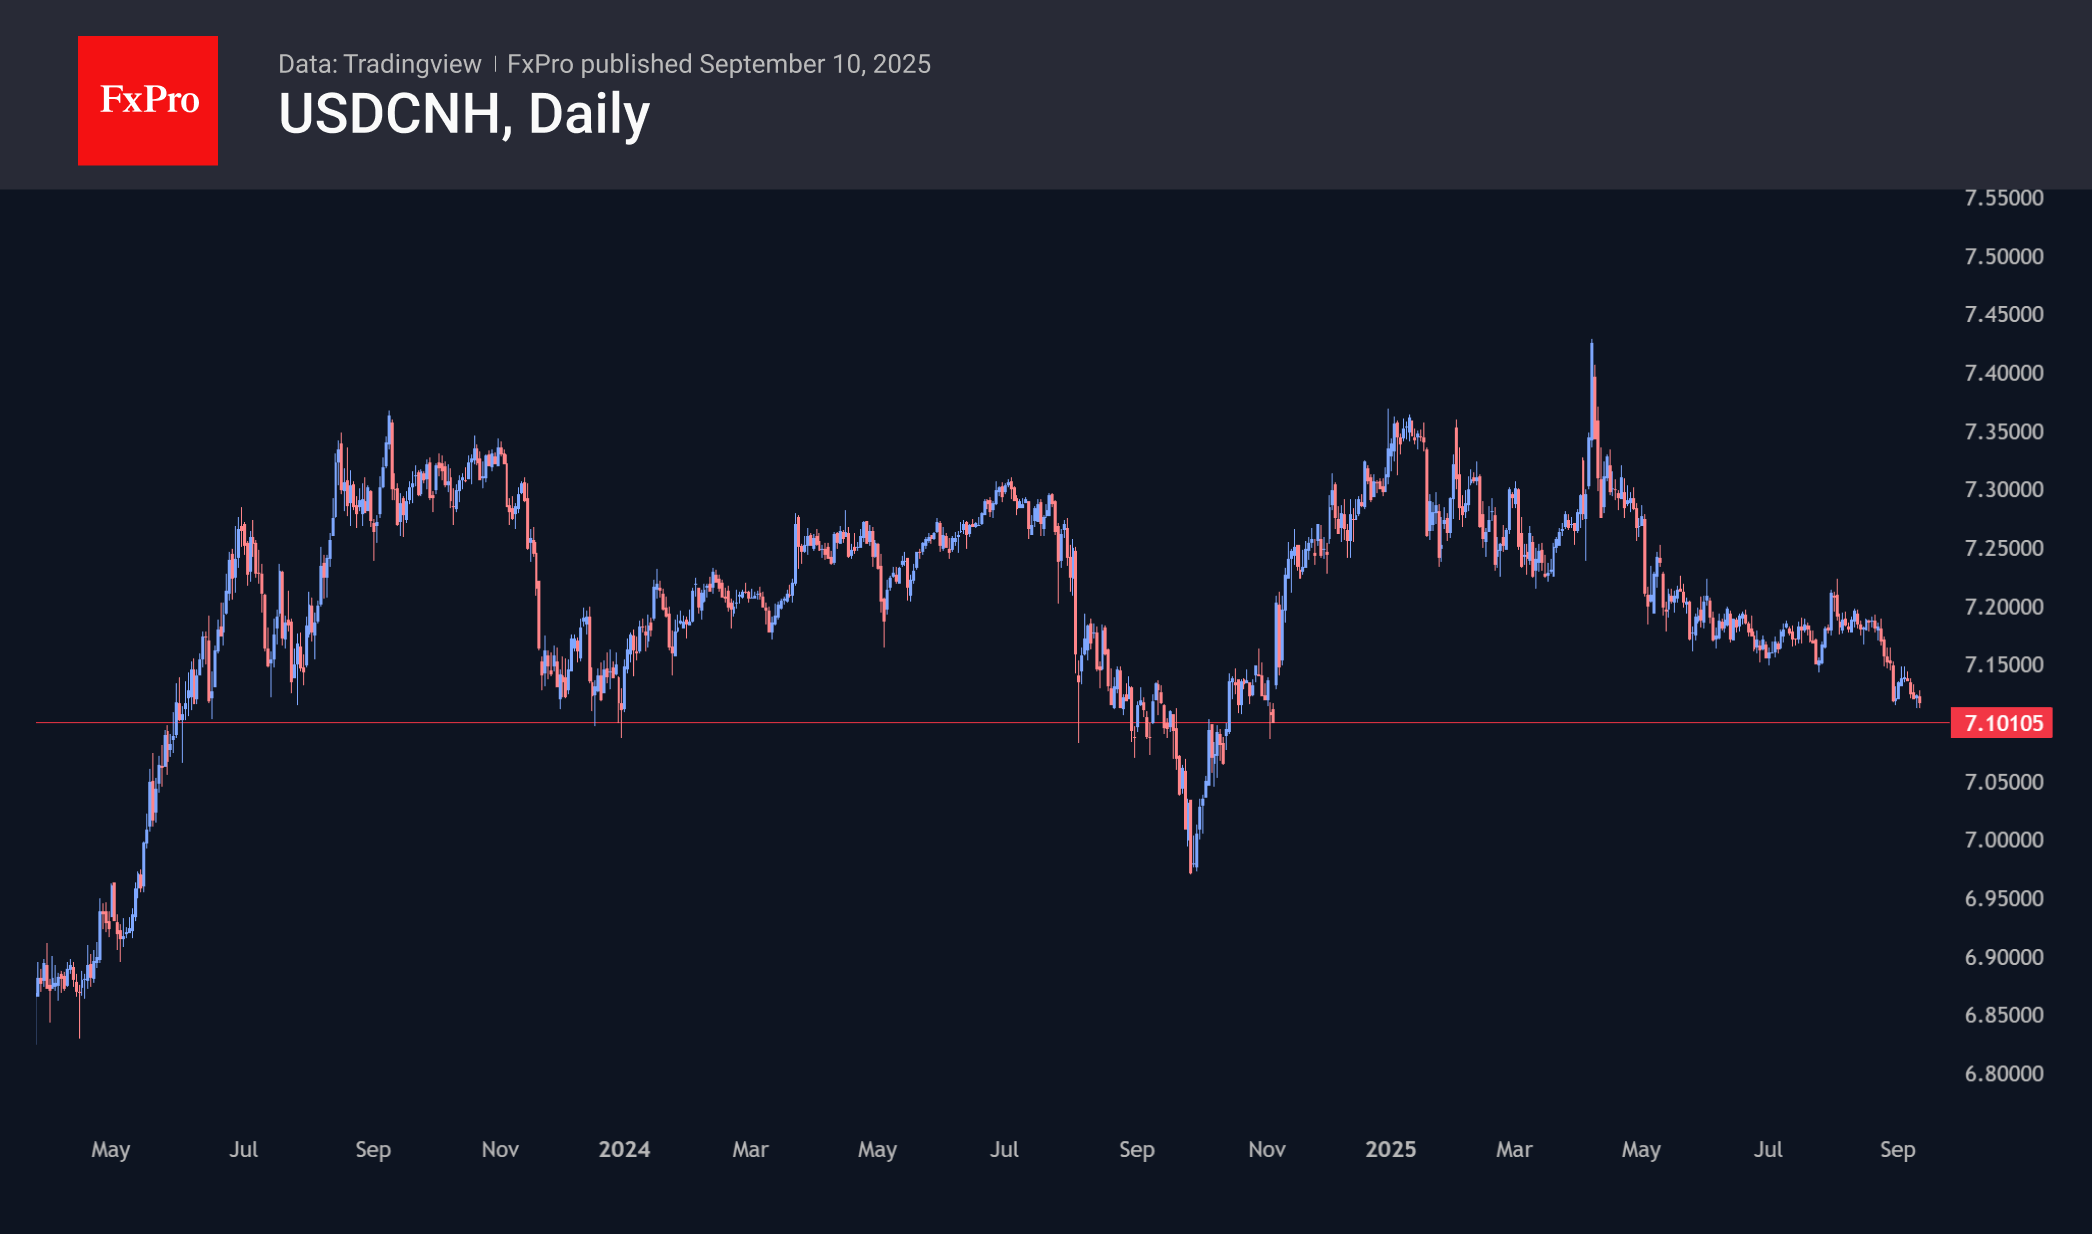
The government and central bank do not seem to consider low inflation a problem that supports the national currency. Since the beginning of August, the USDCNH exchange rate has been drifting downward, losing 1.3%. Although growth rates are not high, they have brought the exchange rate back to its lows since Trump’s presidential election victory. The USDCNH exchange rate has been supported near the current levels of 7.11 over the past two years, although it slipped down in September and October of last year.
Technically, current levels may attract buyers, but traders should monitor the situation closely to determine whether a real reversal of the dollar’s long-term trend is occurring.
USD/JPY Pauses After Volatility: Assessing the Path Ahead
The USD/JPY pair consolidated around 147.32 JPY on Wednesday, following sharp fluctuations earlier in the week. Market participants are awaiting key US inflation data, which could significantly influence the Federal Reserve’s policy decision next week.
The recent downward revision of US employment statistics has strengthened the case for earlier monetary easing by the Fed. Some investors are even pricing in the possibility of a more aggressive 50-basis-point rate cut.
In Japan, a private survey revealed that business sentiment in the manufacturing sector reached a three-year high, driven mainly by reduced trade risks after the conclusion of a tariff agreement with the US.
On the political front, markets are monitoring the aftermath of Prime Minister Shigeru Ishiba’s resignation, which resulted from deepening divisions within the ruling party and political pressure following last year’s election defeat.
Technical Analysis: USD/JPY
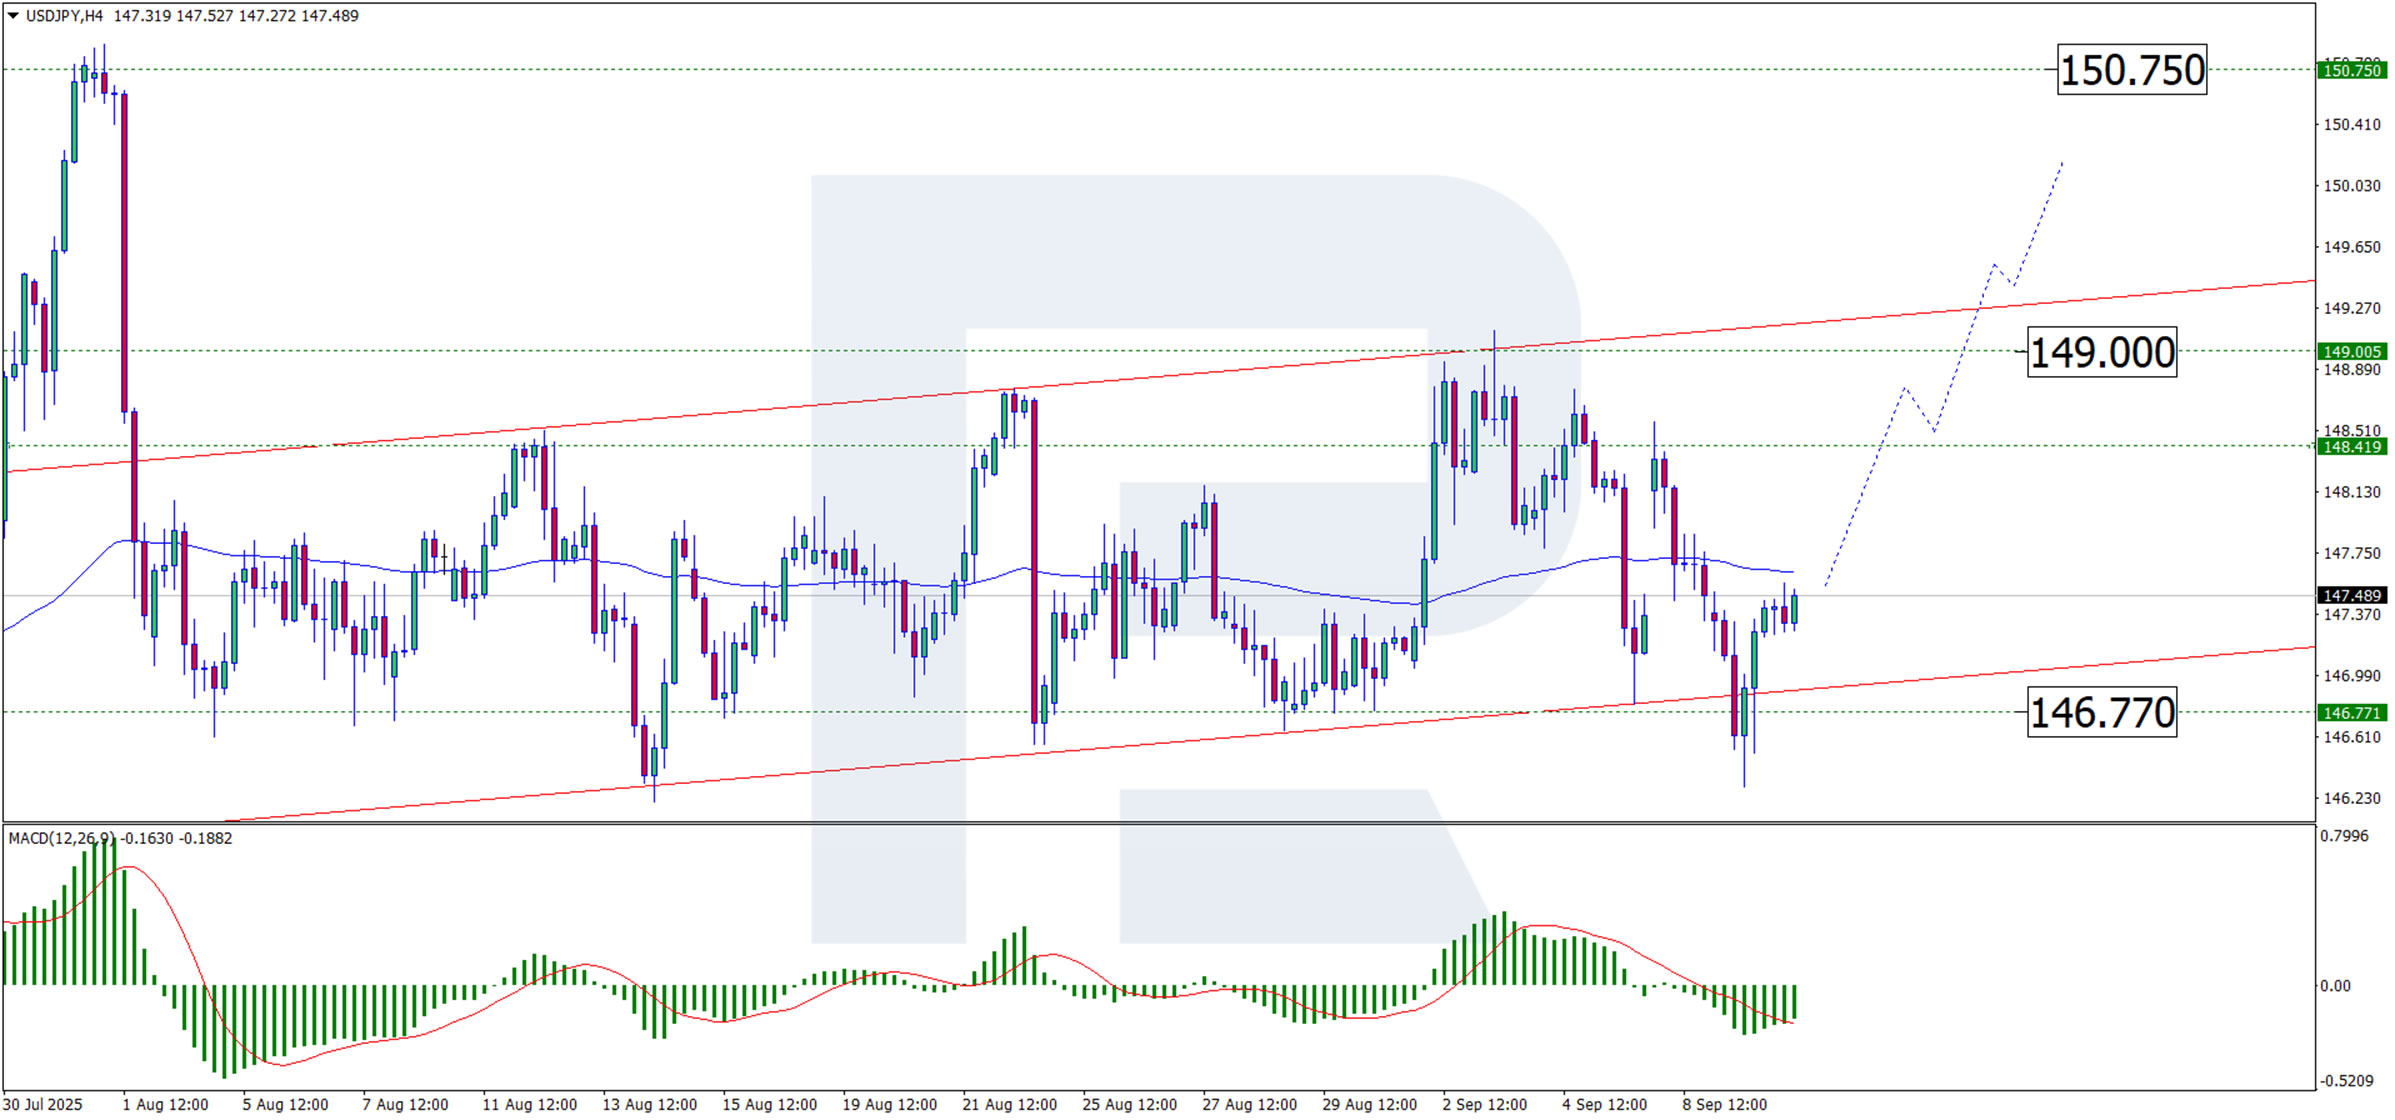
H4 Chart:
On the H4 chart, USD/JPY continues to develop an upward wave within an ascending channel. The next likely target is the upper channel boundary near 148.40 JPY. Following this ascent, the pair may enter a corrective phase. The primary upside targets remain 149.00 JPY, with a further objective at 150.75 JPY. The MACD indicator supports this outlook: the histogram remains below zero but has begun to rise, while the signal line has moved above the histogram and is turning upward, signalling building bullish momentum.
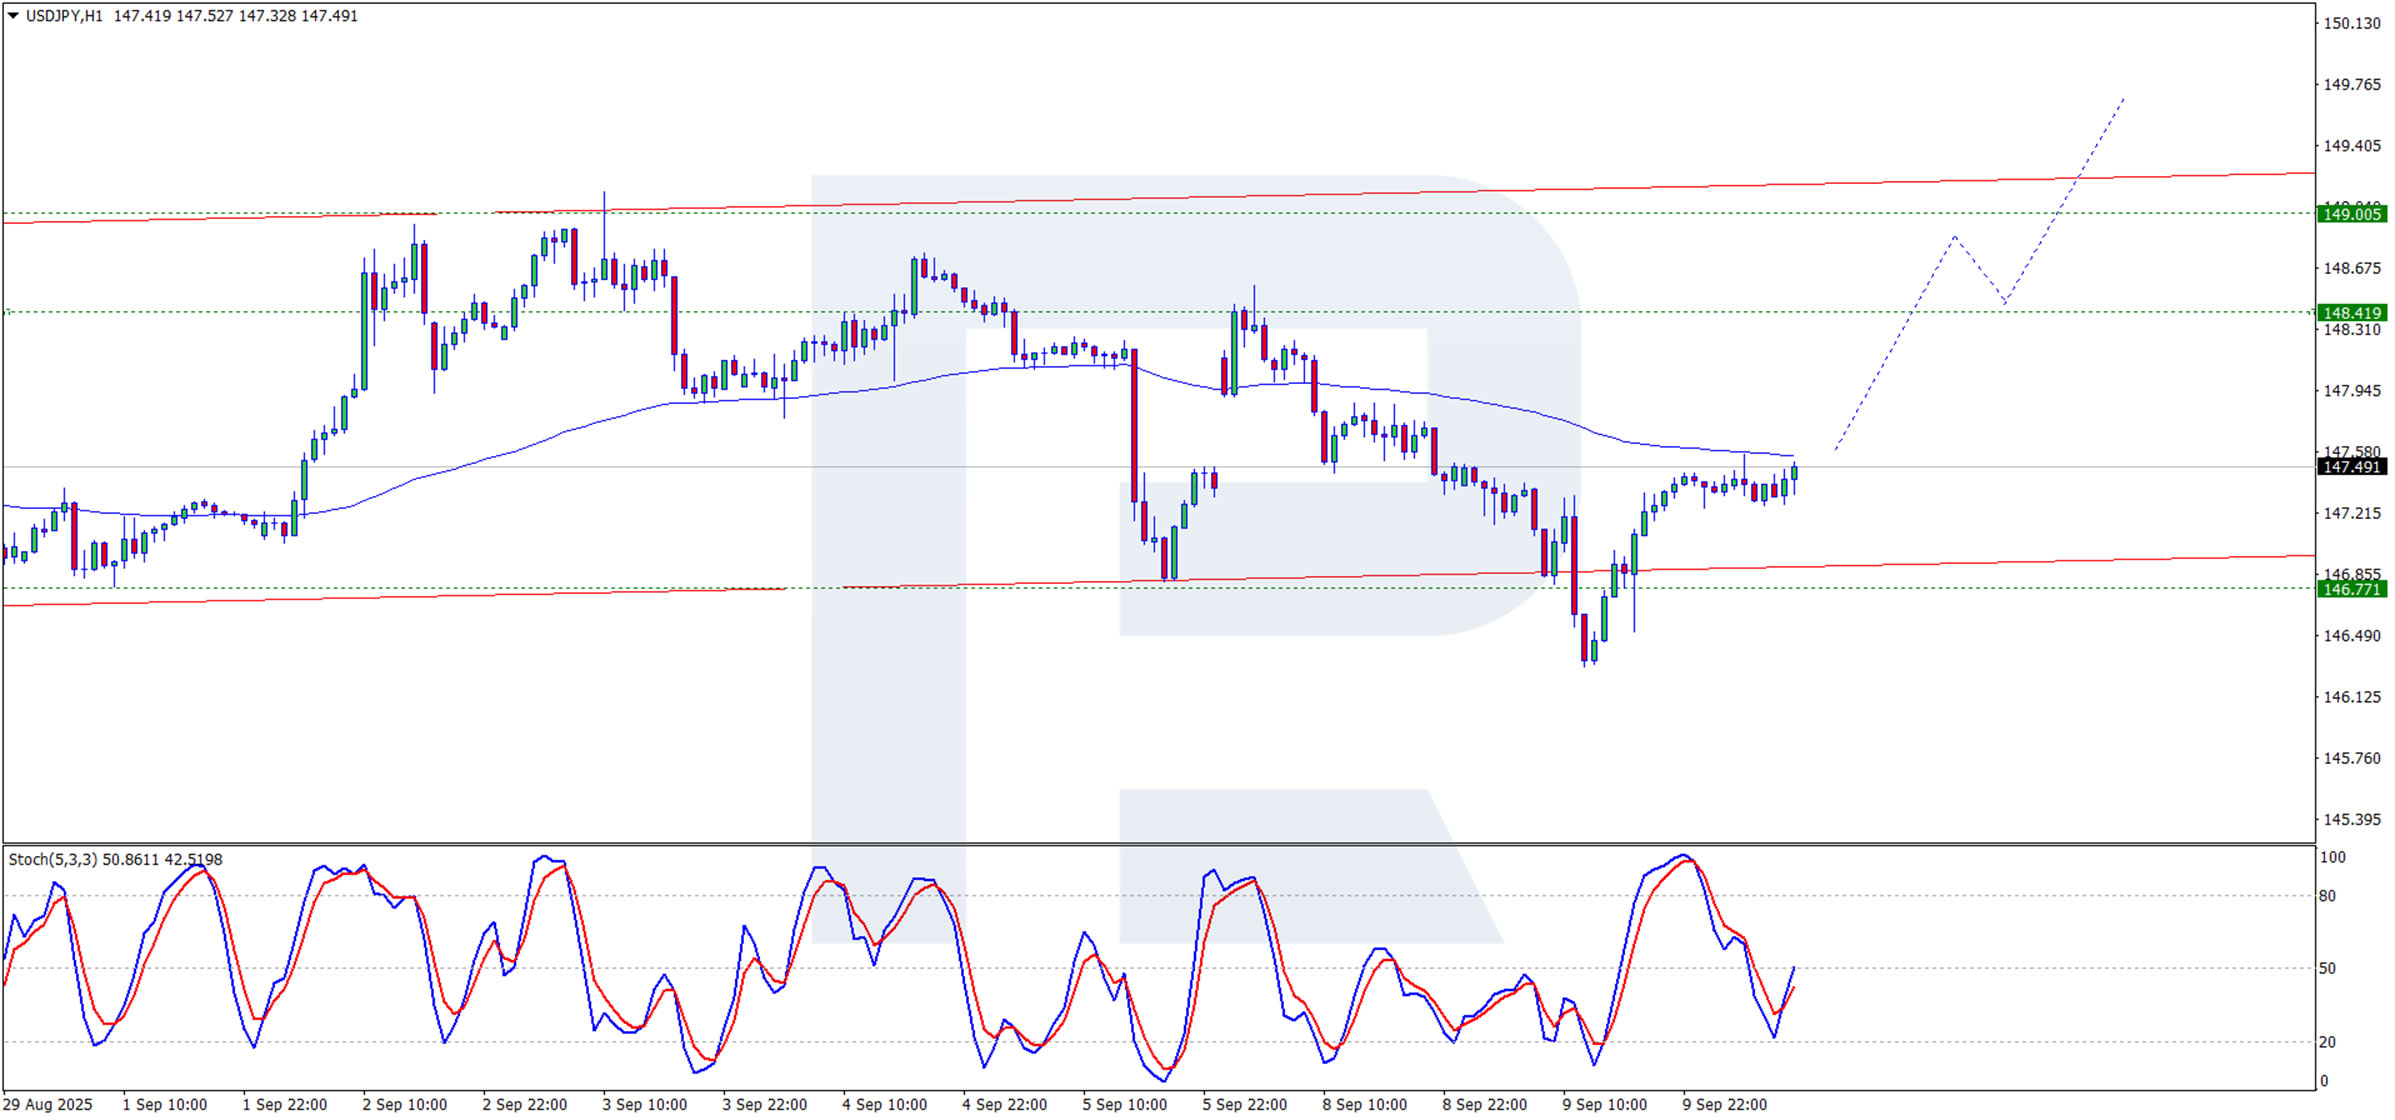
H1 Chart:
On the H1 chart, the pair is testing the 147.50 JPY resistance level. A break above this level could open the way for further gains towards 148.40 JPY. The Stochastic oscillator aligns with this view, as its signal lines are rising towards the 50.0 level. A clear break above 50.0 would signal strengthening upward momentum.
Conclusion
USD/JPY is taking a breather after recent volatility as traders await crucial US inflation data. Weak figures could reinforce expectations of Fed easing, potentially weakening the dollar further. Technically, the pair retains a near-term bullish bias within the ascending channel, though a corrective pullback remains possible after testing higher resistance levels.
USD/JPY Stuck in a Range, But for How Long?
- USDJ/PY maintains a tight horizontal move for the second month.
- Resistance at 148.60, support at 146.90.
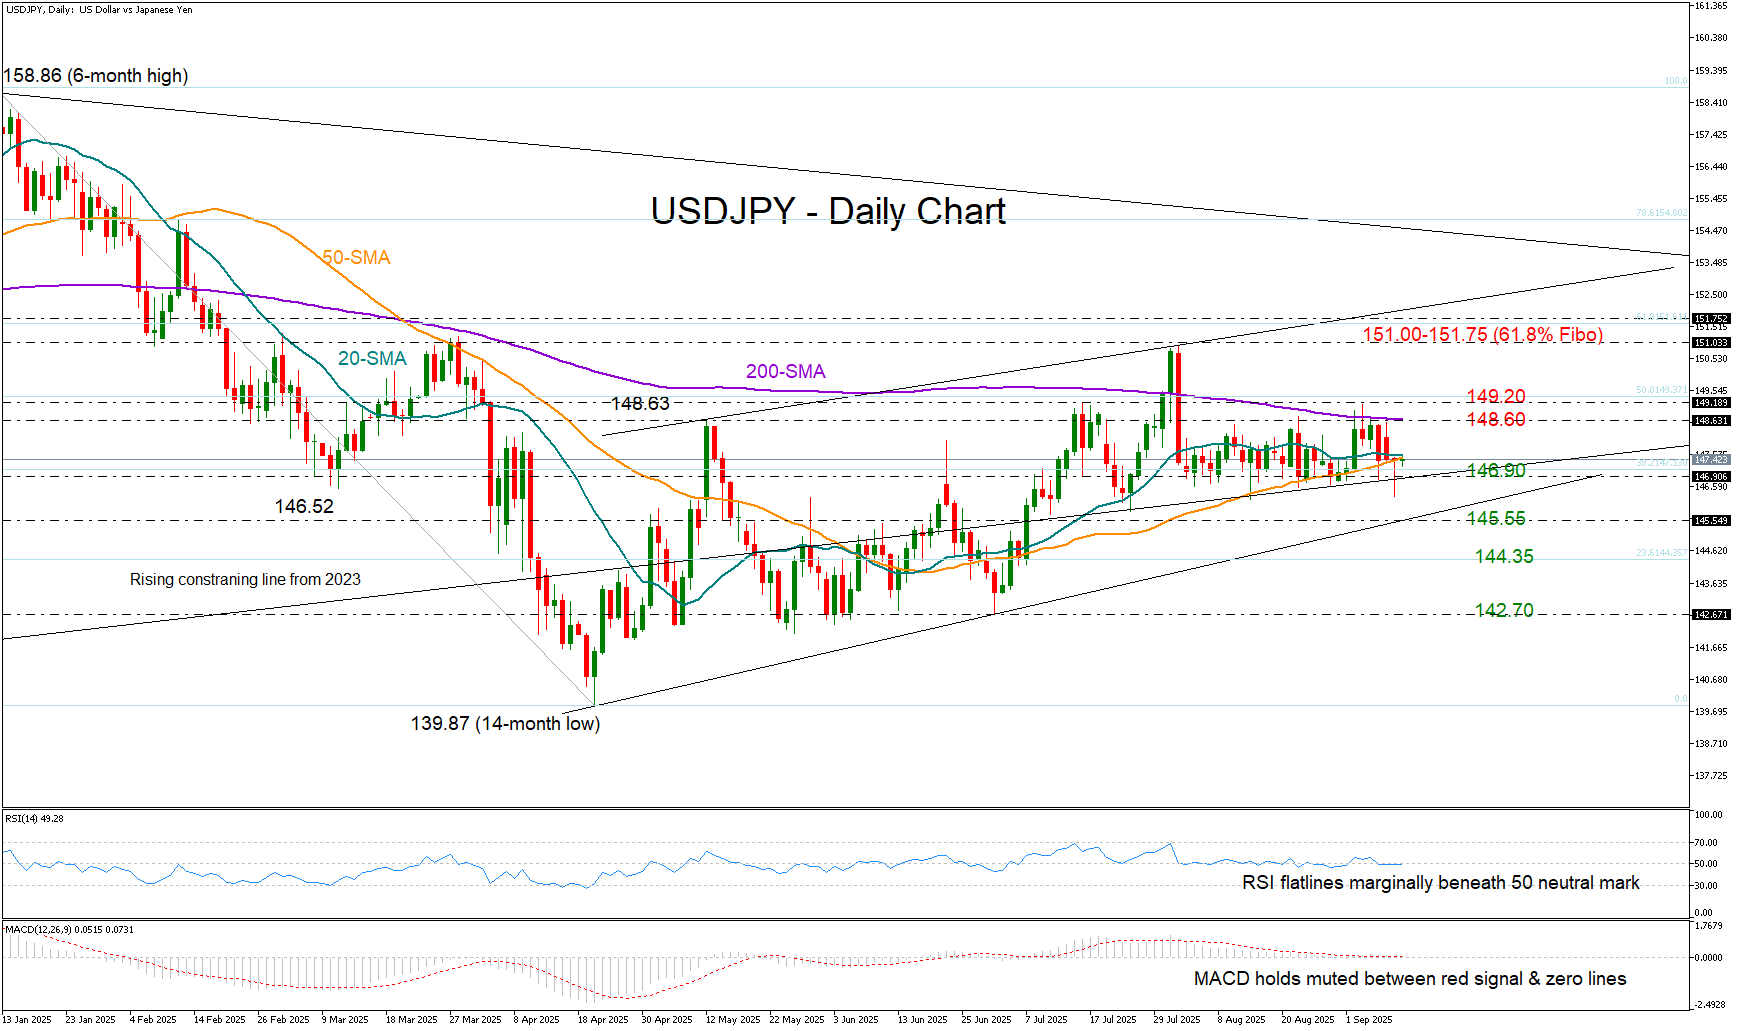
USD/JPY held stubbornly within the tight 146.90–149.00 range despite the recent NFP-driven turbulence that caused a flash drop to 146.29. However, with the sideways move now stretching into its eighth consecutive week and the clock ticking down to today’s release of the US Producer Price Index (PPI) for August, a shift in sentiment may be just around the corner.
The data may reveal whether input costs continue to squeeze producers’ margins, strengthening the case for sticky inflation as the labor market shows stronger signs of cooling. From a technical perspective, traders remain indecisive: the RSI is hovering just below its neutral 50 mark, while the MACD is muted between its zero and red signal lines. Price action is also limited near the 20- and 50-day simple moving averages (SMAs).
As a result, traders may prefer to stay on the sidelines unless a clear break occurs. A sustainable move below the 146.90 floor could open the door to the 145.55 support level. Further declines might then target 144.35, followed by the 142.70 floor.
On the flip side, buyers may wait for a decisive rebound above the 200-day SMA at 148.60 and the 149.00 zone. If that resistance gives way, the pair could advance toward the 151.00 level, which the bulls failed to secure in July. Slightly higher, the tentative resistance trendline connecting the May and July highs could cap gains near 151.75.
In short, USD/JPY remains in wait-and-see mode for the second straight month. A move above 148.60 or below 146.90 could set the next directional course.
Dollar Tests Strength of 13-Year Growth Trend
The US dollar finds itself at a crossroads during a rather dangerous season, when markets often form trends for the coming months.
The short-term outlook for the DXY is quite alarming. At the end of last week, the trade-weighted basket of developed currencies broke the upward trend that had been gradually forming since July’s lows due to weak labour market indicators and fell to 97.5. The final signal of a shift to a decline will be a renewal of July’s lows at 96.3, which in turn were the lowest since March 2022.
The reasons for this are simple: the labour market is in much worse shape than previously estimated, leading to a rapid reassessment of monetary policy prospects. However, this relatively small step could have important technical significance.
Technically, this opens up the potential for the dollar to fall to its 2021 lows of 90, or to the 88 area, where the 161.8% Fibonacci target from the first half of the year’s decline lies.
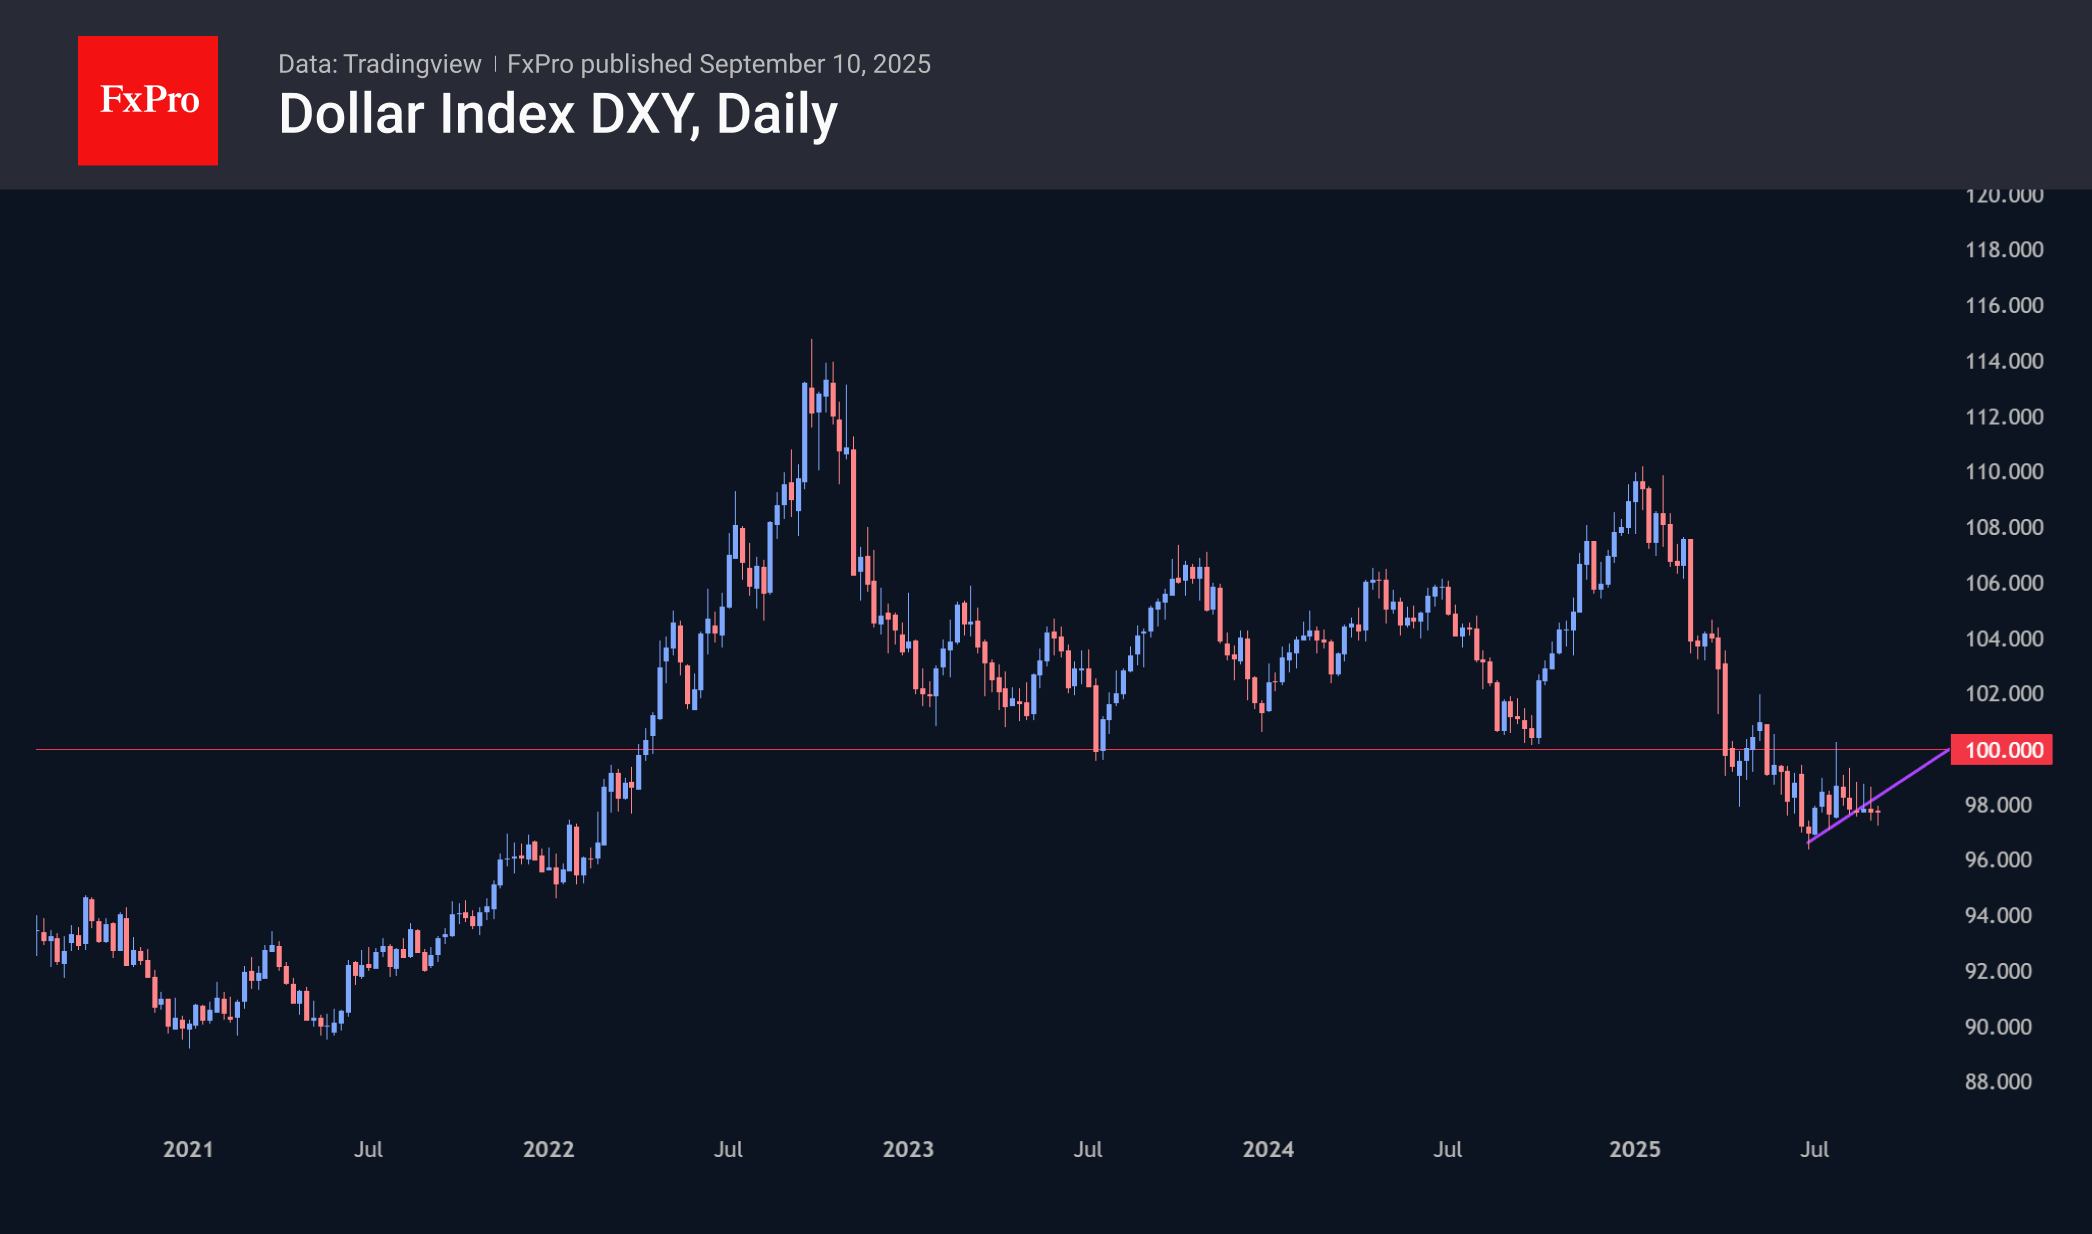
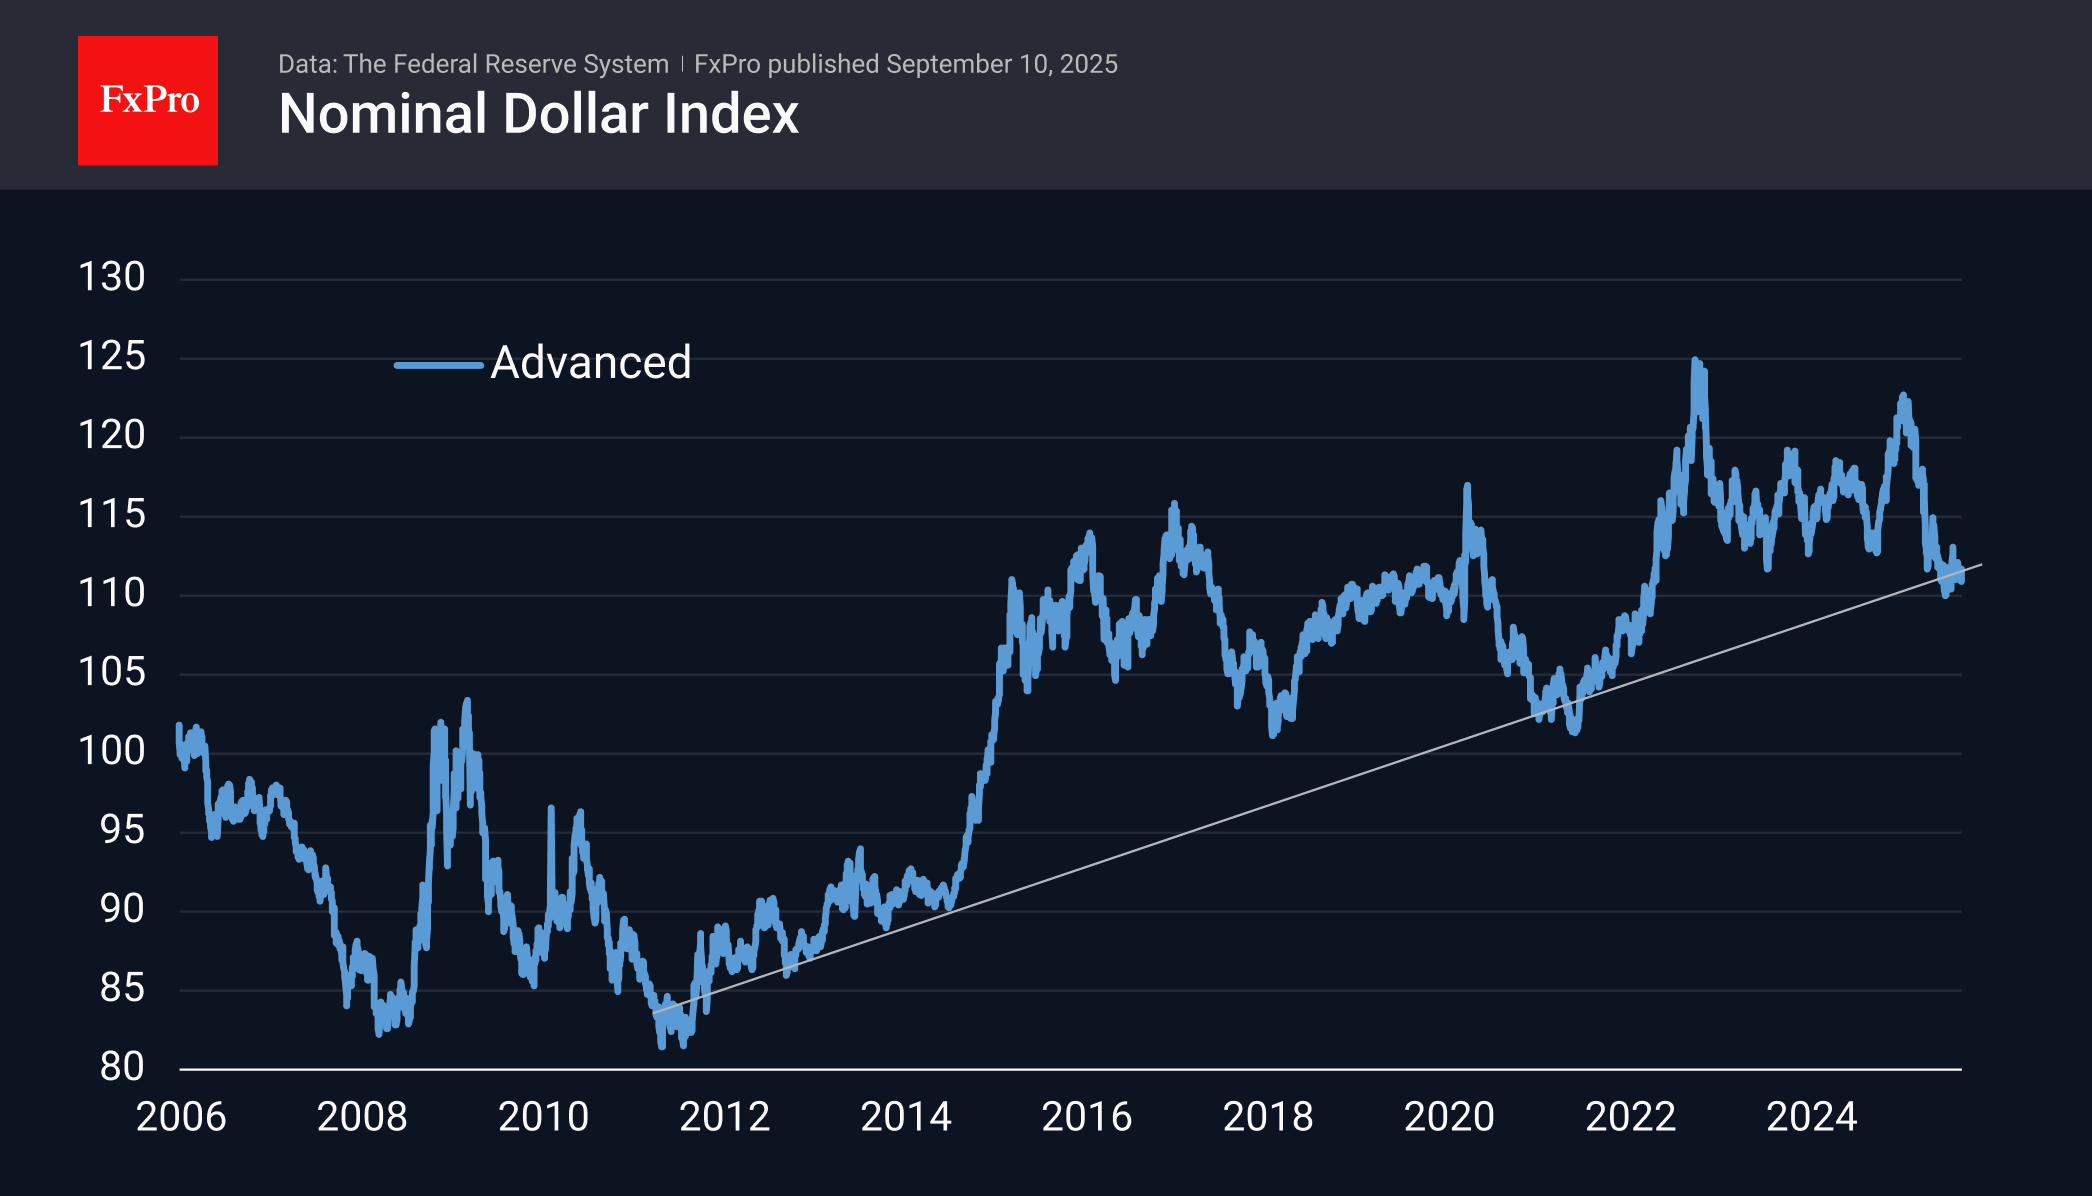
This could mark a significant decline for the dollar. The Fed’s dollar index against a trade-weighted basket of developed countries is moving as if in stages, within wide ranges. Over the past three years, this has been a range of 110-120. From 2015 to 2022, it has mostly remained within 100-110, starting in 2014 from the 90 range. A further dip of a couple of per cent from current levels would break the upward trend that began back in 2012.
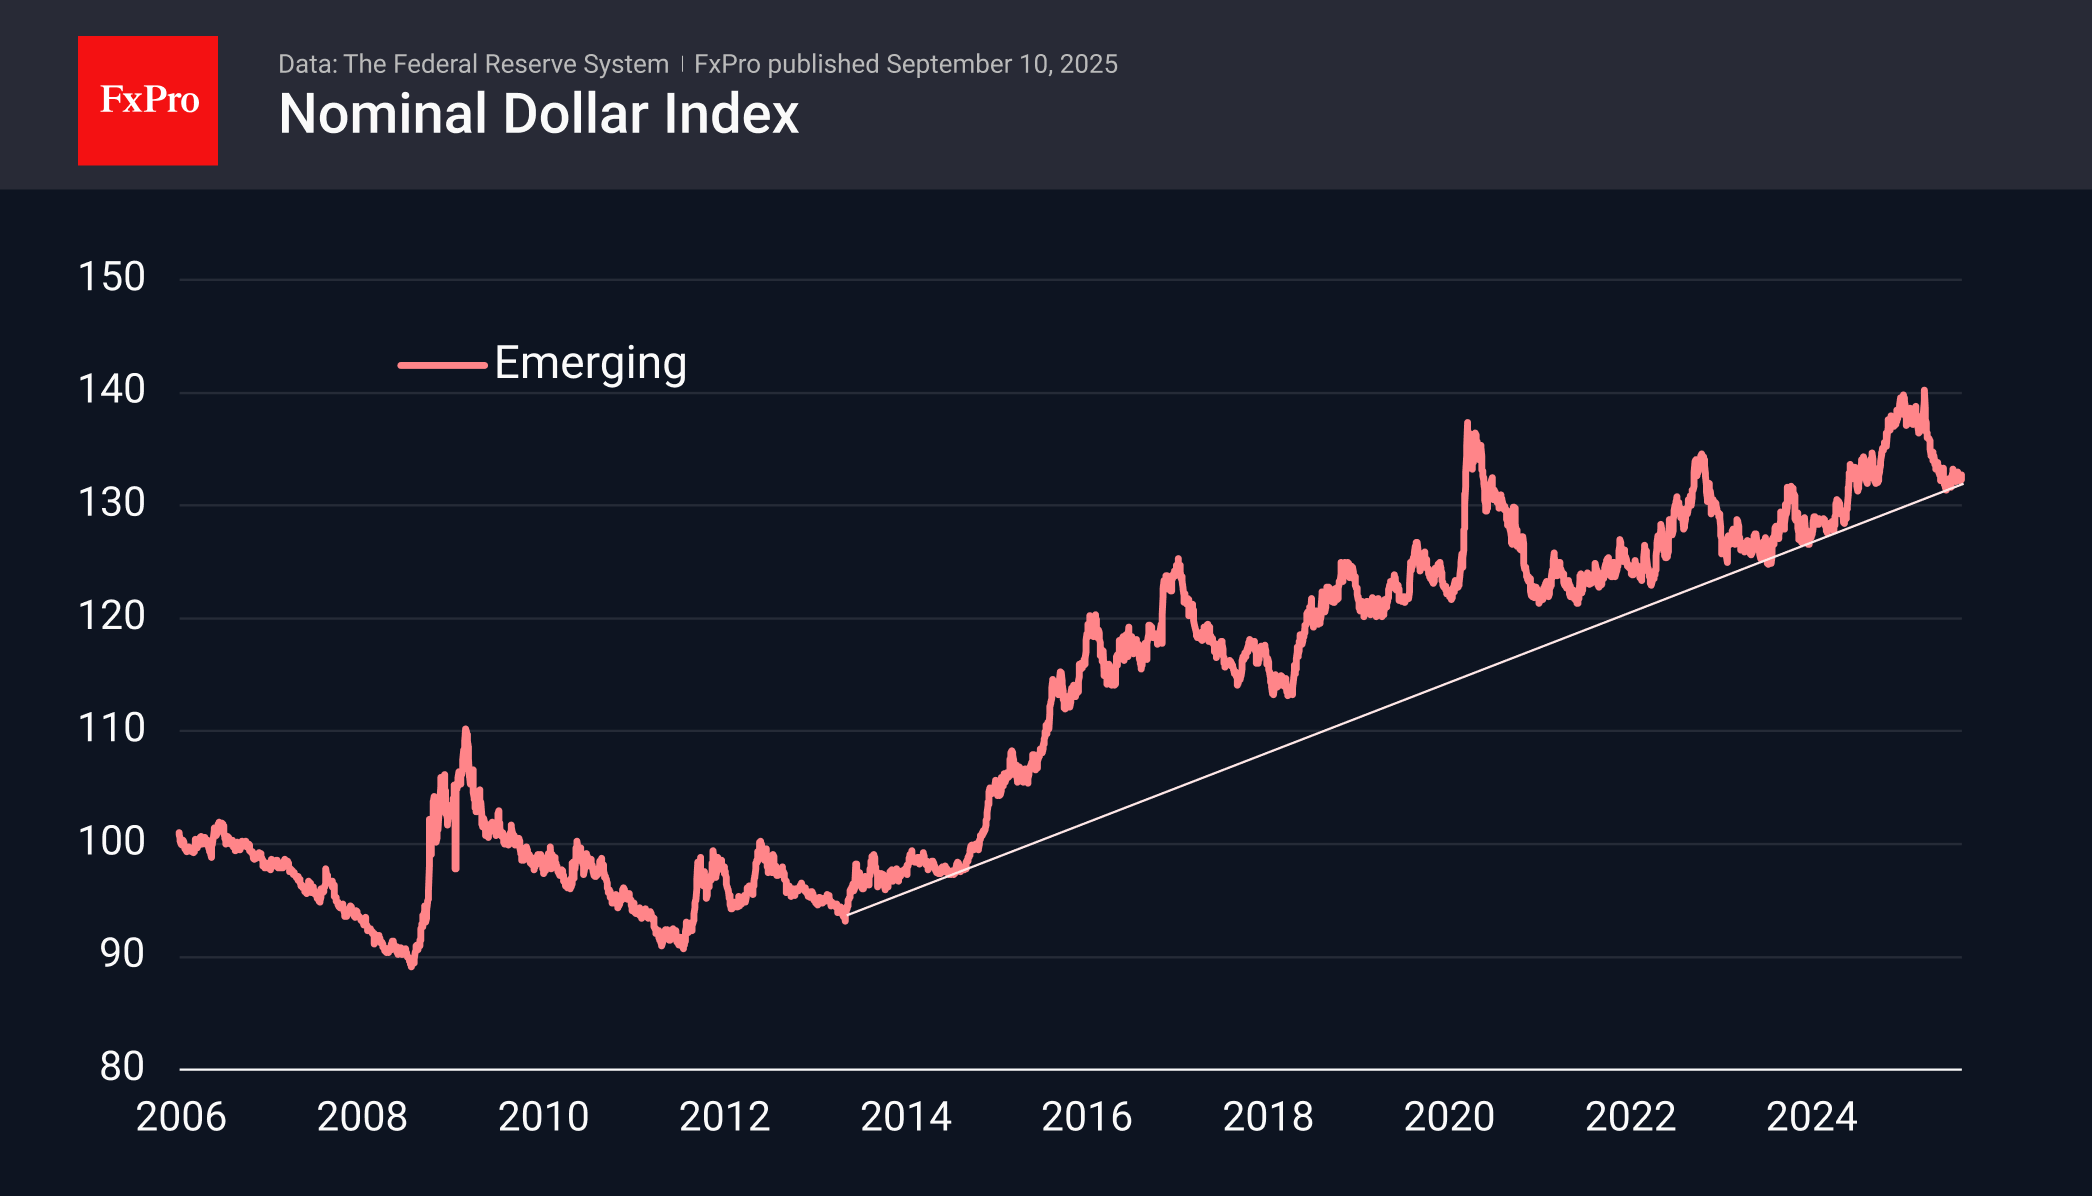
The situation with the dollar’s dynamics against a basket of emerging market currencies is even more dramatic. Historically, they have lost against the American currency. The latest growth trend began in 2013, but the last two years have seen frequent tests of the support line. Since July, the index has been trading near this line again. A fall below this level would mean a transition to a multi-year downward cycle.
This is doubly true given that it is quite typical for markets to form new trends in August-September, when the financial year ends.
Strictly speaking, it would be premature to bury the dollar until it falls below support levels. From its current position, it could be an ideal entry point with long-term growth prospects.
However, dollar bulls will have to change a lot in the prevailing market narrative that the Fed will be more active in cutting rates. The further we go, the more this will be the case, given the growing share of Trump’s new administration appointees in the Fed, including the change of the central bank’s head in May.
This is by no means a populist move. Given the accumulated national debt and the impossibility of fiscal consolidation, the US government does not have many cards to play. What remains is a scenario of reducing the debt burden and correcting the trade balance through weakening the national currency and tolerating higher inflation — a path that the UK found itself on in 1938.
Gold Rockets to New High While WTI Crude Oil Struggles
Gold price rallied to a new all-time high above $3,670. Crude oil is showing bearish signs and might decline below $62.25.
Important Takeaways for Gold and WTI Crude Oil Price Analysis Today
- Gold price started a major increase from $3,500 against the US Dollar.
- A key bullish trend line is forming with support at $3,635 on the hourly chart of gold at FXOpen.
- Crude oil price failed to clear the $65.60 region and started a fresh decline.
- There is a short-term bullish trend line forming with support at $62.25 on the hourly chart of XTI/USD at FXOpen.
Gold Price Technical Analysis
On the hourly chart of Gold at FXOpen, the price formed a base above $3,500. The price remained in a bullish zone and started a strong increase above $3,550.
There was a decent move above the 50-hour simple moving average and $3,620. The bulls pushed the price above the $3,640 and $3,650 resistance levels. Finally, the price climbed to a new all-time high at $3,674 before there was a pullback.
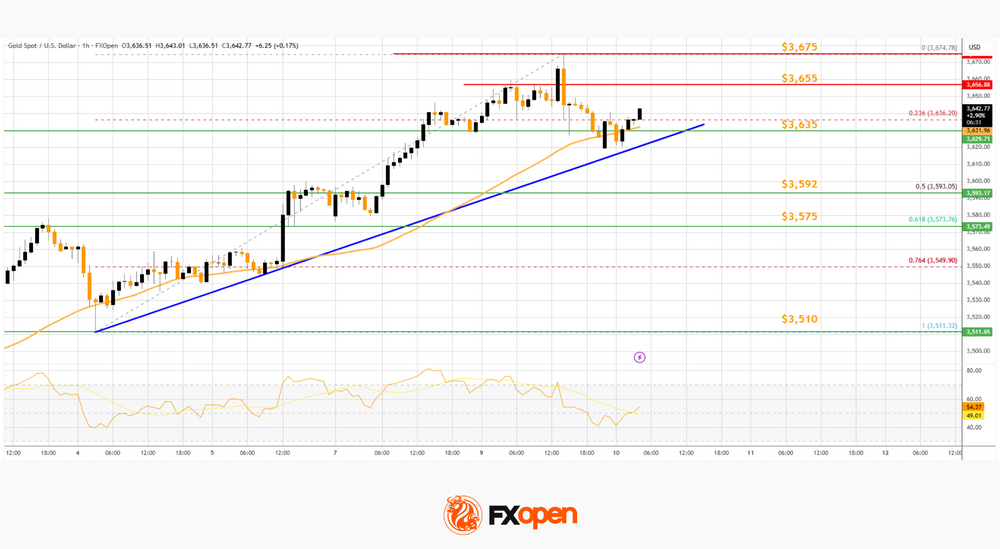
The price dipped below the 23.6% Fib retracement level of the upward move from the $3,511 swing low to the $3,674 high, and the RSI declined below 50. Initial support on the downside is near $3,635 and the 50-hour simple moving average.
There is also a key bullish trend line forming with support at $3,635. The first major support is near the 50% Fib retracement at $3,592. If there is a downside break below $3,592, the price might decline further. In the stated case, the price might drop toward $3,575. Any more losses might push the price toward $3,510.
Immediate resistance is near $3,655. The next major hurdle for the bulls is $3,675. An upside break above $3,675 could send Gold price toward $3,688. Any more gains may perhaps set the pace for an increase toward $3,700.
WTI Crude Oil Price Technical Analysis
On the hourly chart of WTI Crude Oil at FXOpen, the price struggled to clear $65.60 against the US Dollar. The price started a fresh decline below $64.60.
The bears gained strength and pushed the price below $62.00. Finally, the price tested $61.20 and recently started a recovery wave. There was a move above $62.00, the 50-hour simple moving average, and the 23.6% Fib retracement level of the downward move from the $65.63 swing high to the $61.23 low.
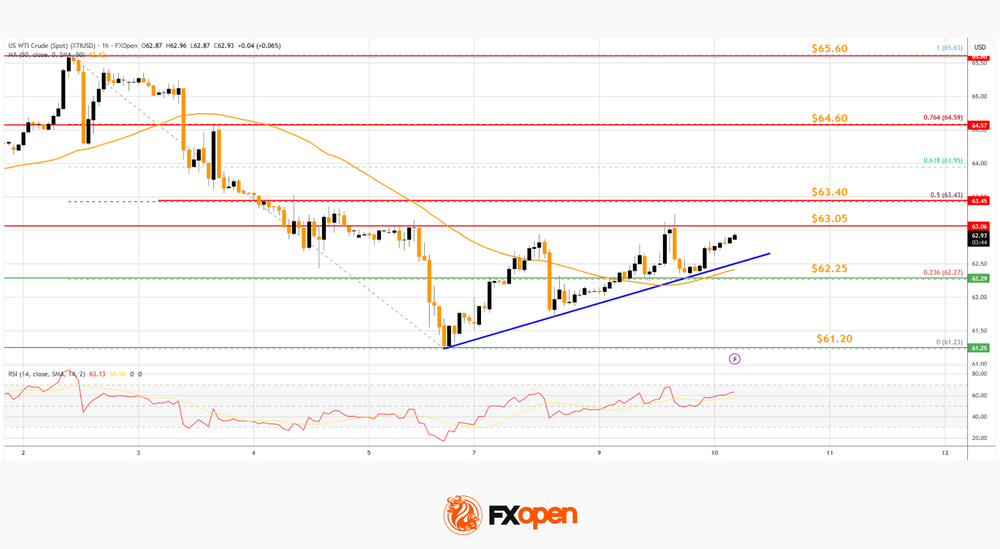
The bears are now active near $63.00. If there is a fresh increase, the price could face a barrier near $63.05. The first major resistance is near the 50% Fib retracement at $63.40. The next stop for the bulls could be near $64.60. Any more gains might send the price toward $65.60.
Conversely, the price might start another decline and test a short-term bullish trend line with support at $62.25 and the 50-hour simple moving average.
The next major support on the WTI crude oil chart is $61.20. If there is a downside break, the price might decline toward $60.50. Any more losses may perhaps open the doors for a move toward $60.00.
Start trading commodity CFDs with tight spreads. Open your trading account now or learn more about trading commodity CFDs with FXOpen.
This article represents the opinion of the Companies operating under the FXOpen brand only. It is not to be construed as an offer, solicitation, or recommendation with respect to products and services provided by the Companies operating under the FXOpen brand, nor is it to be considered financial advice.
Market Awaits ECB Signals: The Euro Loses Some Ground
European currency is consolidating and retreating slightly from local highs ahead of the ECB meeting. Friday’s weak US labour market data gave the euro a boost, but at the start of the week the market remained undecided on how to interpret the signals: after an attempt to strengthen, a correction followed, and traders returned to a wait-and-see approach. In the coming sessions, attention will be focused on the ECB’s decisions, updated macroeconomic forecasts, and comments from the ECB President, as well as on US releases that could influence expectations for the Fed (mortgage data and producer price indicators). In this environment of uncertainty, trading remains range-bound: a break above Friday’s highs in the euro would require confirmation from ECB rhetoric and weak US data; in the absence of such signals, the base case remains further consolidation with the risk of a deeper correction towards support levels.
EUR/USD
The pair has pulled back from recent highs and is holding near short-term support, reflecting caution ahead of the European regulator’s rhetoric. Technical analysis of EUR/USD suggests a possible decline towards 1.1600–1.1630, as a bearish engulfing pattern has formed on the daily timeframe. If the price returns above 1.1740, a retest of Friday’s highs near 1.1800 is possible.
Events that could influence EUR/USD movement:
- Today at 15:00 (GMT+3): Speech by Bundesbank Vice President Buch
- Today at 15:30 (GMT+3): US Producer Price Index (PPI)
- Today at 20:00 (GMT+3): Atlanta Fed GDPNow indicator
EUR/JPY
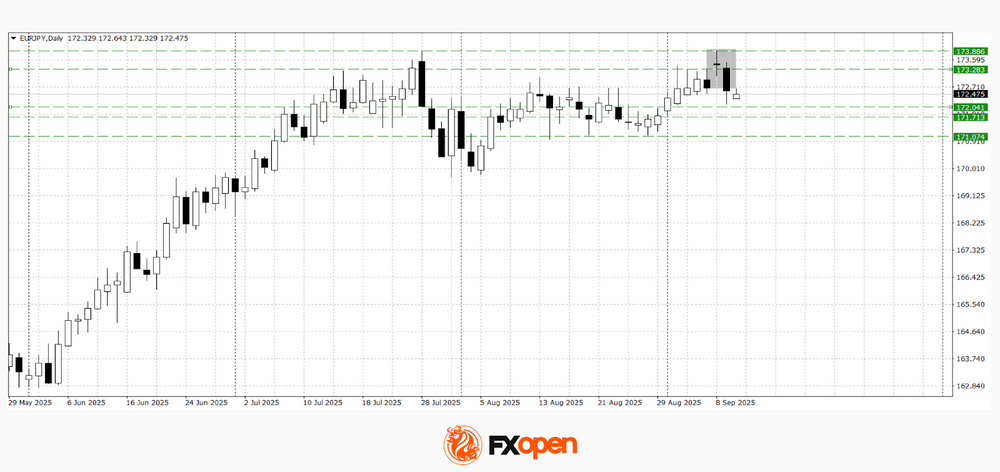
On Friday, EUR/JPY buyers managed to update July high near 174.00. However, they failed to consolidate above 173.90 and continue the upward momentum. A sharp rebound from the yearly highs allowed euro sellers to seize the initiative and form a bearish doji pattern, which has already been confirmed. If the downward move continues, the EUR/JPY pair might test the 171.70–172.00 area. A bearish scenario might be cancelled if the price firmly consolidates above 173.30.
Events that could influence EUR/JPY movement:
- Tomorrow at 02:50 (GMT+3): Japan Large Manufacturers’ BSI Business Conditions Index
- Tomorrow at 15:15 (GMT+3): ECB interest rate decision
- Tomorrow at 15:45 (GMT+3): ECB press conference
Trade over 50 forex markets 24 hours a day with FXOpen. Take advantage of low commissions, deep liquidity, and spreads from 0.0 pips. Open your FXOpen account now or learn more about trading forex with FXOpen.
This article represents the opinion of the Companies operating under the FXOpen brand only. It is not to be construed as an offer, solicitation, or recommendation with respect to products and services provided by the Companies operating under the FXOpen brand, nor is it to be considered financial advice.
GBP/JPY Daily Outlook
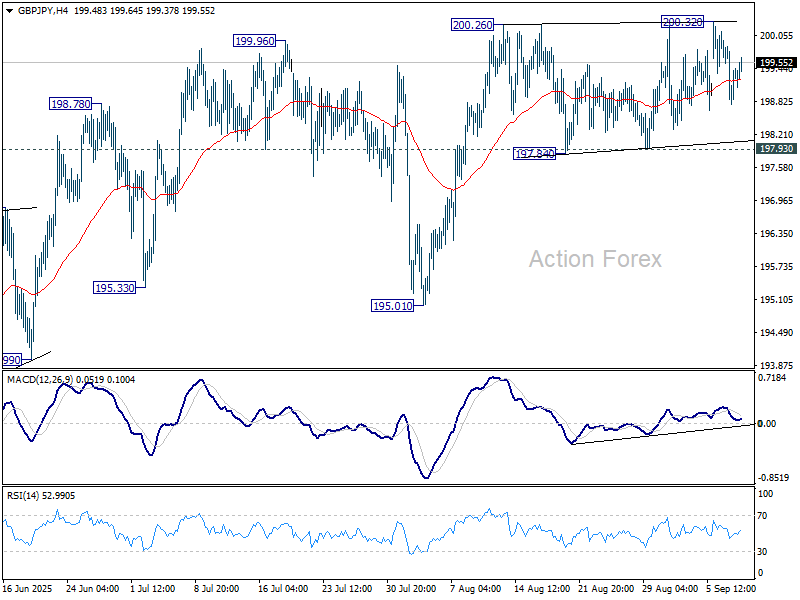
Daily Pivots: (S1) 198.79; (P) 199.40; (R1) 200.00; More...
Range trading continues in GBP/JPY and intraday bias stays neutral. Further rise is expected as long as 197.93 support holds. Firm break of 200.26 resistance will resume the rally from 184.35 to 100% projection of 180.00 to 199.79 from 184.35 at 204.14. On the downside, however, break of 197.93 support will turn bias to the downside for 195.01 support next.
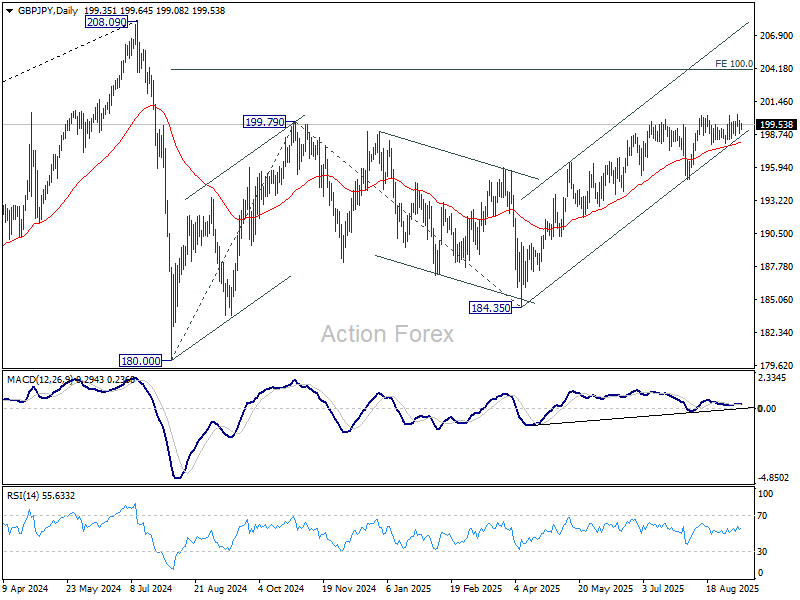
In the bigger picture, price actions from 208.09 (2024 high) are seen as a correction to rally from 123.94 (2020 low). The pattern might still extend with another falling leg. But in that case, strong support should be seen from 38.2% retracement of 123.94 to 208.09 at 175.94 to contain downside. Meanwhile, decisive break of 208.09 will confirm long term up trend resumption.
EUR/JPY Daily Outlook
Daily Pivots: (S1) 171.98; (P) 172.76; (R1) 173.40; More...
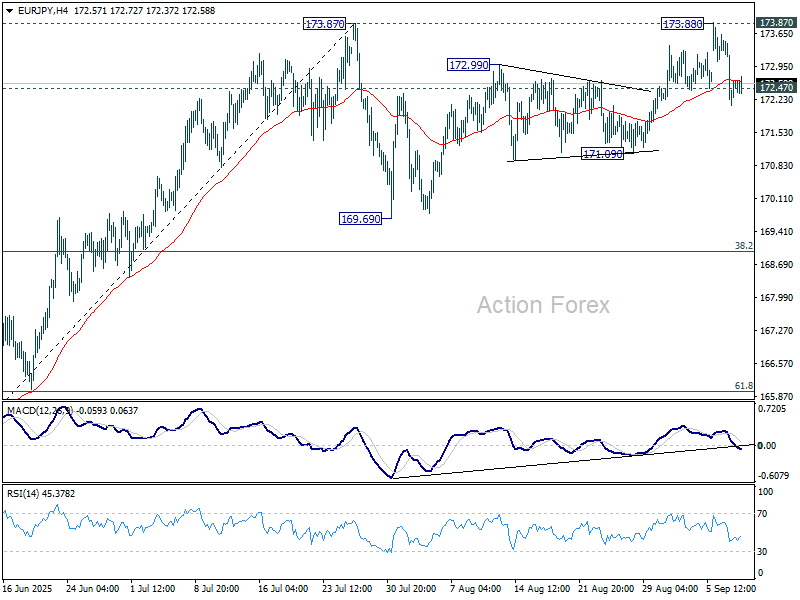
Break of 172.47 support suggests rejection by 173.87 resistance. Intraday bias is back on the downside in EUR/JPY. Corrective pattern from 173.87 is possibly extending with the third leg. Deeper fall would be seen to 171.09 support next. Break there will target 169.69.
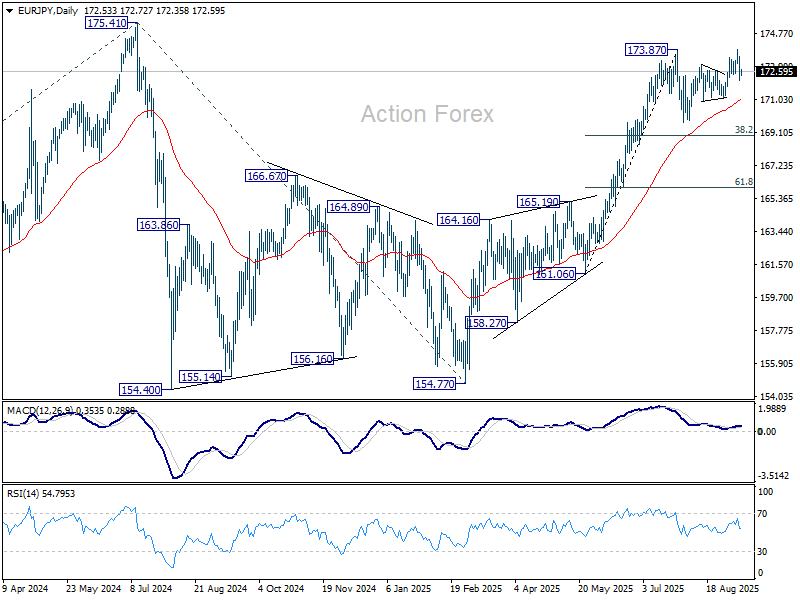
In the bigger picture, current rally from 154.77 is still tentatively seen as resuming the larger up trend. Firm break of 175.41 (2024 high) will confirm and target 61.8% projection of 124.37 to 175.41 from 154.77 at 186.31. However, sustained break of 38.2% retracement of 161.06 to 173.87 at 168.97 will delay this bullish case, and probably extend the correction from 175.41 with another fall.
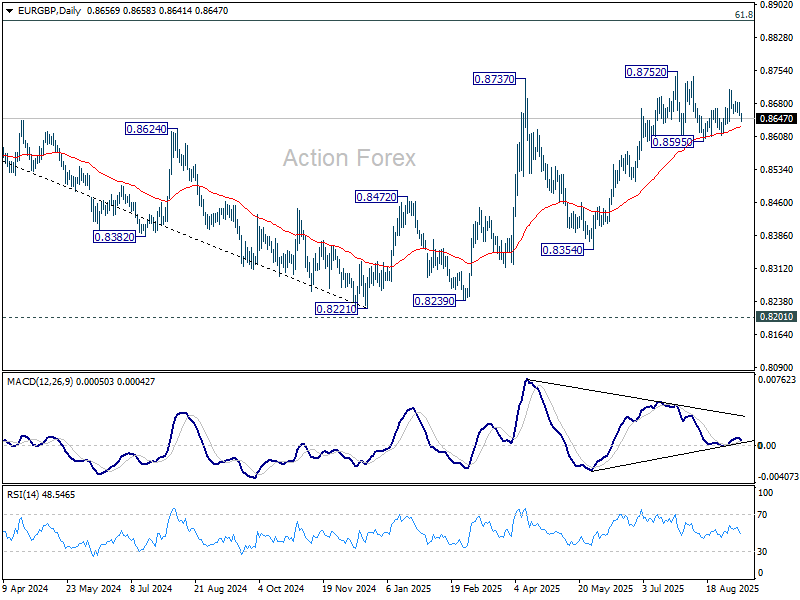
EUR/GBP Daily Outlook
Daily Pivots: (S1) 0.8646; (P) 0.8666; (R1) 0.8676; More...
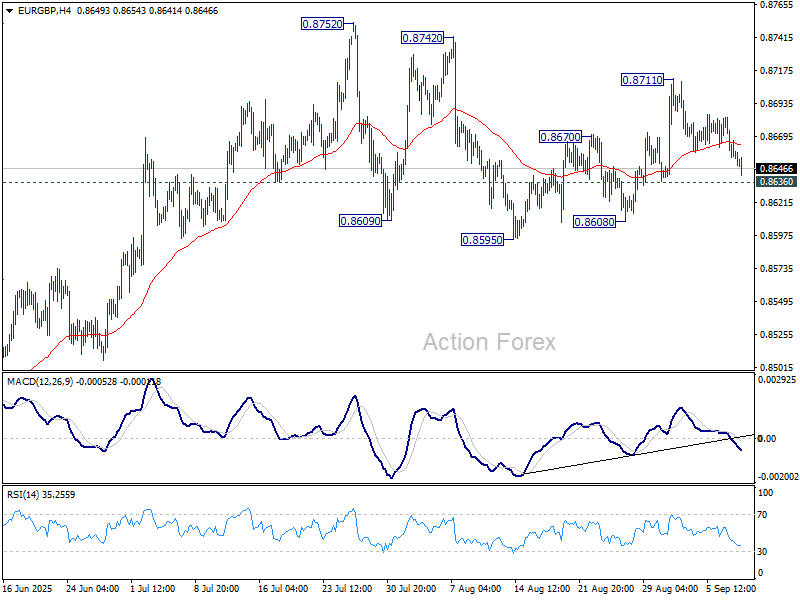
Intraday bias in EUR/GBP remains neutral and further rise is mildly in favor with 0.8636 minor support intact. On the upside above 0.8711 will bring retest of 0.8752 high. However, break of 0.8636 will extend the pattern from 0.88752 with another falling leg, and target 0.8959 support.
In the bigger picture, the structure from 0.8221 medium term bottom are not impulsive enough to suggest that it's reversing the down trend from 0.9267 (2022 high). But even if it's a correction, further rise could still be seen to 61.8% retracement of 0.9267 to 0.8221 at 0.8867. Nevertheless, sustained trading below 55 W EMA (now at 0.8519) will argue that the pattern has completed and bring retest of 0.8221 low.