
Sample Category Title
EUR/AUD Daily Outlook
Daily Pivots: (S1) 1.7742; (P) 1.7802; (R1) 1.7844; More...
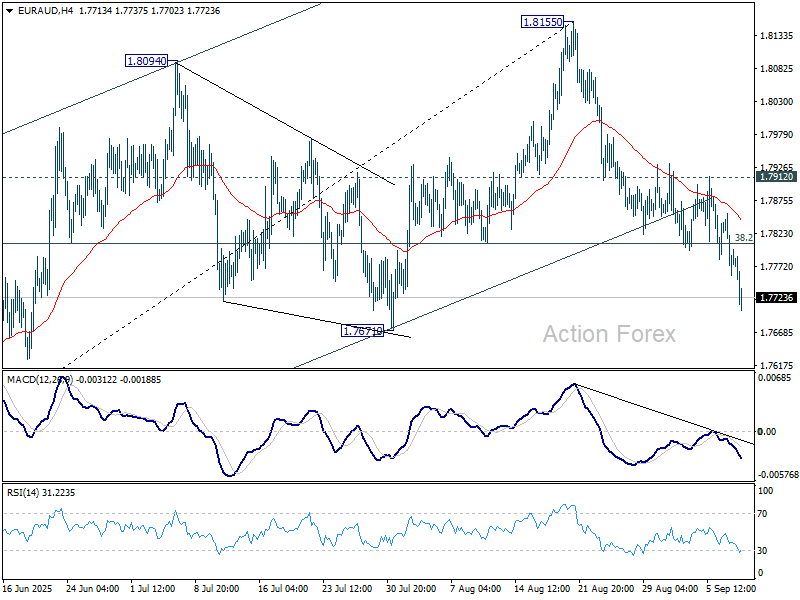
EUR/AUD's fall from 1.8155 continues today and intraday bias stays on the downside. Current development suggest that rise from 1.7245 has completed at 1.8511. Corrective pattern from 1.8554 should then be in its third leg. Further decline should be seen to 61.8% retracement of 1.7245 to 1.8155 at 1.7593. Break will target 1.7245 support. For now, risk will stay on the downside as long as 1.7912 resistance holds, in case of recovery.
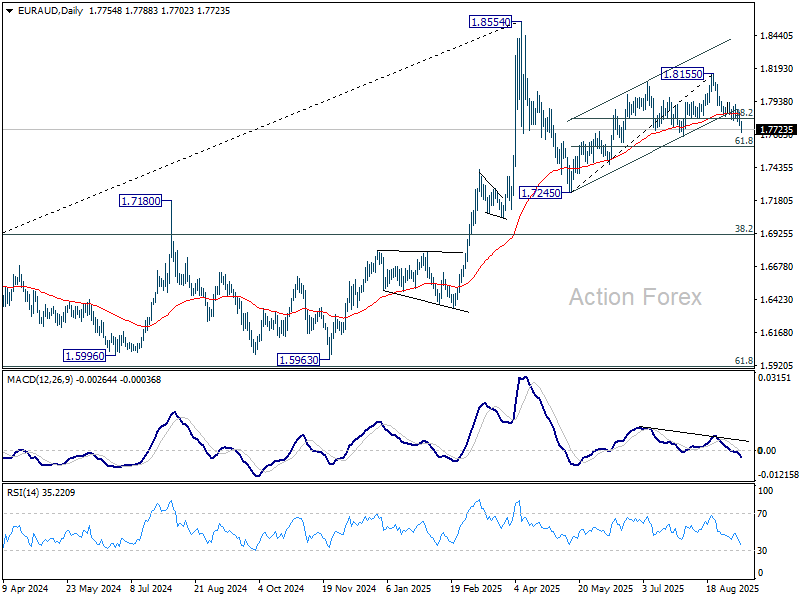
In the bigger picture, price actions from 1.8554 medium term top are seen as a corrective pattern. Such pattern could extend further with another falling leg. But even in that case, downside should be contained by 38.2% retracement of 1.4281 (2022 low) to 1.8554 at 1.6922 to bring rebound. Uptrend from 1.4281 is expected to resume at a later stage.
EUR/CHF Daily Outlook
Daily Pivots: (S1) 0.9321; (P) 0.9331; (R1) 0.9349; More....
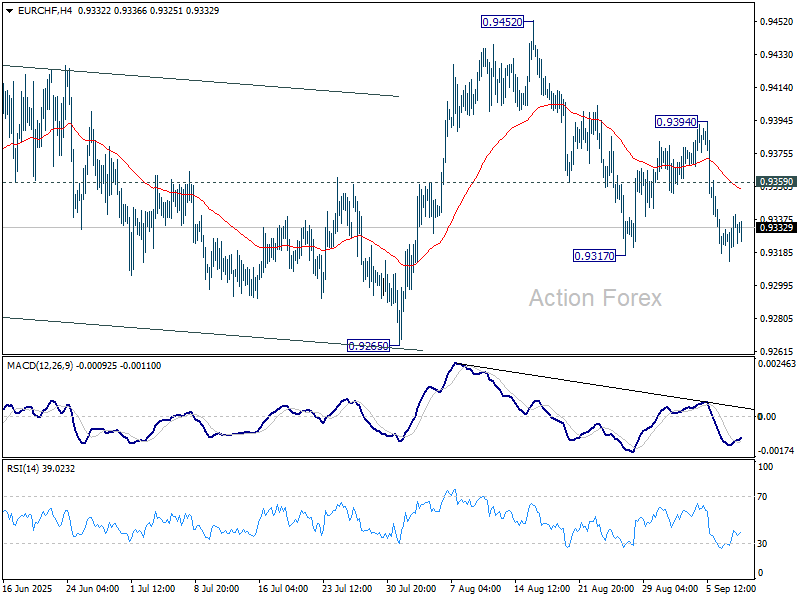
Intraday bias in EUR/CHF stays mildly on the downside for the moment. Firm break of 0.9317 would resume the decline from 0.9452. That would also solidify the bearish case that corrective pattern from 0.9218 has completed with three waves up to 0.9452 already. Deeper fall should then be seen to 0.9265 support, and then 0.9204 low. On the upside, above 0.9359 minor resistance will turn intraday bias neutral first. But risk will stay on the downside as long as 0.9394 resistance holds, in case of recovery.
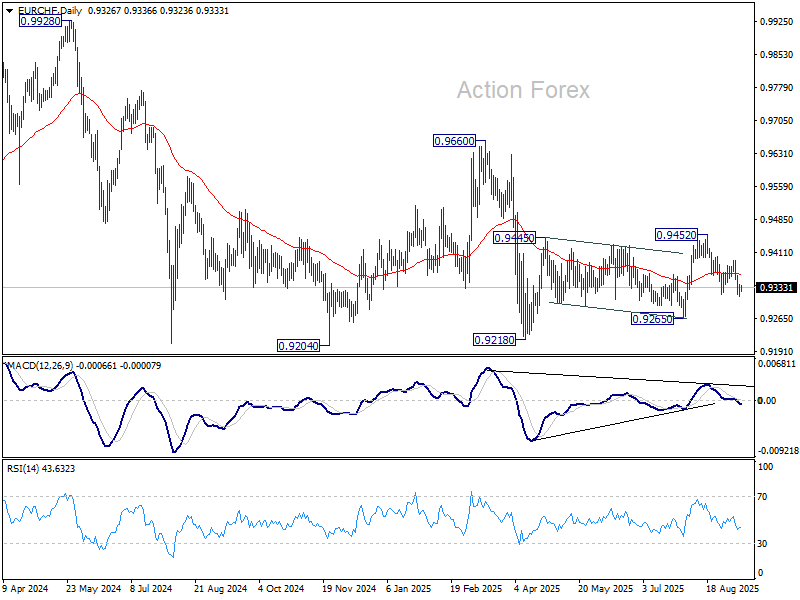
In the bigger picture, the down trend from 0.9204 (2018 high) might still be in progress considering that EUR/CHF is staying well inside the long term falling channel. However, with bullish convergence condition in W MACD, downside potential should be limited in case of another fall. Instead, firm break of 0.9660 resistance will be an important sign of medium term bullish trend reversal.
EUR/USD Daily Outlook
Daily Pivots: (S1) 1.1681; (P) 1.1731; (R1) 1.1757; More...
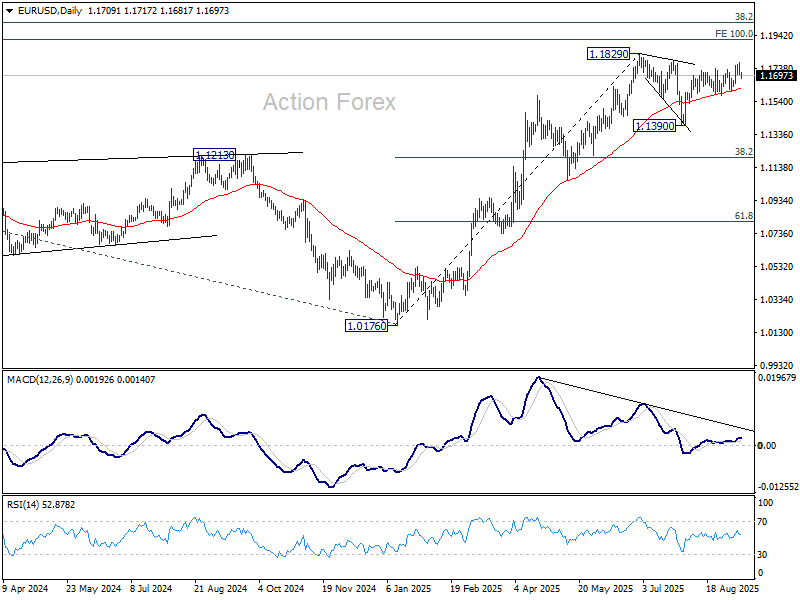
Intraday bias in EUR/USD is turned neutral first with current retreat. Some consolidations could be seen but further rise is expected with 1.1607 support intact. Above 1.1779 will bring retest of 1.1829 high. Firm break there will resume larger up trend to 1.1916 projection level.
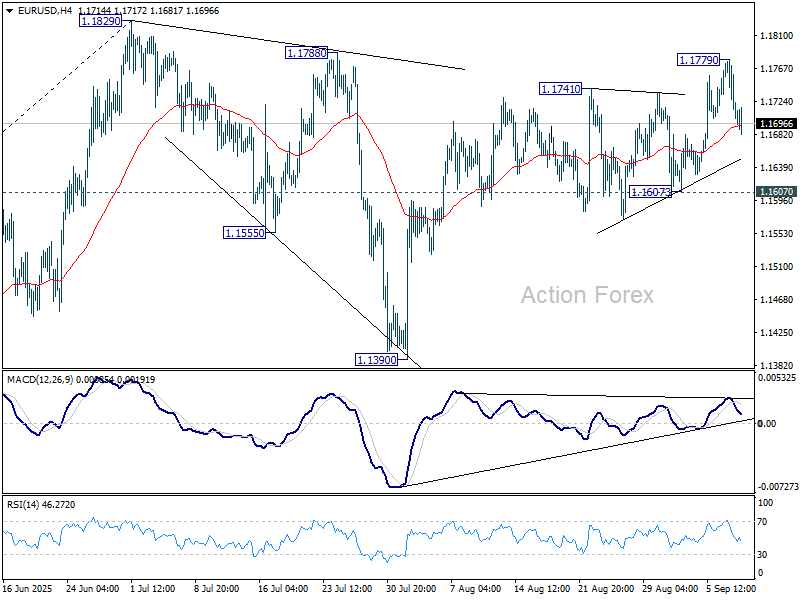
In the bigger picture, rise from 0.9534 (2022 low) long term bottom could be correcting the multi-decade downtrend or the start of a long term up trend. In either case, further rise should be seen to 100% projection of 0.9534 to 1.1274 from 1.0176 at 1.1916. This will remain the favored case as long as 1.1604 support holds.
USD/JPY Daily Outlook
Daily Pivots: (S1) 146.62; (P) 147.10; (R1) 147.90; More...
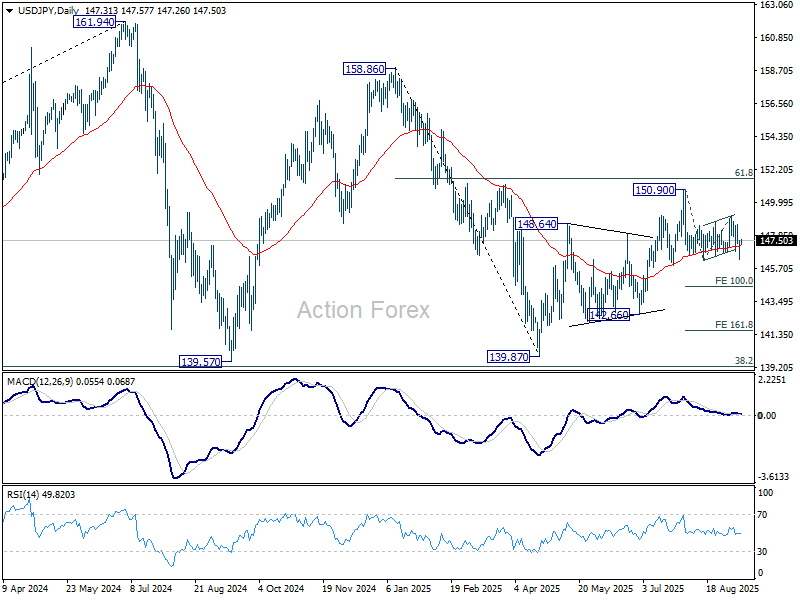
USD/JPY recovered ahead of 146.20 support and intraday bias is turned neutral first. Risk will stay on the upside as long as 149.12 resistance holds. Firm break of 146.20 will target 100% projection of 150.90 to 146.20 from 149.12 at 144.42. Also, sustained trading below 55 D EMA (now at 147.15) will argue that whole rebound from 139.87 has completed with three waves up to 150.90.
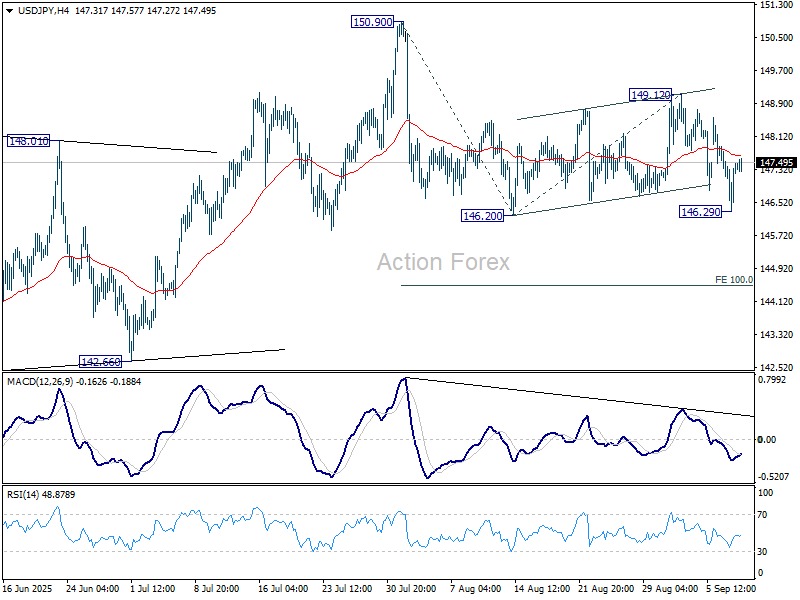
In the bigger picture, price actions from 161.94 (2024 high) are seen as a corrective pattern to rise from 102.58 (2021 low). Decisive break of 61.8% retracement of 158.86 to 139.87 at 151.22 will argue that it has already completed with three waves at 139.87. Larger up trend might then be ready to resume through 161.94 high. In case the corrective pattern extends with another fall, strong support is expected from 38.2% retracement of 102.58 to 161.94 at 139.26 to bring rebound.
GBP/USD Daily Outlook
Daily Pivots: (S1) 1.3500; (P) 1.3545; (R1) 1.3573; More...
Intraday bias in GBP/USD is turned neutral first with current retreat. Some consolidations would be seen but further rise is expected with 1.3332 support intact. Firm break of 1.3594 will resume the rally from 1.3140 and target a retest on 1.3787 high.
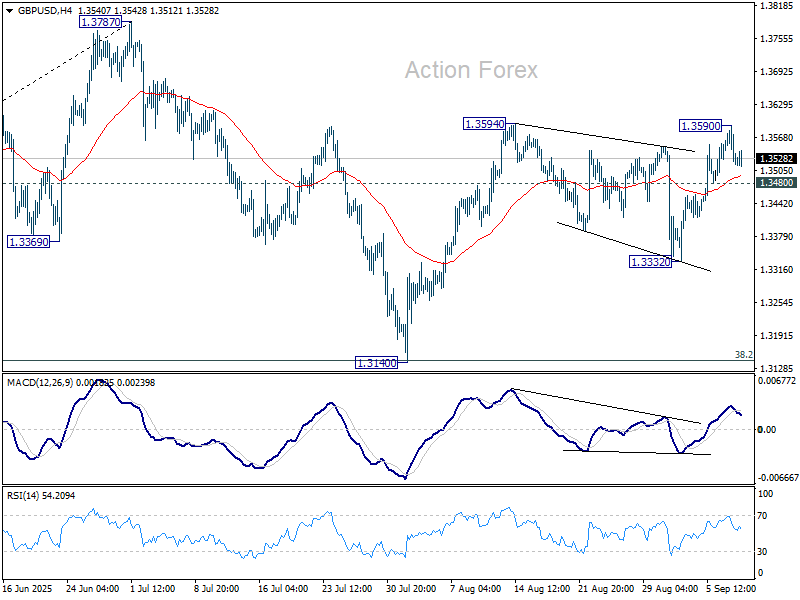
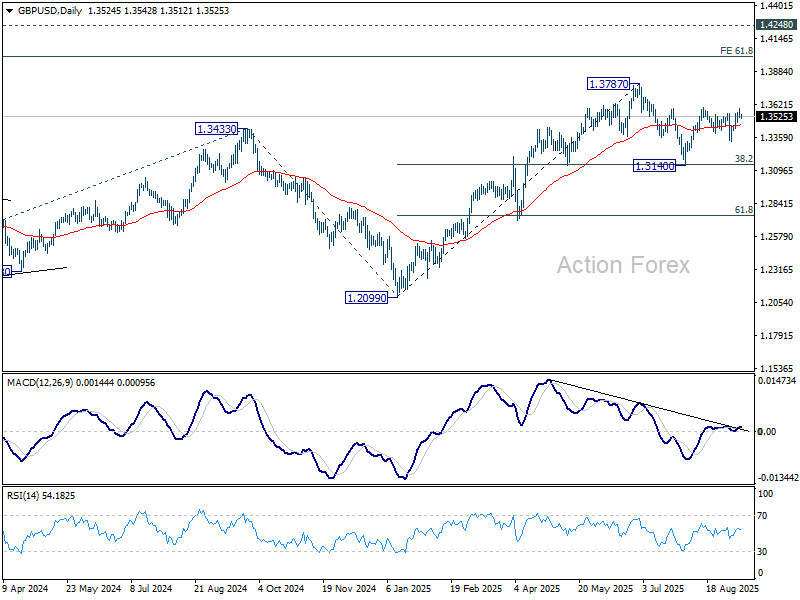
In the bigger picture, up trend from 1.3051 (2022 low) is in progress. Next medium term target is 61.8% projection of 1.0351 to 1.3433 from 1.2099 at 1.4004. Outlook will now stay bullish as long as 55 W EMA (now at 1.3132) holds, even in case of deep pullback.
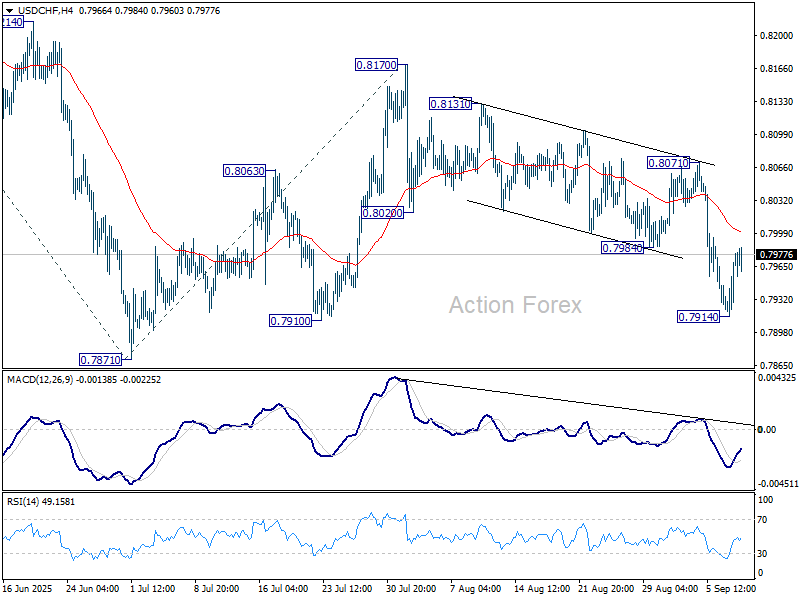
USD/CHF Daily Outlook
Daily Pivots: (S1) 0.7934; (P) 0.7958; (R1) 0.7999; More….
Intraday bias in USD/CHF is turned neutral with current retreat. But risk will stay on the downside as long as 0.8071 resistance holds. Below 0.7914 will bring retest of 0.7871 low. Firm break there will resume larger down trend. Next target is 61.8% projection of 0.8475 to 0.7871 from 0.8170 at 0.7797.
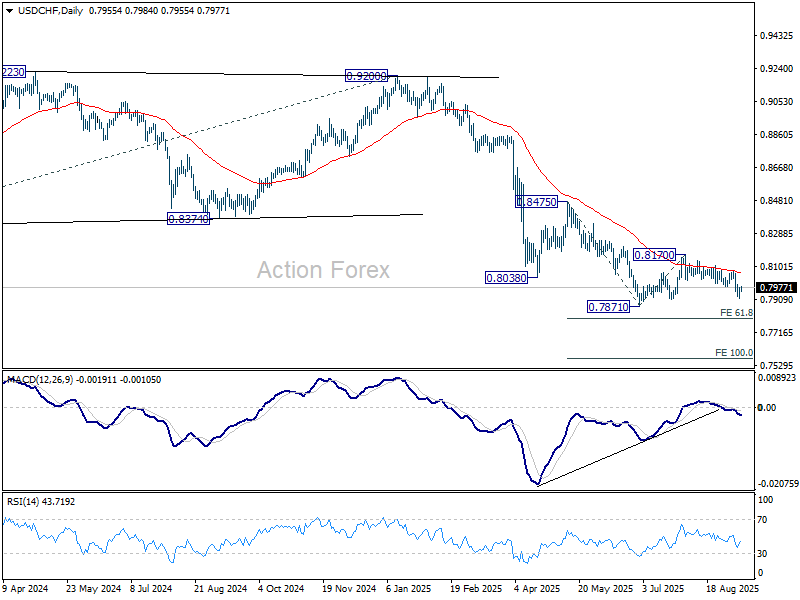
In the bigger picture, long term down trend from 1.0342 (2017 high) is still in progress. Next target is 100% projection of 1.0146 (2022 high) to 0.8332 from 0.9200 at 0.7382. In any case, outlook will stay bearish as long as 0.8475 resistance holds.
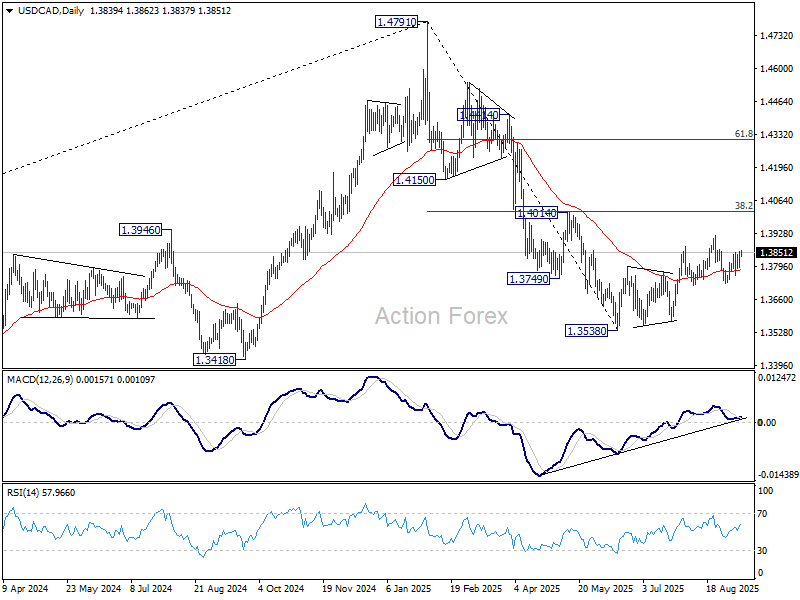
USD/CAD Daily Outlook
Daily Pivots: (S1) 1.3805; (P) 1.3833; (R1) 1.3871; More...
Intraday bias in USD/CAD remains neutral for the moment. On the upside, firm break of 1.3923 resistance will resume whole corrective rebound from 1.3538. However, sustained break of 1.3725 will argue that the rebound has completed at 1.3923, and turn near term outlook bearish.
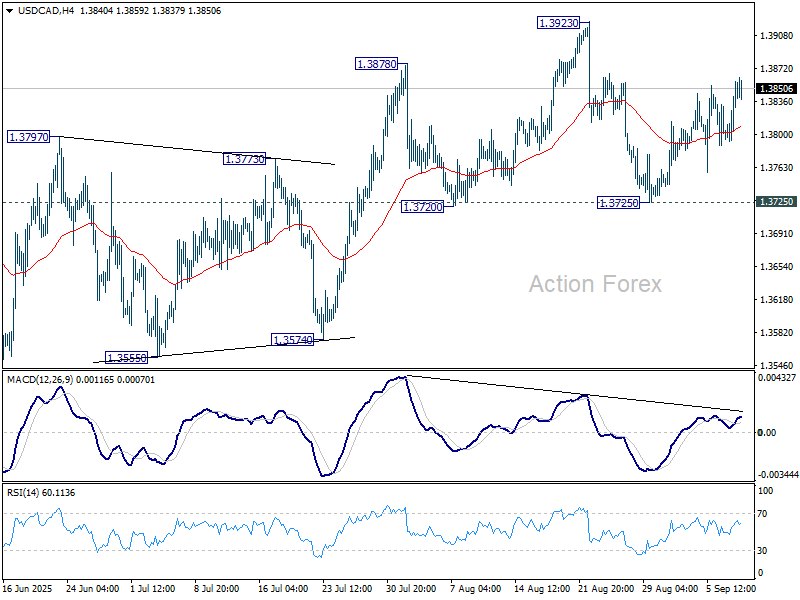
In the bigger picture, price actions from 1.4791 medium term top could either be a correction to rise from 1.2005 (2021 low), or trend reversal. In either case, further decline is expected as long as 1.4014 cluster resistance (38.2% retracement of 1.4791 to 1.3538 at 1.4017) holds. Next target is 61.8% retracement of 1.2005 (2021 low) to 1.4791 at 1.3069.
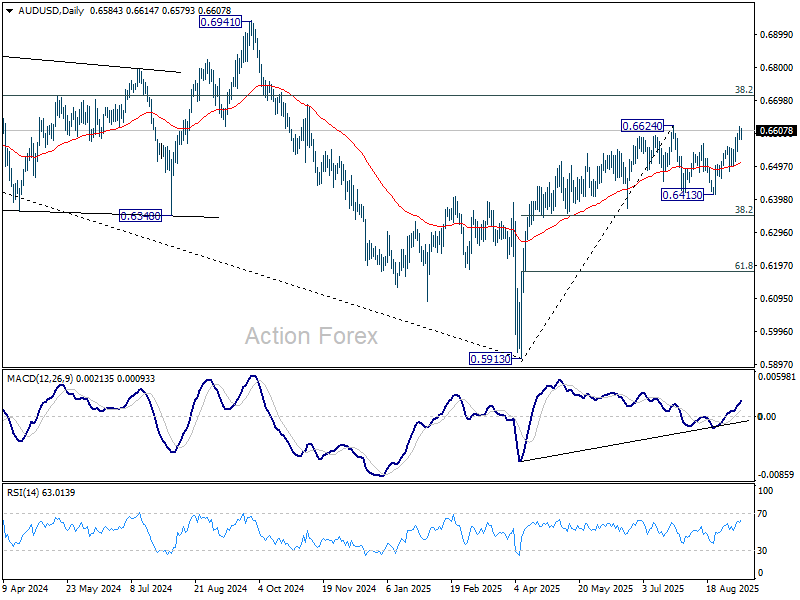
AUD/USD Daily Report
Daily Pivots: (S1) 0.6570; (P) 0.6595; (R1) 0.6610; More...
AUD/USD retreated ahead of 0.6624 resistance and intraday bias is turned neutral first. Some consolidations could be seen but further rally is expected as long as 0.6559 resistance turned support holds. On the upside, firm break of 0.6624 will resume larger rally from 0.5913 to 0.6713 fibonacci level. However, sustained break of 0.6559 will turn bias to the downside and extend the corrective pattern from 0.6624 with another falling leg.
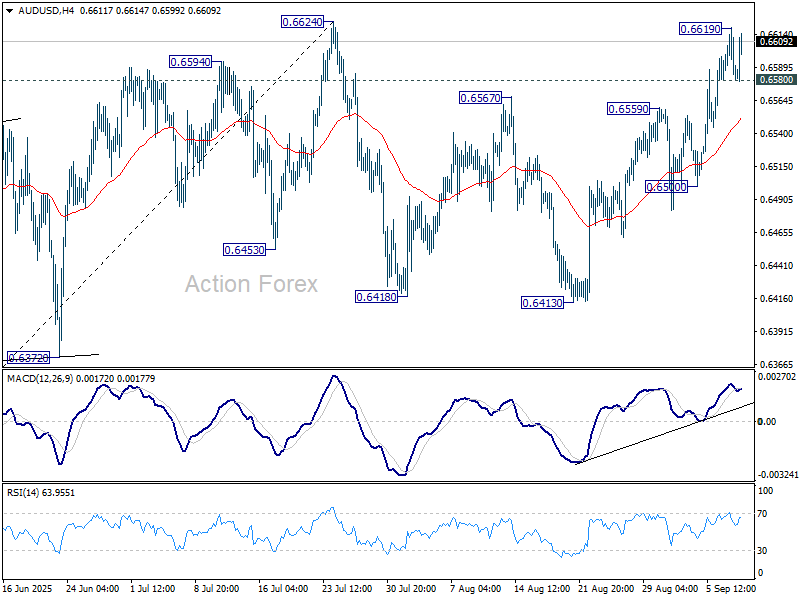
In the bigger picture, there is no clear sign that down trend from 0.8006 (2021 high) has completed. Rebound from 0.5913 is seen as a corrective move. While stronger rally cannot be ruled out, outlook will remain bearish as long as 38.2% retracement of 0.8006 to 0.5913 at 0.6713 holds. Nevertheless, considering bullish convergence condition in W MACD, even in case of another fall through 0.5913, downside should be contained above 0.5506 (2020 low).
Dollar Selloff Pauses Ahead of PPI Test
Dollar sellers paused, with the greenback holding just above recent lows as traders took profits ahead of two crucial U.S. inflation reports. Momentum stalled as markets awaited fresh catalysts in the form of PPI today and CPI on Thursday. Any signs of hotter-than-expected price growth may revive fears of stagflation, complicating the Fed’s task as it weighs cutting rates to stabilize the weakening labor market. On the other hand, if tariffs prove less inflationary than feared, bets on faster easing would quickly intensify.
Fed independence remains a parallel concern after a federal judge blocked US President Donald Trump’s attempt to remove Governor Lisa Cook. The ruling held that the law’s “for cause” provision cannot be used to remove a governor for pre-office conduct. The case, expected to reach the Supreme Court, could set a major precedent on the limits of presidential authority.
Cook has denied any wrongdoing in relation to Trump’s allegations of mortgage fraud. Judge Jia Cobb stressed that the public interest lies in protecting the Fed’s independence, a principle markets view as crucial for maintaining credibility in tackling inflation.
On the trade front, Trump asked the EU to impose tariffs of up to 100% on China and India over their Russian oil purchases, pledging that Washington would mirror any such measures. The U.S. already lifted tariffs on Indian imports to as high as 50%, prompting protests from New Delhi. China, the biggest buyer of Russian oil, has so far been spared after agreeing to a tariff truce with Washington.
Meanwhile in Europe, French President Emmanuel Macron appointed loyalist Sebastien Lecornu as Prime Minister, signaling continuity on his pro-business reform agenda. Lecornu, 39, will lead another minority government, tasked with finding compromises across parliament as France grapples with debt concerns and political fatigue.
For the week so far, Loonie is the weakest performer, with Euro and Yen not far behind. On the stronger side, Kiwi leads, followed by Aussie and Sterling, reflecting a modest risk-on backdrop. Dollar and Swiss Franc sit in the middle.
In Asia, Nikkei rose 0.84%. Hong Kong HSI is up 1.29%. China Shanghai SSE is up 0.34%. Singapore Strait Times rose 1.07%. Japan 10-year JGB yield rose 0.002 to 1.567. Overnight, DOW rose 0.43%. S&P 500 rose 0.27%. NASDAQ rose 0.37%. 10-year yield rose 0.028 to 4.074.
China CPI falls -0.4% yoy, core inflation hits 2-1/2 year high
China’s consumer prices slipped deeper into deflation in August, with CPI down -0.4% yoy after July’s flat reading, worse than expectations of -0.2% yoy and the weakest in six months. Food prices were the main drag, falling -4.3% yoy versus -1.6% yoy previously. On a monthly basis, CPI was unchanged, undershooting forecasts for a small 0.1% mom rise.
At the same time, core inflation showed signs of life, rising 0.9% yoy in August compared with 0.8% yoy in July — the fastest pace in two and a half years. The pickup suggests underlying demand in services and other non-food sectors is holding up better than headline numbers imply, even as consumers face falling food costs.
Producer prices continued to contract, though at a slower pace. PPI dropped -2.9% yoy, in line with expectations and an improvement from -3.6% yoy in July. The figures highlight China’s ongoing struggle with persistent factory-gate deflation, which has now lasted nearly three years.
AUD/USD Daily Report
Daily Pivots: (S1) 0.6570; (P) 0.6595; (R1) 0.6610; More...
AUD/USD retreated ahead of 0.6624 resistance and intraday bias is turned neutral first. Some consolidations could be seen but further rally is expected as long as 0.6559 resistance turned support holds. On the upside, firm break of 0.6624 will resume larger rally from 0.5913 to 0.6713 fibonacci level. However, sustained break of 0.6559 will turn bias to the downside and extend the corrective pattern from 0.6624 with another falling leg.
In the bigger picture, there is no clear sign that down trend from 0.8006 (2021 high) has completed. Rebound from 0.5913 is seen as a corrective move. While stronger rally cannot be ruled out, outlook will remain bearish as long as 38.2% retracement of 0.8006 to 0.5913 at 0.6713 holds. Nevertheless, considering bullish convergence condition in W MACD, even in case of another fall through 0.5913, downside should be contained above 0.5506 (2020 low).
AUD/USD Technical: Further Aussie Rally Towards Major Resistance, Supported by Firmer China Core
Since a retest on its key medium-term “Expanding Wedge” range support on 22 August 2025, the AUD/USD has staged a minor bullish reversal and rallied by 3.2% (low to high) to print an intraday high of 0.6620 on Tuesday, 9 September 2025, on the backdrop of a broad-based weaker US dollar against other major currencies in anticipation of a Fed dovish pivot.
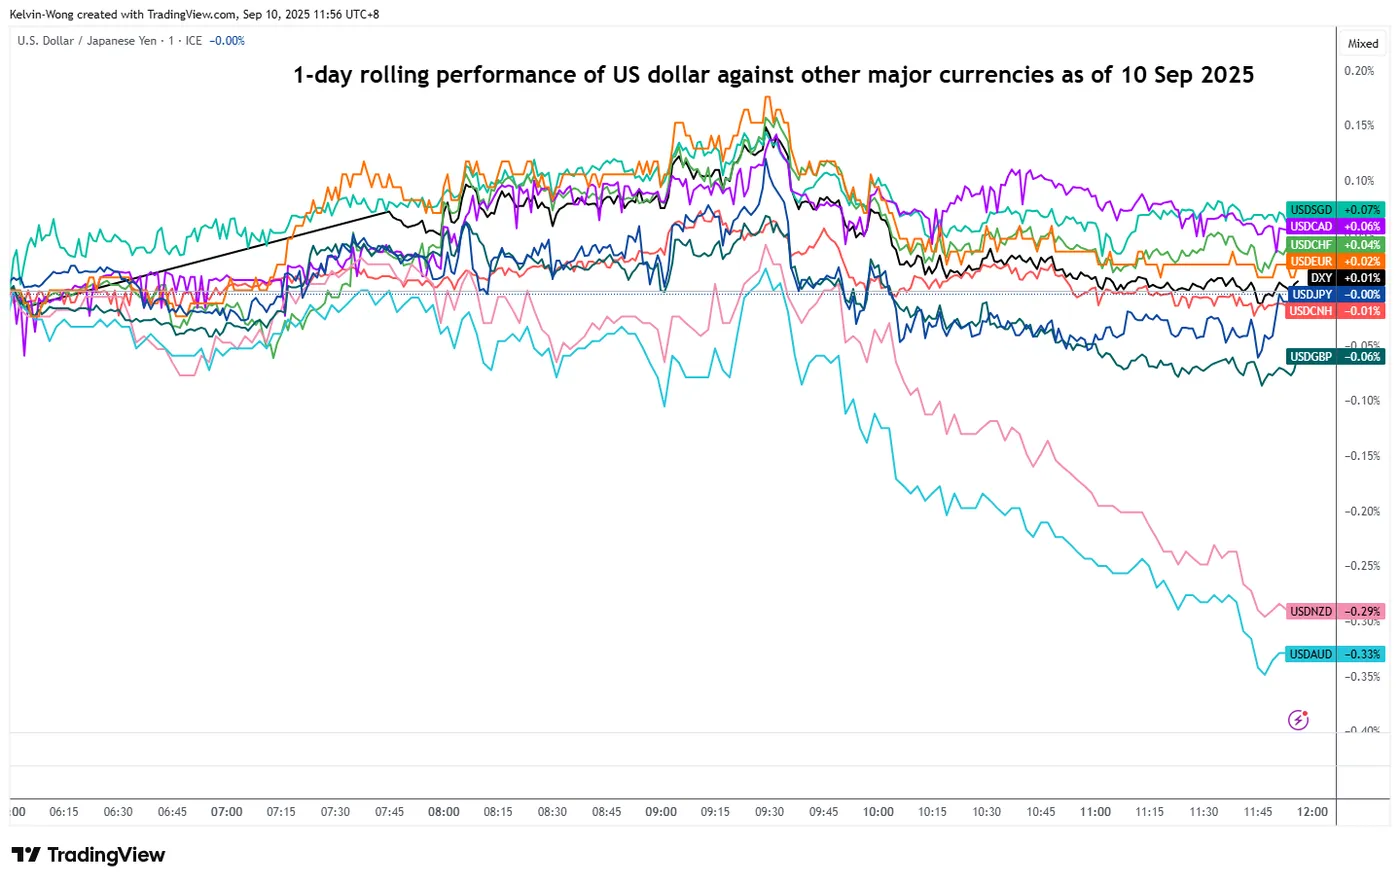
Fig. 1: One-day rolling performances of the US dollar against major currencies as of 10 Sep 2025 (Source: TradingView)
In today’s Asia session, on 10 September, the Australian dollar is the strongest-performing currency among the majors against the US dollar. Based on a one-day rolling performance, the USD/AUD cross rate has declined by -0.3%, much more than the US Dollar Index, which is trading almost unchanged (see Fig. 1).
The current upswing in AUD/USD has been reinforced by easing concerns over a potential deflationary spiral in China from the latest key inflationary trends data for August.
China’s core CPI has swung up further into growth territory
China inflation trend with AUD/USD
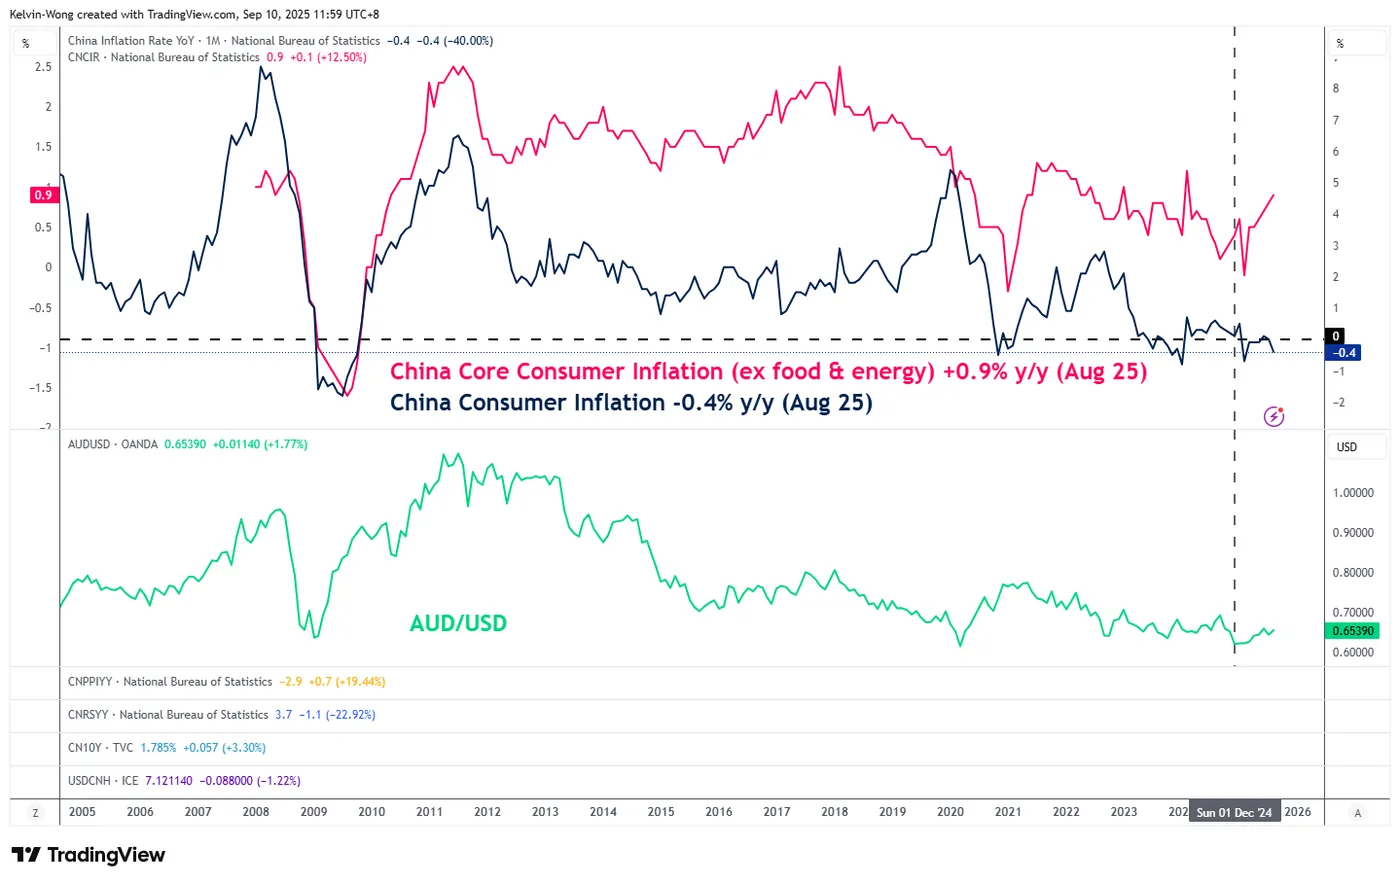
Fig. 2: China CPI and core CPI with AUD/USD as of 10 Sep 2025 (Source: TradingView)
China is a key trading partner of Australia, where a higher consumer demand from China on Australia’s raw minerals products is likely to exert upside pressure on the Aussie dollar.
Despite the weaker-than-expected headline China’s consumer prices (CPI) that dropped to -0.4% y/y in August from a flat reading in July, and missing forecasts of a -0.2% y/y fall, the core CPI (excluding food and energy) has improved to a further positive reading of 0.9% y/y in August from 0.8% y/y in July,
Overall, the core CPI trend in China has trended higher over the past six months, since the February 2025 print of -0.1% year-over-year. Interestingly, the long-term movement (monthly chart) of the AUD/USD has a direct correlation with the trend of China’s core CPI (see Fig. 2).
China’s improving core CPI trend is likely to lift consumer confidence, which has remained subdued since the post-COVID period and the property market downturn. A recovery in sentiment could drive stronger demand for Australia’s raw minerals, creating a positive feedback loop that supports further strength in the Aussie dollar.
Let’s now decipher the short-term trajectory (1 to 3 days) of the AUD/USD and its key levels to watch from a technical analysis perspective.
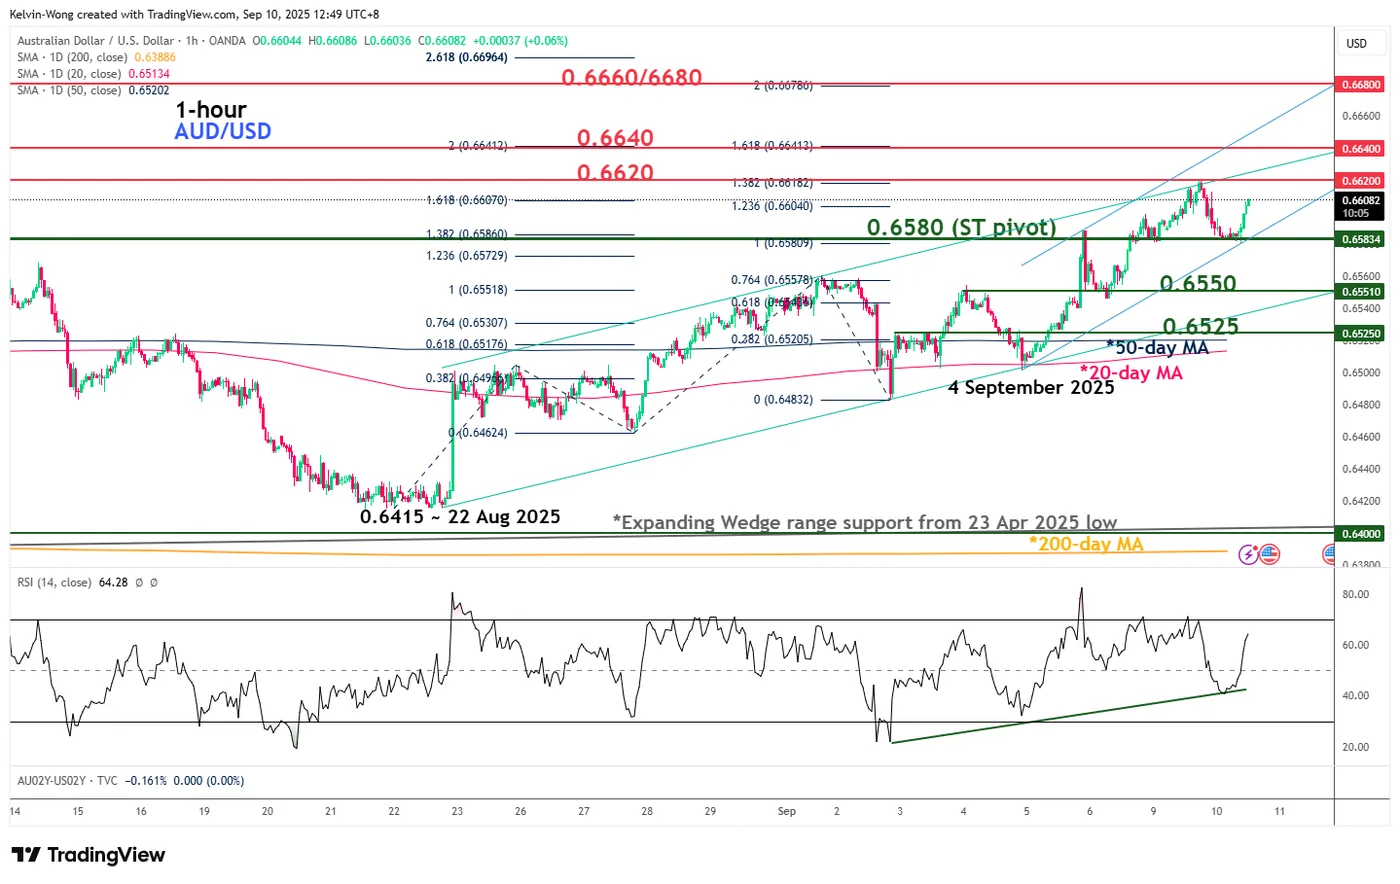
Fig. 3: AUD/USD minor trend as of 10 Sep 2025 (Source: TradingView)
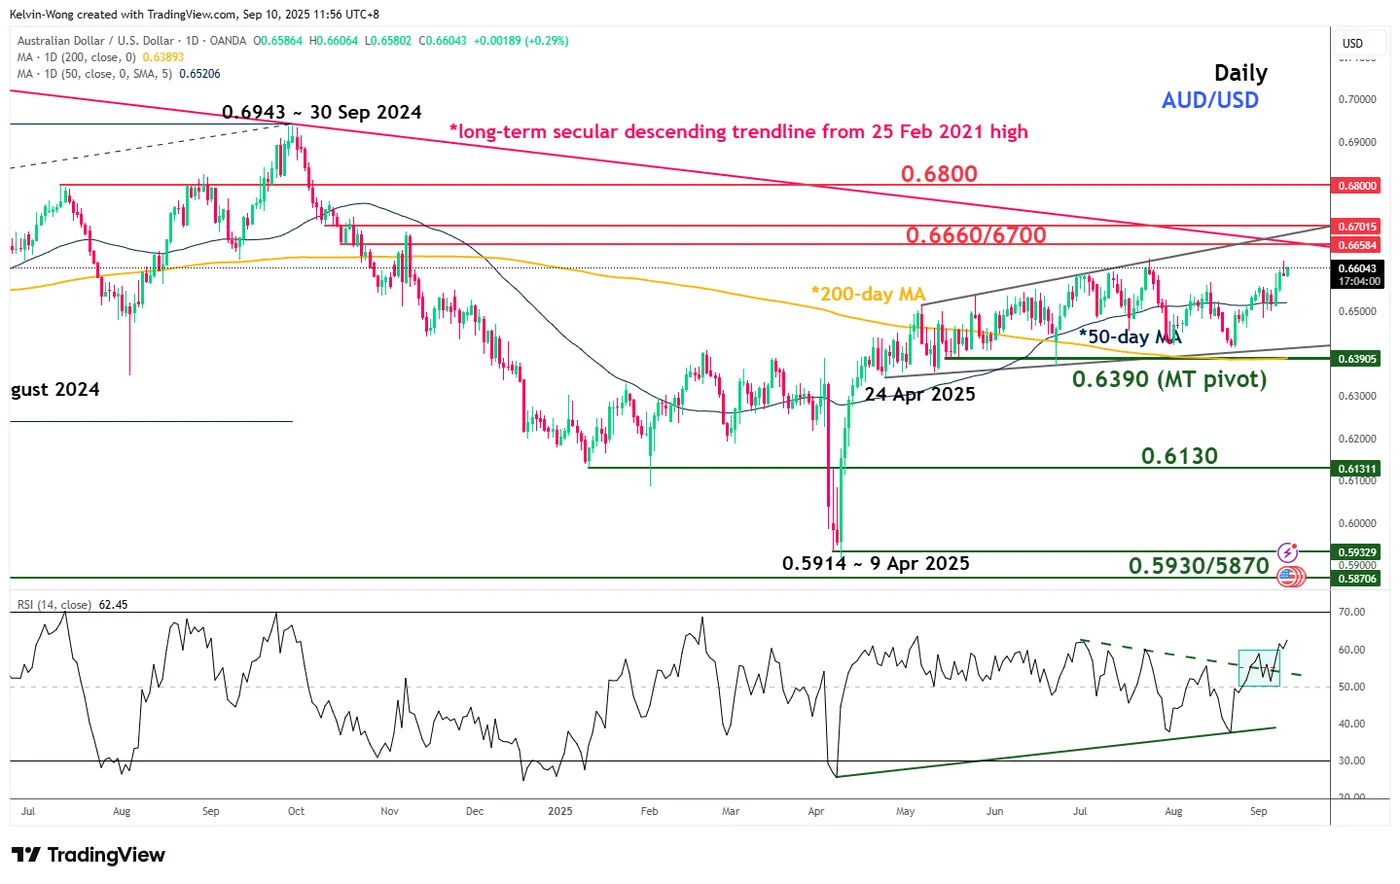
Fig. 4: AUD/USD medium-term trend as of 10 Sep 2025 (Source: TradingView)
Preferred trend bias (1-3 days)
Since its minor swing low of 0.6501 printed on 4 September 2025, AUD/USD is now undergoing a potential minor bullish acceleration phase after a retest of its 20-day moving average.
Bullish bias above 0.6580 key short-term pivotal support, and a clearance above 0.6620 sees the next intermediate resistances coming in at 0.6640 and 0.6660/0.6680 (also a Fibonacci extension cluster) (see Fig. 3).
Key elements
- Price actions of the AUD/USD have traded back above the 20-day and 50-day moving averages since last Friday, 5 September 2025, which reinforces a minor uptrend phase that is still in progress.
- The hourly RSI momentum indicator has managed to stage a rebound at its parallel ascending support, suggesting that the short-term bullish momentum condition remains intact.
- The AUD/USD is still evolving within a medium-term “Expanding Wedge” configuration since 22 April 2025, with the upper limit/resistance of the “Expanding Wedge” standing at 0.6660/0.6700 (also the long-term secular descending trendline from 25 February 2021 high) (see Fig. 4).
Alternative trend bias (1 to 3 days)
A break below 0.6580 key short-term support invalidates the bullish scenario on the AUD/USD to trigger off another round of minor corrective decline sequence to expose the next intermediate supports at 0.6550 and 0.6525.