Sample Category Title
USDCAD Falls Despite a US GDP Data Beat – Technical Outlook
GDP data for Q2 just got released – A 3.3% annualized beat vs a 3.1 expectations could have been expected to lead to a USD rally, but the reverse happened instead.
The Greenback is currently the second worst performer of all majors, just ahead of the CHF.
Tomorrow will also await the GDP data release for Canada which should add to some volatility in the pair.
USDCAD is now back into its July range which spanned between 1.3550 to 1.38 – Further correction would be needed to fully confirm the re-entry – Discover which ones in our technical analysis just below.
In terms of tariffs, the "duty-free shipping" de minimis exemption of Canadian goods to the US expires on Friday which is creating fears of higher costs for Canadians and Americans.
Tariff talks were in a bit of a limbo but with the deadline approaching, Canada PM Mark Carney decided to drop many retaliatory tariffs against the US in an attempt to reduce the uncertainty towards animous relations between the two neighbors.
USDCAD multi-timeframe technical analysis
USDCAD Daily Chart
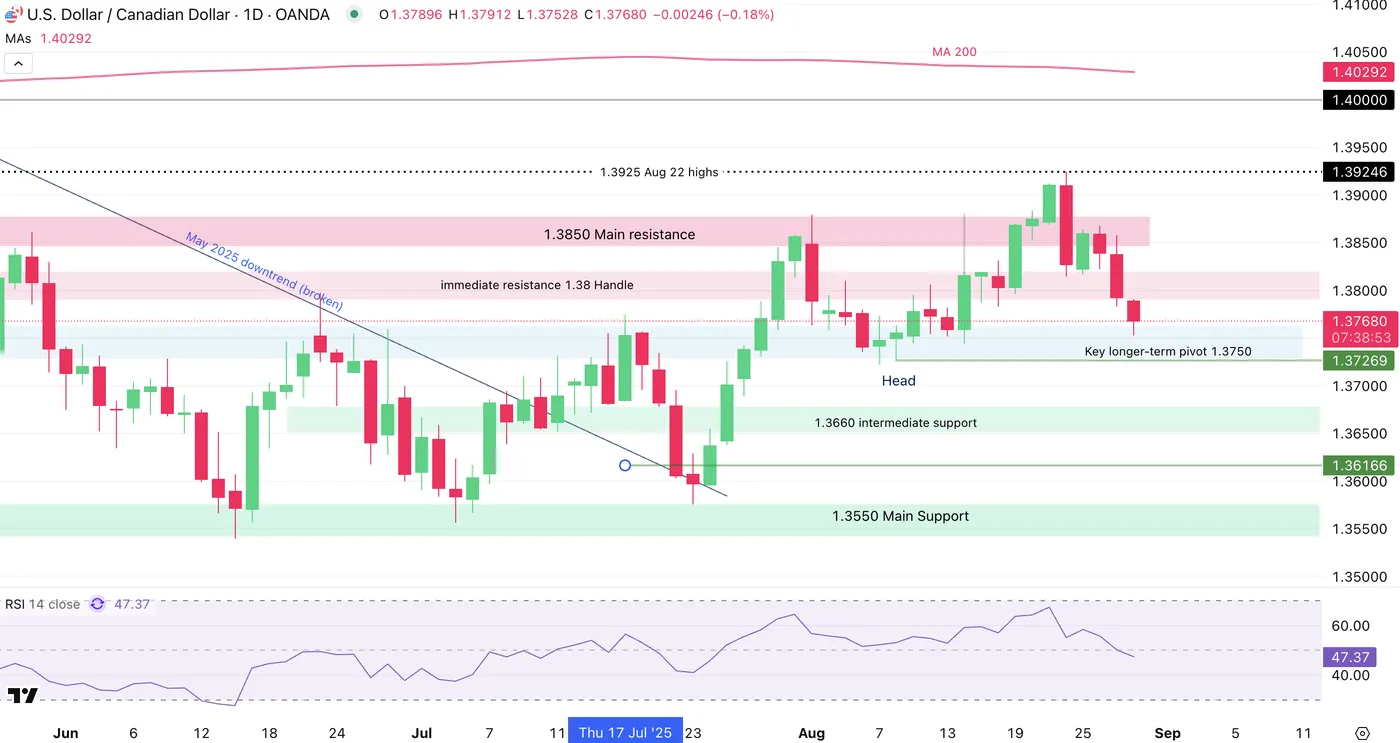
USDCAD Daily Chart, August 28, 2025 – Source: TradingView
The pair had been holding just above the 1.38 handle (1.38130) for a few moments but ironically, right after the release of our mid-week NA Markets recap mentioning the support level, US Dollar selling flows broke support.
In the meantime, the today's selling is entering the 1.3750 Pivot Zone (+/- 150 pips) and some small mean-reversion is happening right ahead of the 50-Day MA (1.3735).
Daily momentum is also breaching the neutral RSI level towards the bearish side, adding to the odds of a full range re-entry of the pair, after prolonged CAD weakness.
We will see if tomorrow's Canada GDP data corroborates with the current technicals.
USDCAD 4H Chart
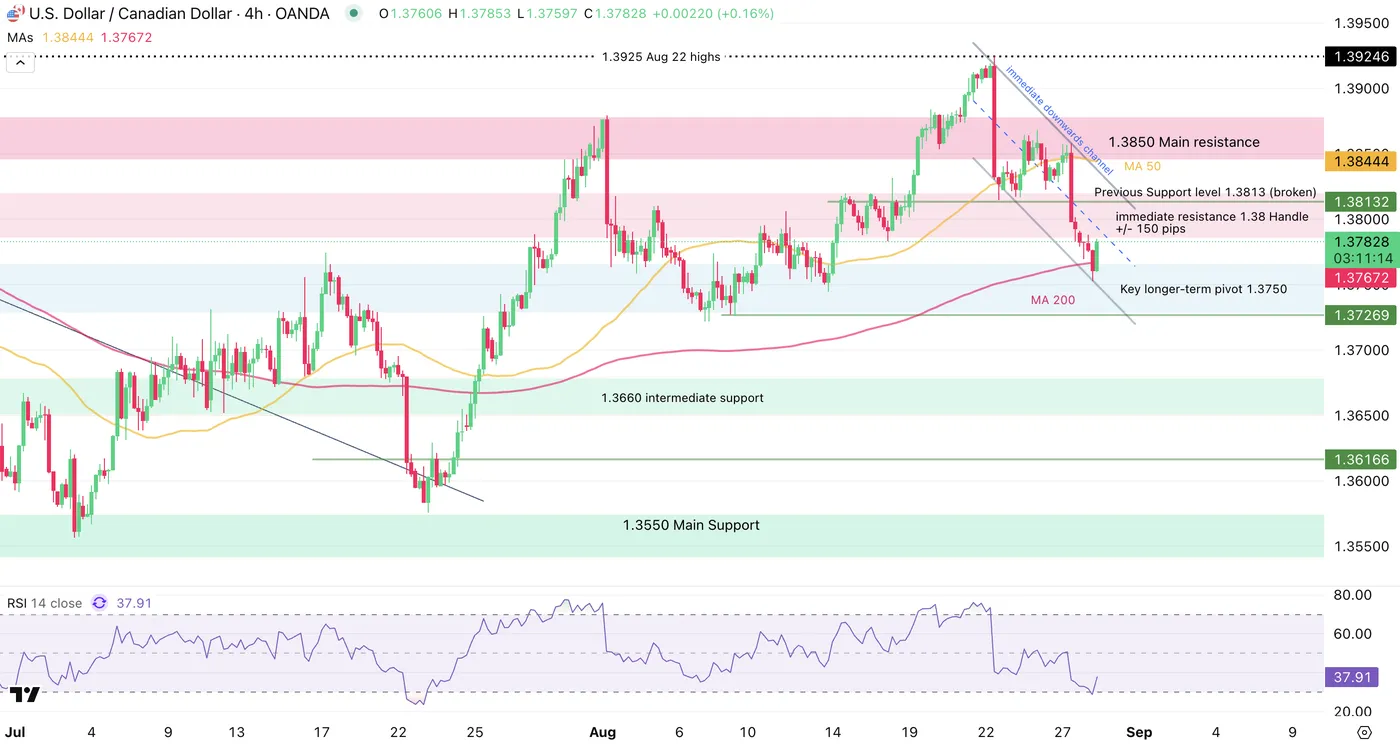
USDCAD 4H Chart, August 28, 2025 – Source: TradingView
After previously holding around the 1.38130 level held buy USDCAD bulls, their
Buyers are stepping in after strong selling flows at the pivot zone, therefore the 1.38 resistance zone should come into play soon.
The resistance zone may also act in confluence with the middle of the current downward channel – bearish reactions here will be key to re-enter the range. Failure to do so should lead to a retest of the 1.3850 Main resistance zone.
Levels to place on your USDCAD charts:
Resistance Levels:
- 1.38 immediate resistance Zone (+/- 150 pips)
- 1.3850 Main resistance
- 1.3925 Aug 22 highs last Friday highs
- May Highs 1.40185
Support Levels:
- 4H MA 200 and 50-Day MA between 1.3730 and 1.3760
- Key longer-term pivot Zone 1.3750
- Main Support Zone 1.3675 to 1.3686
USDCAD 1H Chart
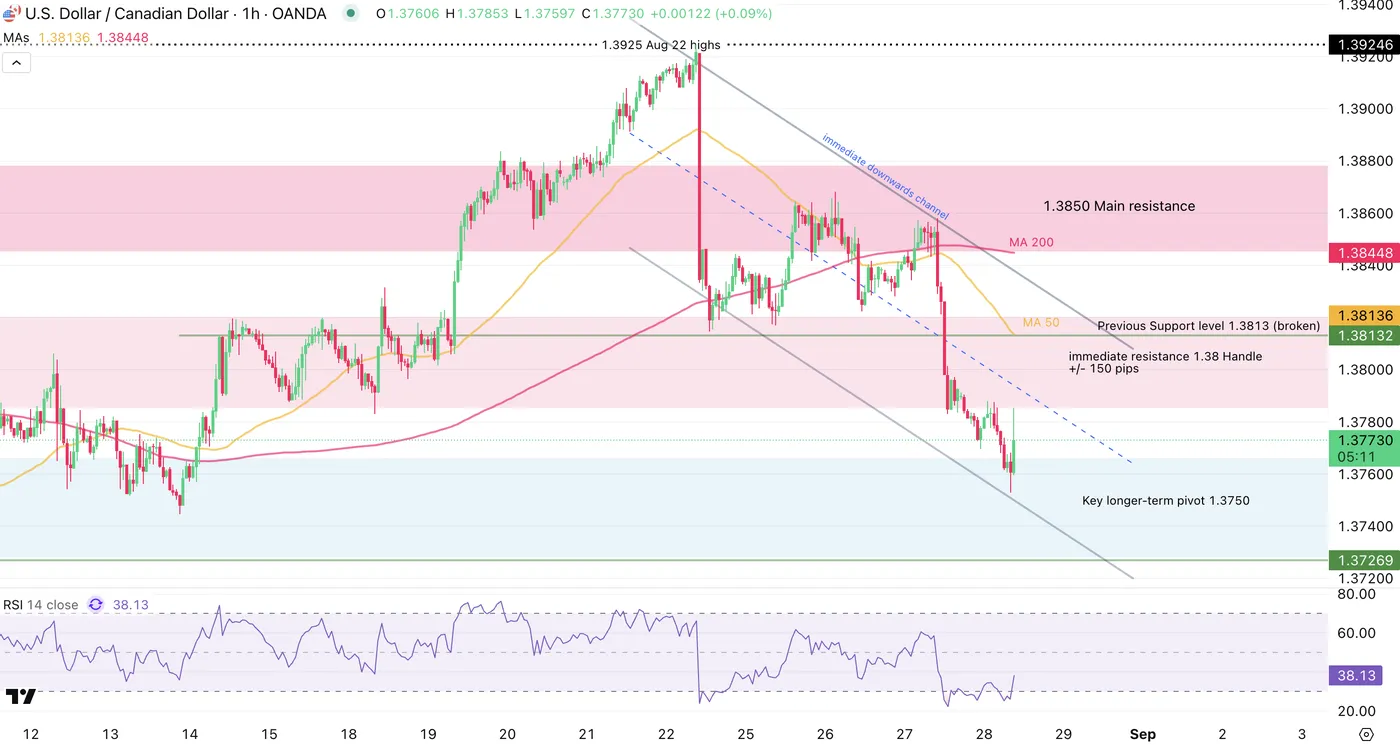
USDCAD 1H Chart, August 28, 2025 – Source: TradingView
The immediate action is fairly balanced, with the 1H RSI rebounding from oversold – However, the current 1H candle is seeing immediate rejection as markets are approaching the low of the immediate resistance zone.
A continuation of the downmove should take the pair towards the lows of the pivot zone between 1.37 to 1.3725.
Price action may consolidate a bit before further movement due to low RSI levels – Keep those in check.
For immediate breakout levels, look at the High of current 1H Candle 1.3785 for continued upside, while for a breakdown, look at the Daily lows at 1.3753.
Safe Trades!
US GDP Data Beats Estimates with 3.3% Print, Gold Eyes Acceptance Above $3400/oz
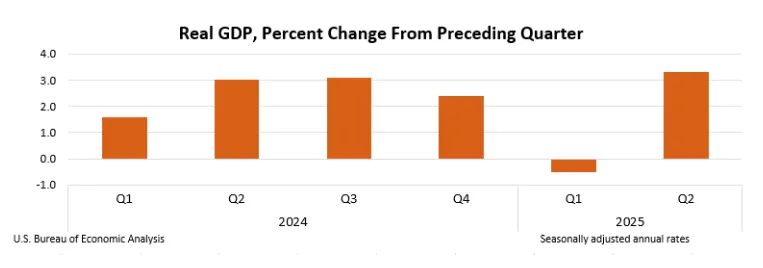
Real gross domestic product (GDP) increased at an annual rate of 3.3 percent (0.8 percent at a quarterly rate) in the second quarter of 2025 (April, May, and June), according to the second estimate released by the U.S. Bureau of Economic Analysis. In the first quarter, real GDP decreased 0.5 percent.
Source: US Bureau of Economic Analysis
The economy grew in the second quarter, mainly because the country imported fewer goods and services, and people spent more money. However, this growth was limited by businesses investing less and the country exporting less.
The initial estimate of economic growth was later corrected to be a bit higher. This correction happened because it was found that businesses invested more and people spent more than first thought, but this was partly canceled out by the government spending less and the country importing more than initially estimated.
Compared to the first quarter, the second quarter's growth was a result of a sharp drop in imports and faster consumer spending, which were partly countered by a decrease in investment.
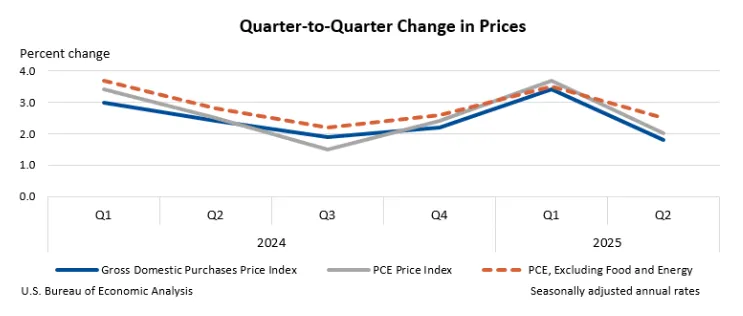
A key measure of private-sector activity, which adds up what consumers and businesses spent, grew by 1.9 percent, which was a significant upward correction from the earlier number. Prices for goods and services bought in the country went up by 1.8 percent, which was a slightly smaller increase than first thought.
The prices that consumers paid went up by 2.0 percent, also a bit less than first estimated. When you remove volatile food and energy costs, consumer prices went up by 2.5 percent, which was the same as the first estimate.
Source: US Bureau of Economic Analysis
Market Reaction - US Dollar
The US Dollar Index seemed largely unfazed by the data release as it continued its decline once the data was released.
The index is now within touching distance of the recent swing low which is a key area of support resting at 97.70.
A break and candle close below this support level could open up the door for a retest of the Year-to-date lows around 96.37 and may be worth monitoring.
Gold (XAU/USD) Analysis
Gold prices continued their rise today as the precious metal peaked back above the $3400/oz level.
The previous bullish pennant breakout played out to perfection.
The question now will be whether the precious metal can gain acceptance above the $3400/oz before making a run toward the all-time highs.
If it does there is a key level in and around the $3430-$3440 with a candle close above this handle seen as clearing a path for a retest of the ATH at $3500/oz.
There is a golden cross pattern developing on the four-hour as the 50-day MA eyes across above the 100-day MA. While this is a lagging signal it still shows that momentum may currently be favoring a bullish move.
Gold (XAU/USD) Four-Hour Chart, August 27, 2025
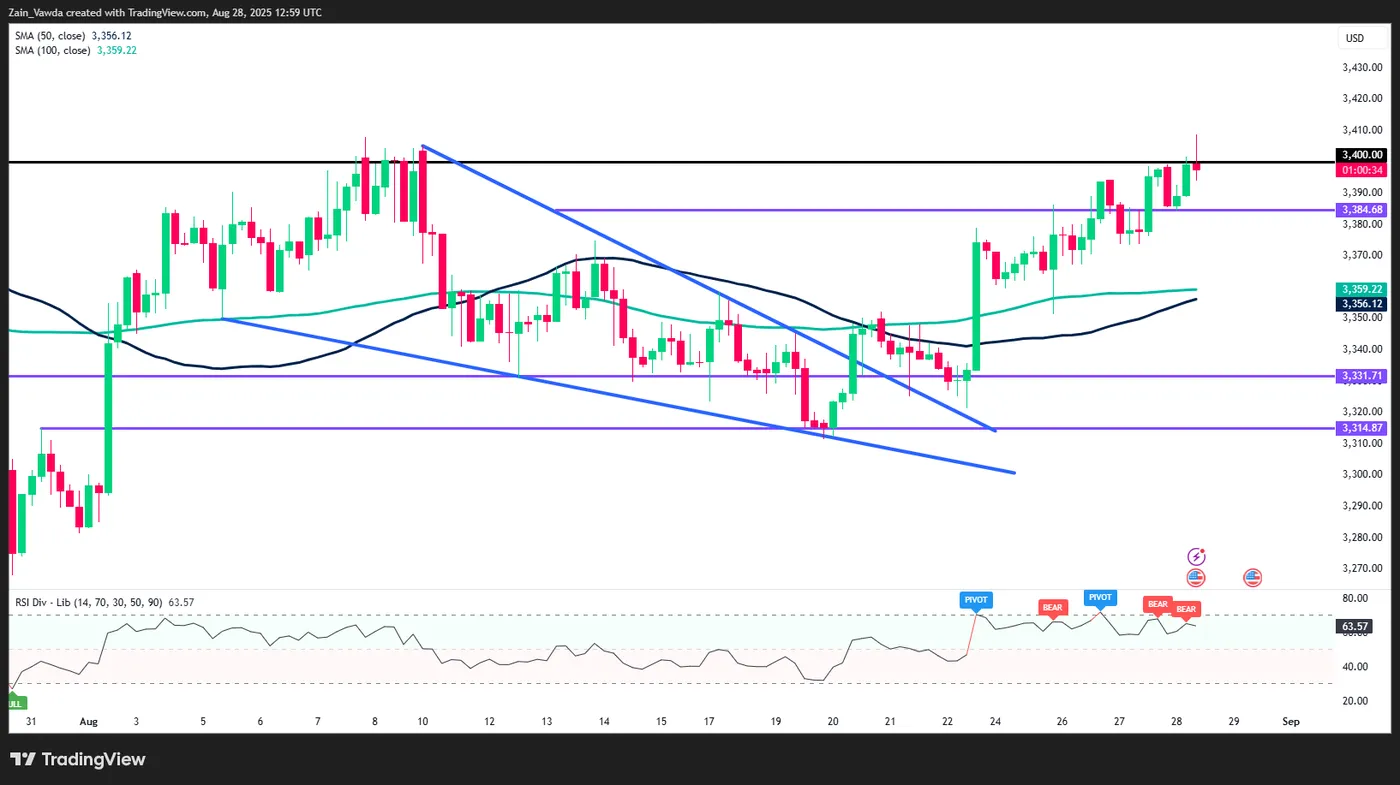
Source:TradingView.com
Client Sentiment Data - Gold
Looking at OANDA client sentiment data and market participants are Long on XAU/USD with 51% of traders net-long. I prefer to take a contrarian view toward crowd sentiment, however the reading of 51% net-long shows the indecision and concern by market participants that Gold can hold above the $3400/oz handle.
US: Q2 GDP Revised Higher to 3.3%
The second estimate of Q2 real GDP was revised higher by 0.3 percentage points to 3.3% quarter/quarter annualized (q/q) – a sharp acceleration from Q1's contraction of 0.5%.
- The upward revision primarily reflected stronger investment and consumer spending relative to the advance estimate, which was partly offset by a downward revision to government spending and a larger gain in imports.
Consumer spending rose 1.6% q/q (previously 1.4%), up from Q1's gain of 0.5%. Spending on both goods (2.4% previously reported as 1.0%) and services (1.2% previously 1.0%) were revised higher.
Non-residential fixed investment rose 5.7% q/q (previously 2.4%), building on a very strong first quarter – largely driven by firm front-running capital spending ahead of the tariffs. In terms of the breakdown, both equipment (7.4% q/q) and intellectual property products (12.8% q/q) were higher, while spending on structures (-8.9% q/q) declined for a second consecutive quarter.
Residential investment declined 4.7% q/q, as homebuilding reached a new cyclical low in the quarter, while home sales trended lower.
Government spending declined a modest 0.2% (previously +0.5%) , as an uptick in state & local spending (+2.6%) was more than offset by a pullback at the federal level (-4.7% q/q).
As was the case in Q1, international trade was a major factor influencing growth last quarter. Imports plummeted by 29.8% q/q – following a gain of 38.0% q/q in Q1. Meanwhile, exports contracted by a more modest 1.3% q/q, resulting in net trade adding 5.0 percentage points (pp) to Q2 GDP. Meanwhile, inventory investment subtracted 3.3pp from headline growth.
Final sales to private domestic purchasers, a better gauge of underlying demand as it includes only household consumption and fixed investment, was revised up to 1.9% (previously 1.2%), matching Q1's gain.
Real Gross Domestic Income (GDI) – an alternative measure of economic output – rose 4.8% in Q2, up from Q1's modest contraction of 0.2%. Corporate profits rose 6.8% annualized or $65 billion after accounting for inventory valuation and capital consumption adjustments. Personal income was up a healthy 5.2% in Q2.
Key Implications
The Bureau of Economic Analysis' second read on Q2 GDP resulted in minor upward revisions, with top-line growth now showing an even stronger 3-handle. While the headline figure was inflated by a massive swing in trade – stemming from an unwinding of Q1's tariff front-running – the upward revisions to consumer spending and business investment suggest that the domestic side of the economy is holding up a bit better than previously reported. This is further corroborated by the solid reading on GDI.
A rebound in vehicle sales in July alongside a decent uptick in retail sales (ex. autos) suggests goods spending picked up last month, but it’s spending on services that has remained especially weak this year. Tomorrow's release of personal income & spending will shed light on whether this trend has continued into the third quarter. With measures of consumer confidence having turned lower and the labor market showing signs of weakness, we suspect households will remain fiscally cautious in the months ahead. Our current tracking has Q3 GDP growing by just 1%.
Sunset Market Commentary
Markets
Over the previous days, political topics drove premia on interest rate markets. US president Trump challenging Fed independence as he tries to fire Board Member Lisa Cook, raised risk premia at the ultra-long end of the US yield curve. In Europe, political chaos in France, blocking any attempts of the (minority) government to address fiscal imbalances had a similar impact on French and some other (fiscal) risk premia in the region. Both topics are far from solved, but there was no high profile ‘new news’ today. In the US, tomorrow’s July price deflators might instruct markets how strong the case is for the Fed to resume policy normalization at the September 17 meeting. US data today (US Q2 GDP revision from 3.1% to 3.3%, weekly jobless claims at 229k from 234k) were of second tier importance and too close to expectations to be able further shaping this debate. The US yield curve shows a minor correction on recent steepening, with the 2-y adding 3.5 bps while the 30-y eases 2 bps. In Europe, the accounts of the July 24 ECB meeting showed that the policy rate has reached an equilibrium level. Recent data suggest modest/subdued growth. The ECB sees the inflation outlook as broadly in line with the June forecasts, holding inflation at the target medium term. The outlook on inflation remains more uncertain than usual, but risk basically are seen as broadly balanced. The governing council deliberately avoids to give any guidance on next policy steps. The text reads that ‘It was important for the Governing Council to have a two-sided perspective, maintaining full optionality for future meetings’ and that ‘Communication should maintain a careful, neutral tone and be deliberately uninformative about future interest rate decisions.’ German yields today are rising marginally (2-y +2 bps,30-y unchanged). The 10-y spread France above Germany eased slightly (3 bps) to 78 bps. On equity markets, guidance from chipmaker Nvidia at yesterday’s earnings report, this morning caused some caution, but after all the impact on global equity markets stays limited. In hesitant, directionless trading, the EuroStoxx 50 gains modestly (+0.2%). The S&P 500 is holding near/at record levels (+0.1%). On FX markets, the euro today overcomes recent (admittedly limited) France-driven weakness. EUR/USD ‘gains’ from the 1.164 area to currently trade near 1.167. EUR/GBP also ‘rebounds’ from 0.862 to 0.864. Both cross rates still are captured in an extremely thin sideways consolidation pattern. The DXY USD index drops back below the 98 big figure (97.95).
News & Views
Belgian inflation was unchanged in August, decreasing by 0.01% M/M and from 1.92% Y/Y to 1.91% Y/Y. The main price increases in August were registered for plane tickets (+8.9% M/M), holiday villages (+5%), electricity (+1.1%), the purchase of vehicles (+0.7%) and private rents (+0.3%). However lower prices for natural gas (-3% M/M), household appliances (-6.8%), motor fuels (-0.9%), vegetables (-1.5%) and travels abroad and city trips (-1.1%) balanced the price rises out. Core inflation broadly stabilized as well at 2.3% Y/Y (from 2.36%). A deeper dive showed services inflation rising from 3.27% Y/Y to 3.48% and rent inflation slowing from 4.2% Y/Y to 3.96%. Energy inflation went from -1.86% Y/Y in July to -0.75% in August and food inflation slowed from 2.98% Y/Y to 2.42%. The first inflation estimate according to the European harmonised index of consumer prices (HICP) amounts to 2.6% for Belgium in August 2025. More national figures are due tomorrow (Spain, France, Italy, Germany) with the EMU number on tap on Monday.
New EU car registrations were 0.7% lower in July (YTD) compared with the first seven months of last year. In the year-on-year comparison however, car registrations increased by 7.4% according to numbers from the European Automobile Manufacturers Association. Up until July 2025, battery-electric cars (BEV) accounted for 15.6% of the EU market share, an increase from the low baseline of 12.5% in July 2024 YTD. Hybrid-electric car registrations continue to surge, capturing 34.7% of the market (from 29.6%), remaining the preferred choice among EU consumers. Meanwhile, the combined market share of petrol and diesel cars fell to 37.7%, down from 47.9% over the same period in 2024. In Belgium, 42.4% of new car registrations (YtD) are petrol cars (from 42.9% YtD in 2024), followed by BEV’s (32.7% from 25.1%), HEV’s (11.5% from 9.2%)) and plug-in hybrid electric vehicles (8.9% from 16.8%).
EUR/USD Mid-Day Outlook
Daily Pivots: (S1) 1.1591; (P) 1.1621; (R1) 1.1668; More...
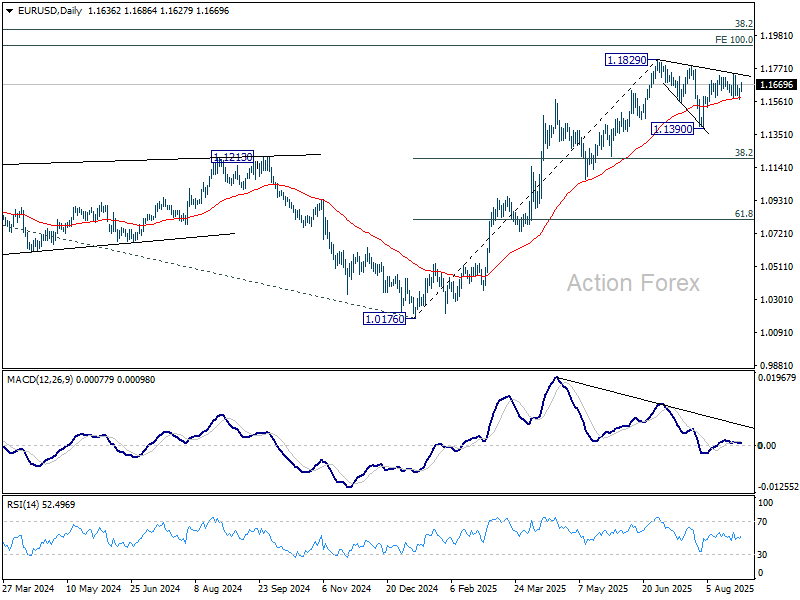
No change in EUR/USD's outlook and intraday bias stays neutral. Further rise is in favor as long as 1.1573 support holds. Break of 1.1741 will resume the rally from 1.1390 to retest 1.1829 high. Firm break there will extend larger up trend. However, decisive break of 1.1573 will extend the corrective pattern from 1.1829 with another downleg, and target 1.1390.
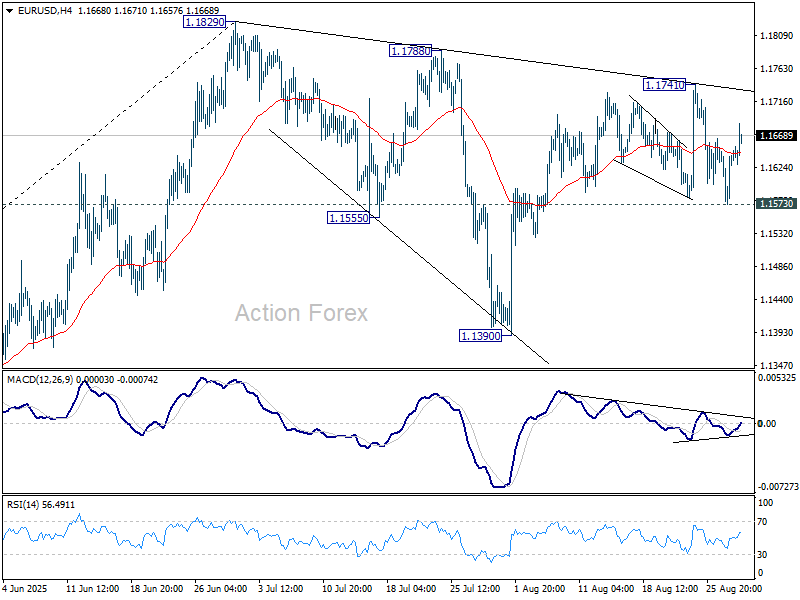
In the bigger picture, rise from 0.9534 long term bottom could be correcting the multi-decade downtrend or the start of a long term up trend. In either case, further rise should be seen to 100% projection of 0.9534 to 1.1274 from 1.0176 at 1.1916. This will remain the favored case as long as 1.1604 support holds.
GBP/USD Mid-Day Outlook
Daily Pivots: (S1) 1.3443; (P) 1.3473; (R1) 1.3528; More...
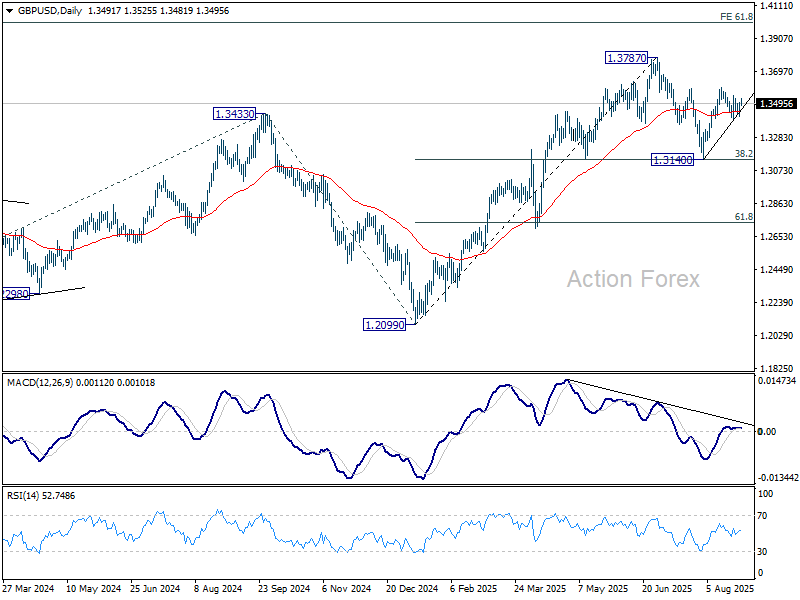
Range trading continues in GBP/USD and intraday bias stays neutral. Further rally is in favor with 1.3389 support intact. On the upside, above 1.3594 will resume the rebound from 1.3140 to retest 1.3787 high. On the downside, however, break of 1.3389 support will extend the corrective pattern from 1.3787 with another fall, and target 1.3140 support.
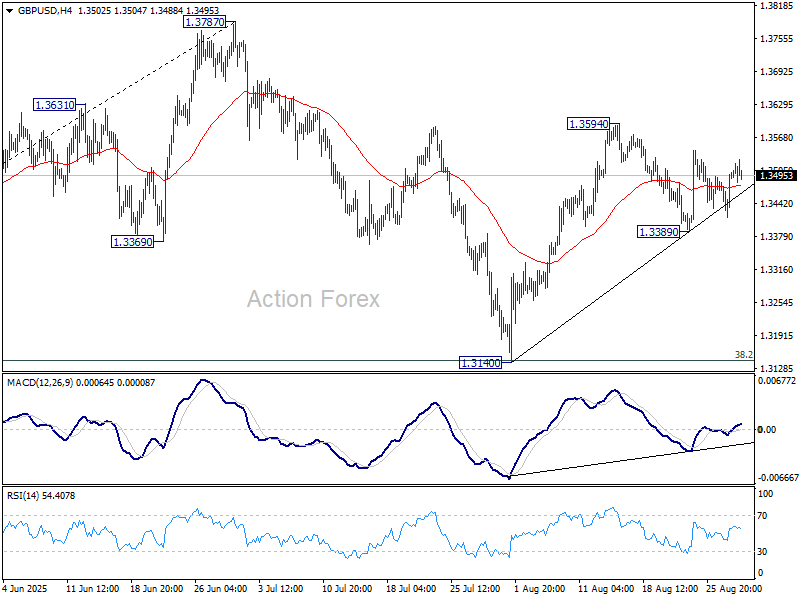
In the bigger picture, up trend from 1.3051 (2022 low) is in progress. Next medium term target is 61.8% projection of 1.0351 to 1.3433 from 1.2099 at 1.4004. Outlook will now stay bullish as long as 55 W EMA (now at 1.3073) holds, even in case of deep pullback.
USD/JPY Mid-Day Outlook
Daily Pivots: (S1) 147.08; (P) 147.63; (R1) 147.97; More...
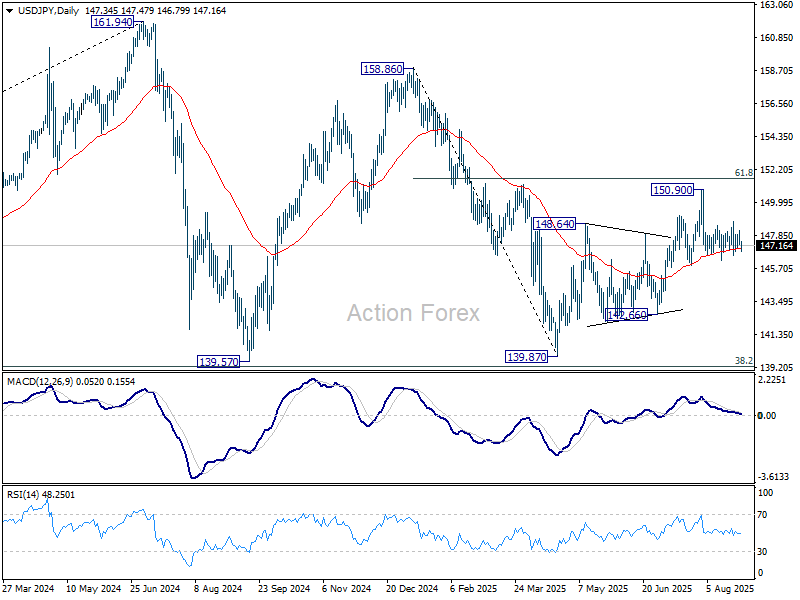
No change in USD/JPY's outlook as range trading continues. On the downside, firm break of 146.20 will resume the fall from 150.90. Also, that would argue that rebound from 139.87 has completed as a corrective move to 150.90. Deeper fall should be seen to 142.667 support for confirmation. On the upside, above 148.76 will bring another rise to retest 150.90 instead.
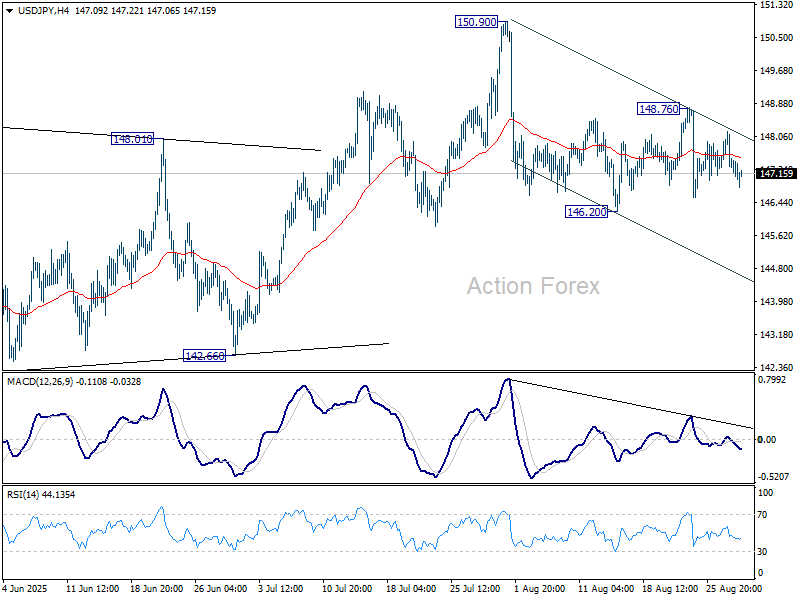
In the bigger picture, price actions from 161.94 (2024 high) are seen as a corrective pattern to rise from 102.58 (2021 low). Decisive break of 61.8% retracement of 158.86 to 139.87 at 151.22 will argue that it has already completed with three waves at 139.87. Larger up trend might then be ready to resume through 161.94 high. In case the corrective pattern extends with another fall, strong support is expected from 38.2% retracement of 102.58 to 161.94 at 139.26 to bring rebound.
USD/CHF Mid-Day Outlook
Daily Pivots: (S1) 0.8001; (P) 0.8038; (R1) 0.8061; More….
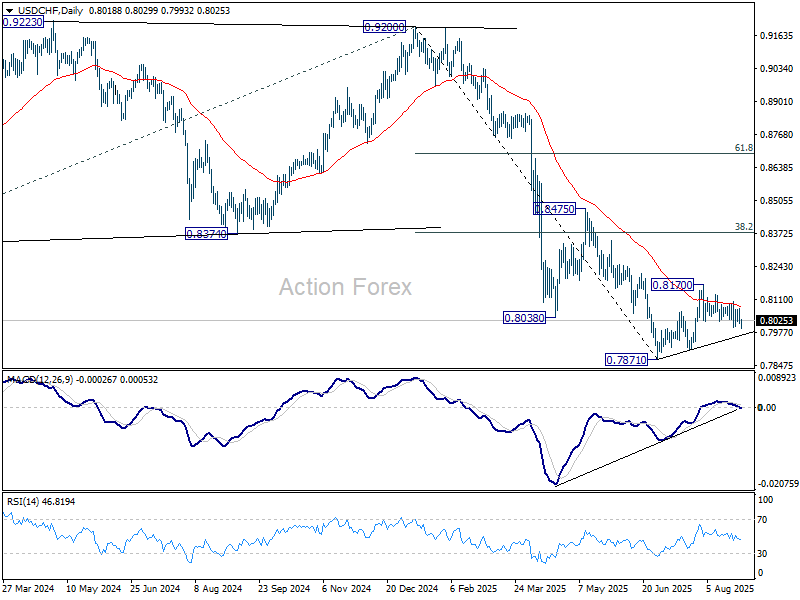
Intraday bias in USD/CHF is back on the downside with breach of 0.7999 temporary low. Fall from 0.8170 is resuming, and should target 0.7910 support first. Break there will bring retest of 0.7871 low. On the upside, however, break of 0.8073 will turn bias to the upside for 0.8103. Further break there will resume the rebound from 0.7871 through 0.8170 resistance.
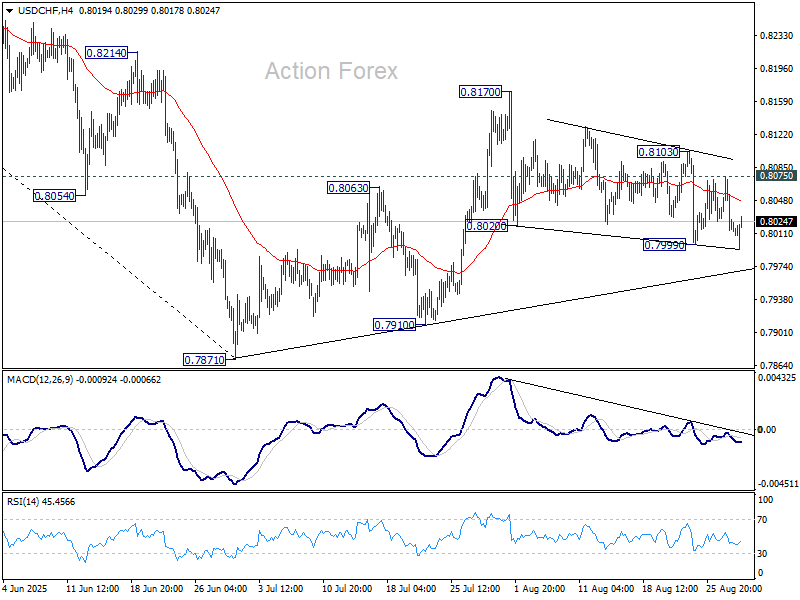
In the bigger picture, long term down trend from 1.0342 (2017 high) is still in progress. Next target is 100% projection of 1.0146 (2022 high) to 0.8332 from 0.9200 at 0.7382. In any case, outlook will stay bearish as long as 0.8475 resistance holds.
Dollar Slips on Month-End Flows, Yuan Jumps to 9-Month High
Dollar weakened broadly today, though without a clear catalyst. Month-end flows are likely in play, while traders turned cautious ahead of what is expected to be a volatile September. With key U.S. releases looming, positioning appears lighter as investors await more decisive signals. Beyond tomorrow's US PCE data, the focus now is squarely on the next two weeks. U.S. nonfarm payrolls and CPI will shape the Fed’s policy outlook, determining whether markets are correct to price a September cut.
For now, Dollar was the weakest currency of the day, followed by Swiss Franc and Sterling. On the other side, Aussie outperformed, while Euro rebounded from earlier weakness. Kiwi also gained ground, while Yen and Loonie held mid-pack.
While overall market conditions remain sluggish, the standout move came from the Chinese Yuan. USD/CNY fell to its lowest level since last November, reflecting stronger demand for Chinese assets. A-shares surged to a 10-year high earlier in the week, signaling renewed investor appetite.
Reports suggest that since mid-April, the CNY’s daily central parity has followed a steady, controlled strengthening trend, with regulators guiding the exchange rate higher deliberately. If incoming data continue to show stabilization in China’s growth outlook, the room for further CNY appreciation could widen......
In Europe, at the time of writing, FTSE is down -0.30%. DAX is up 0.17%. CAC is up 0.52%. UK 10-year yield is down -0.007 at 4.732. Germany 10-year yield is up 0.013 at 2.716. Earlier in Asia, Nikkei rose 0.73%. Hong Kong HSI fell -0.81%. China Shanghai SSE rose 1.14%. Singapore Strait Times rose 0.19%. Japan 10-year JGB yield fell -0.008 to 1.619.
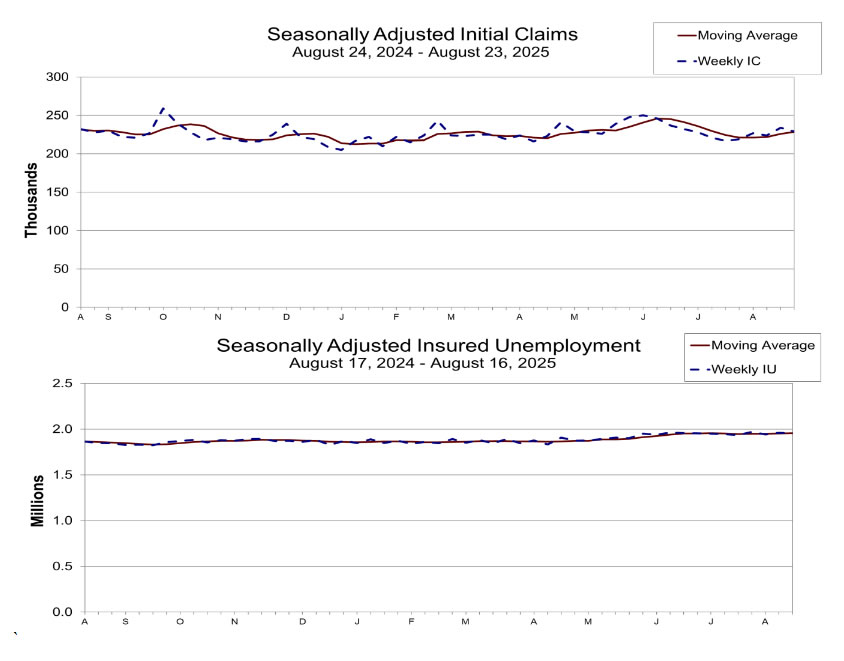
US initial jobless claims fall to 229k vs exp 231k
US initial jobless claims fell -5k to 229k in the week ending August 23, below expectation of 231k. Four-week moving average of initial claims rose 2.5k to 228.5.
Continuing claims fell -7k to 1954k in the week ending August 16. Four-week moving average of continuing claims rose 4.5k to 1956k.
ECB sees case for another cut but greater value in waiting for September
ECB’s July meeting accounts highlighted that, while current conditions remain consistent with another rate cut, policymakers see a “high option value” in waiting until September.
Rates were judged to be in “broadly neutral territory” after eight cuts in nine meetings, financial conditions remained stable, and inflation was viewed as “in a good place” relative to the medium-term target.
The minutes stressed that uncertainty—ranging from trade disputes to geopolitical risks—warrants patience. Holding policy steady provides time to evaluate the impact of earlier cuts and to monitor data on manufacturing, services inflation, exchange rates, and financial markets, as well as the outcome of trade negotiations.
September was singled out as the point when fresh staff projections and new data would give a clearer reading of the economy’s underlying direction. Policymakers highlighted that this would help to resolve “counteracting forces” currently obscuring the signals.
While some argued for "a further rate cut" given "increasing downside risks to output and inflation", the dominant view favored patience. By waiting until September, the ECB preserves flexibility and ensures any further move is better informed by the latest evidence.
Switzerland posts 0.1% Q2 GDP growth, SECO cuts forecasts on US tariffs, rules out deep recession
Switzerland’s economy grew just 0.1% qoq in Q2, in line with expectations, as SECO noted that the “anticipated correction” followed above-average growth earlier this year. Industrial output and exports contracted sharply, while services posted broad-based gains.
SECO also issued an updated scenario reflecting the drag from new U.S. tariffs on Swiss imports, warning the economy is now likely to expand more slowly than previously projected. T
The Federal Government’s June forecast had already pointed to below-average growth, with GDP seen at 1.3% in 2025 and 1.2% in 2026. The revised simulation now pegs growth at just 1.2% in 2025 and 0.8% in 2026, citing the August introduction of higher tariffs.
While a severe recession is not anticipated, SECO warned that the impact could be significant for exporters and certain industries exposed to U.S. demand.
NZ ANZ business confidence rises to 49.7, weak spots reinforce RBNZ’s dovish tilt
New Zealand’s ANZ Business Confidence index improved modestly in August, rising to 49.7 from 47.8. However, firms’ Own Activity Outlook slipped to 38.7 from 40.6. Sector pressures also persisted, with reported employment in construction falling sharply.
Inflation indicators eased further. The share of firms expecting to raise prices in the next three months fell to 43%, while cost expectations edged down to 74%. One-year inflation expectations also dipped to 2.63% from 2.68%. Wage growth expectations 12 months out softened to 2.4% from 2.5%.
ANZ said the survey aligns with the RBNZ’s updated view that the economy requires “a little more support” to ward off downside risks. While confidence is stabilizing, the recovery will unfortunately "not come soon enough for some".
USD/CHF Mid-Day Outlook
Daily Pivots: (S1) 0.8001; (P) 0.8038; (R1) 0.8061; More….
Intraday bias in USD/CHF is back on the downside with breach of 0.7999 temporary low. Fall from 0.8170 is resuming, and should target 0.7910 support first. Break there will bring retest of 0.7871 low. On the upside, however, break of 0.8073 will turn bias to the upside for 0.8103. Further break there will resume the rebound from 0.7871 through 0.8170 resistance.
In the bigger picture, long term down trend from 1.0342 (2017 high) is still in progress. Next target is 100% projection of 1.0146 (2022 high) to 0.8332 from 0.9200 at 0.7382. In any case, outlook will stay bearish as long as 0.8475 resistance holds.
US initial jobless claims fall to 229k vs exp 231k
US initial jobless claims fell -5k to 229k in the week ending August 23, below expectation of 231k. Four-week moving average of initial claims rose 2.5k to 228.5.
Continuing claims fell -7k to 1954k in the week ending August 16. Four-week moving average of continuing claims rose 4.5k to 1956k.