Sample Category Title
ECB sees case for another cut but greater value in waiting for September
ECB’s July meeting accounts highlighted that, while current conditions remain consistent with another rate cut, policymakers see a “high option value” in waiting until September.
Rates were judged to be in “broadly neutral territory” after eight cuts in nine meetings, financial conditions remained stable, and inflation was viewed as “in a good place” relative to the medium-term target.
The minutes stressed that uncertainty—ranging from trade disputes to geopolitical risks—warrants patience. Holding policy steady provides time to evaluate the impact of earlier cuts and to monitor data on manufacturing, services inflation, exchange rates, and financial markets, as well as the outcome of trade negotiations.
September was singled out as the point when fresh staff projections and new data would give a clearer reading of the economy’s underlying direction. Policymakers highlighted that this would help to resolve “counteracting forces” currently obscuring the signals.
While some argued for "a further rate cut" given "increasing downside risks to output and inflation", the dominant view favored patience. By waiting until September, the ECB preserves flexibility and ensures any further move is better informed by the latest evidence.
(ECB) Monetary policy accounts
Account of the monetary policy meeting of the Governing Council of the European Central Bank held in Frankfurt am Main on Wednesday and Thursday, 23-24 July 2025
28 August 2025
1. Review of financial, economic and monetary developments and policy options
Financial market developments
Ms Schnabel started her presentation by noting that financial markets had reverted to a low-volatility, “risk-on” regime, leaving the turbulence of April 2025 behind despite further tariff-related headlines. Market volatility had receded after the short-lived spike due to tensions in the Middle East, with tariff announcements by the US Administration having recently lost traction as drivers of asset price dynamics and risk assets having rallied globally since the Governing Council’s last monetary policy meeting on 4-5 June. Meanwhile, the euro area economy appeared to be more resilient to rising tariffs and elevated trade uncertainty than anticipated. Despite a further appreciation of the euro, driven to a large extent by the reassessment of relative economic activity between the euro area and the United States, market-based inflation compensation had edged up further and the ECB forward interest rate curve had shifted higher.
In the United States, a decoupling of market volatility from economic policy uncertainty had been observed, even more than during Mr Trump’s first presidential term. Markets were increasingly “looking through” tariff announcements. One explanation as to why they were taking a more benign view of tariff threats and elevated uncertainty lay in the fact that in the euro area, and lately also in the United States, macroeconomic data had surprised on the upside, indicating that the economy was more resilient than initially expected. Euro area GDP growth forecasts had held up well over recent months. Some private sector forecasts for euro area real GDP growth in 2025 and 2026 stood near the levels that had prevailed ahead of the initial US tariff announcements in April and continued to point to a gradual recovery, with growth expected to gain further momentum in 2027. For the United States, by contrast, growth forecasts from these surveys had been significantly downgraded for 2025 and 2026, and stood well below 2024 levels.
The reassessment of relative growth expectations between the euro area and the United States was also evident in equity markets. The US S&P 500 index had reversed part of its recent underperformance, while remaining for the year to date well below the euro area benchmark index, and especially the German DAX which had been boosted by the country’s fiscal package. Stocks of smaller US firms had only just returned to the level reached at the start of the year and had significantly underperformed their counterparts in the euro area
The reassessment of the euro area growth outlook had also led to a reappraisal of market-based inflation compensation. Investors had revised up their 2025 and 2026 forecasts for inflation as measured by the Harmonised Index of Consumer Prices (HICP) excluding tobacco relative to expectations at the time of the Governing Council’s previous monetary policy meeting. Inflation fixings stood at their highest level since March for most of 2026, well above the levels seen at the time of the April and June monetary policy meetings. For 2025, they stood below March levels, owing to lower energy prices. Both growth and inflation expectations were thus currently back to, or even above, pre-April levels. While the euro’s appreciation had dampened inflation expectations, this effect had been more than offset by a recovery in energy prices.
Ms Schnabel then reviewed recent EUR/USD exchange rate developments. Since the Governing Council’s meeting on 3-5 June the euro had continued to appreciate against the US dollar, a trend that had begun with the announcement of the German fiscal package in early March. The euro was currently trading close to its average of USD 1.18 over the period since its inception in 1999, and around 4% above its average of USD 1.12 over the past decade. The key driver behind the euro’s recent appreciation against the US dollar been a positive relative demand shock, as reflected in the upward revisions to the euro area’s economic outlook relative to the US outlook, suggesting a relatively small pass-through of the exchange rate to inflation. Over the past few months there had been a rise in demand for protection against euro strength or US dollar weakness, particularly from euro area investors seeking to hedge their US dollar exposures amid perceived risks of a further depreciation of the US dollar.
The combination of a resilient economy, higher market-based inflation expectations and ECB communication that it was “in a good place” had led to a reassessment of the expected monetary policy path of the ECB, and the overnight index swap forward curve had shifted up. Markets were pricing in one further 25 basis point cut in policy rates by the end of 2025, with the forward curve starting to rise again in the second half of 2026. Market expectations for 2025 stood above median expectations reported in the Survey of Monetary Analysts.
Global investors had continued to take a positive view of euro area sovereign bond markets. Euro area sovereign spreads over German Bunds, which had narrowed in the wake of the threat of higher tariffs, had remained broadly unchanged at low levels since the last monetary policy meeting. Over recent weeks the focus in sovereign bond markets had shifted to the very long end of the curve. In the United States, the United Kingdom and Japan, 30-year bond yields, which were particularly sensitive to debt sustainability risks, had been on a persistent upward path since late 2022. Euro area yields had remained comparatively stable and close to their average level since the end of 2022. One key factor insulating euro area long-term yields from global upward pressures was the region’s stronger fiscal position relative to other economies.
The reassessment of relative growth prospects as well as broader concerns about the United States and its fiscal trajectory had led to incipient signs of a rebalancing in global investment flows. Non-US-domiciled investment funds, which had been steadily acquiring US equities throughout 2024, had sharply reduced their purchases as of April 2025. Moreover, foreign investors had shifted into the euro area at a stronger than average pace.
Rising risk appetite globally had benefited corporate bond markets, with corporate bond spreads narrowing across market segments and regions. Empirical analysis indicated that the surge in euro-denominated issuance by US firms was linked to rising US economic policy uncertainty. At the same time, relative yields had continued to play an important role in investors’ reallocation of funds into different global sovereign bond markets, benefiting euro area government bonds. However, structural challenges continued to weigh on the euro area’s attractiveness as its government bond markets lacked the depth and liquidity of the US Treasury market.
Finally, regarding recent developments in money markets, since 2022 excess liquidity had been gradually reduced to around €2.6 trillion. As excess liquidity, but also collateral scarcity, had declined, money market rates had started to edge higher. While the euro short-term rate remained below the deposit facility rate, the gap had narrowed. Repo rates were trading very closely around the deposit facility rate for both general and non-general collateral.
The global environment and economic and monetary developments in the euro area
Starting with inflation developments in the euro area, Mr Lane noted that inflation was currently at the Governing Council’s 2% medium-term target. It had edged up to 2.0% in June from 1.9% in May, mainly on account of a rise in energy inflation to -2.6% from -3.6%. Food inflation had eased slightly, to 3.1% from 3.2%. Core inflation (HICP inflation excluding energy and food) had been unchanged at 2.3% in June, since a 0.1 percentage point increase in services inflation to 3.3% had been broadly offset by a 0.1 percentage point decline in goods inflation to 0.5%.
Indicators of underlying inflation were consistent overall with the 2% medium-term target. Growth in compensation per employee had fallen further in the first quarter of the year, to 3.8%, from 4.1% in the last quarter of 2024. Combined with stronger productivity growth, this had resulted in slower growth in unit labour costs. In line with the June 2025 Eurosystem staff macroeconomic projections for the euro area, the ECB wage tracker pointed to lower wage growth in the coming quarters, while survey-based expectations of firms, consumers and professional forecasters all pointed to further declines also in 2026. In turn, the deceleration of wage growth would support the deceleration of services inflation.
Taking into account recent energy futures prices, headline inflation was expected to fluctuate around its current level for the remainder of 2025, before reaching a trough of around 1.5% in the first quarter of 2026. Relative to the June baseline projection, this implied a slightly smaller near-term shortfall from the inflation target owing to the upward movement in energy prices. According to the July round of the Survey of Monetary Analysts and the latest round of the Survey of Professional Forecasters, expectations regarding headline inflation were broadly in line with the June staff projections, except that these surveys pointed to a milder inflation undershoot of between 0.1 and 0.2 percentage points below target in 2026. That was less than the 0.4 percentage point undershoot foreseen in the June projections. Short-term consumer inflation expectations had declined in both May and June according to the Consumer Expectations Survey, reversing the uptick observed in previous months. There had also been a decline in the short-term inflation expectations of firms reported in the latest survey on the access to finance of enterprises. Most measures of longer-term inflation expectations continued to stand at around 2%, supporting the stabilisation of inflation around the Governing Council’s target. But market-based measures of inflation compensation indicated an inflation path below 2% over the next four years.
With respect to the external environment, the global composite Purchasing Manager’s Index (PMI) excluding the euro area had edged down on average in the second quarter, to 51.4, from 52.0 in the first quarter, reflecting declines in both manufacturing and services. Incoming data suggested a reduction in global import growth in the second quarter after the substantial frontloading observed in the first quarter in anticipation of higher tariffs. Although higher tariff rates had the potential to reshape global trade flows and might pose challenges for logistics, global supply chain pressures remained contained according to the available data and to participants in the latest Corporate Telephone Survey.
The euro had appreciated against the US dollar by 2.5% since the June Governing Council meeting and by 4.0% since the cut-off date for the June Eurosystem staff projections. In nominal effective terms, it had appreciated by 1.9% since the June Governing Council meeting and by 2.6% since the June projections. Brent crude oil prices had increased by 6% since the June Governing Council meeting and had experienced pronounced volatility linked to tensions in the Middle East. Compared with the levels at the time of the June Governing Council meeting, oil futures prices had increased over the full projection horizon, especially at the front end of the curve. Compared with the June projections, the futures curve stood 5% higher by the end of 2026 and 3% higher at the end of 2027. By contrast, European gas prices stood 6% lower than at the time of the June projections, but gas futures were slightly higher in 2027.
Partly reflecting the Governing Council’s past interest rate cuts, the euro area economy had so far been resilient overall in a challenging global environment. In the first quarter of 2025 the economy had grown by more than expected. This had been supported by a frontloading of exports ahead of expected tariff hikes, especially in the Irish pharmaceutical sector. Private consumption and investment had also made a positive contribution to growth, while inventories had made a negative contribution.
There were signs that some manufacturing subsectors were continuing to frontload activity following the postponement of US tariff decisions. The manufacturing output PMI for the euro area had increased on average in the second quarter, to 51.3, from 48.8 in the first quarter, signalling a quarterly expansion for the first time in three years. But forward-looking PMIs for new orders and new export orders for the manufacturing sector suggested only a stabilisation in the level of activity rather than a substantial expansion. The services PMI and the composite output PMI pointed to a modest pace of growth. Overall, and as expected, incoming information continued to suggest a moderation in economic activity as uncertainty remained elevated. Although the latest data had shown some improvement from the April dip, the still subdued level of consumer confidence was likely to hold back private consumption expenditure in the short term. Higher actual and expected tariffs, the stronger euro and persistent geopolitical uncertainty were also making firms more hesitant to invest.
At the same time, prospects for domestic demand continued to be supported by a number of factors. Easier financing conditions were underpinning both housing and business investment. Consumption continued to benefit from rising real incomes, solid private sector balance sheets and the robust labour market. Over a longer horizon higher public investment in defence and infrastructure should also support growth.
The unemployment rate had remained little changed over the past year and had stood at 6.3% in May. Employment had grown by 0.2% in the first quarter, up from 0.1% in the fourth quarter of 2024. As real GDP growth had picked up relative to employment growth, productivity had improved, both per hour and per worker. At the same time, employment PMIs remained subdued and job postings had declined, pointing to a continued gradual softening in demand for labour.
As regards trade, the recent appreciation of the euro was weighing on the competitiveness of euro area firms, both in terms of exporting and in terms of matching cheaper imports in the domestic market. China’s price competitiveness had improved further and imports from China had grown significantly since the start of the year. This suggested some diversion of trade to the euro area, as also indicated by corporate contacts, but might in addition reflect the sourcing of intermediate inputs to frontload euro area exports.
Risks to economic growth remained tilted to the downside. Among the main risks were a further escalation in global trade tensions and associated uncertainties, which could dampen exports and drag down investment and consumption. A deterioration in financial market sentiment could lead to tighter financing conditions and greater risk aversion, and make firms and households less willing to invest and consume. Geopolitical tensions, such as Russia’s unjustified war against Ukraine and the tragic conflict in the Middle East, remained a major source of uncertainty. By contrast, if trade and geopolitical tensions were resolved swiftly, this could lift sentiment and spur activity. Higher defence and infrastructure spending, together with productivity-enhancing reforms, would add to growth. An improvement in business confidence would also stimulate private investment.
The outlook for inflation was more uncertain than usual, as a result of the volatile global trade policy environment. A stronger euro could bring inflation down further than expected. Moreover, inflation could turn out to be lower if higher tariffs led to lower demand for euro area exports and induced countries with overcapacity to re-route their exports to the euro area. Trade tensions could lead to greater volatility and risk aversion in financial markets, which would weigh on domestic demand and would thereby also lower inflation. By contrast, inflation could turn out to be higher if a fragmentation of global supply chains pushed up import prices and added to capacity constraints in the domestic economy. A boost in defence and infrastructure spending could also raise inflation over the medium term. Extreme weather events, and the unfolding climate crisis more broadly, could drive up food prices by more than expected.
Since the Governing Council’s previous meeting, financial markets had experienced some volatility amid a temporary escalation of geopolitical tensions and ongoing trade uncertainty. Market interest rates had increased since the previous meeting, especially for longer maturities. At the same time, the Governing Council’s past interest rate cuts continued to make corporate borrowing less expensive. The average interest rate on new loans to firms had declined to 3.7% in May, from 3.8% in April. The cost of issuing market-based debt had also come down, falling to 3.6% in May. The average interest rate on new mortgages had barely changed since the start of the year and had stood at 3.3% in May.
Credit dynamics remained subdued overall. The growth rate of loans to firms had moderated to 2.5% in May. However, corporate bond issuance was stronger, growing at a rate of 3.4% in annual terms. According to the latest bank lending survey for the euro area, firms’ demand for loans remained weak overall against the backdrop of global uncertainty and trade tensions, despite a slight pick-up owing to lower interest rates. The picture of a broadly unchanged supply of credit to firms and overall weak loan demand reported by banks in the bank lending survey was broadly consistent with the developments reported by firms in the latest survey on the access to finance of enterprises. Subdued loan demand also fitted with the “wait-and-see” approach to investment reported by firms in the Corporate Telephone Survey. Growth in mortgage lending had, however, edged up to 2.0% in May, from 1.9% in April, amid a strong increase in demand.
According to the bank lending survey, credit standards for business loans had been broadly unchanged in the second quarter, following two consecutive quarters of tightening. While banks’ concerns about the economic risks faced by their customers had had a tightening impact on credit standards, this had been broadly offset by stronger competition among lenders. Credit standards for mortgages had tightened slightly in the second quarter.
Monetary policy considerations and policy options
In summary, the incoming economic and financial information was broadly in line with the Governing Council’s previous assessment of the inflation outlook and the risk profile was similar to the profile that had prevailed ahead of the previous meeting. Under current conditions, there was a high option value to waiting for additional information to support this assessment. In particular, the outcomes of ongoing trade negotiations – which were a major source of uncertainty clouding the outlook – might become clearer over the coming weeks and months.
Based on this assessment, Mr Lane proposed that the three key ECB interest rates be kept unchanged. In line with the updated monetary policy strategy statement, Mr Lane proposed that the formulation of the reaction function be adjusted as follows: “Our interest rate decisions will be based on our assessment of the inflation outlook and the risks surrounding it, in light of the incoming economic and financial data, as well as the dynamics of underlying inflation and the strength of monetary policy transmission”.
2. Governing Council’s discussion and monetary policy decisions
Economic, monetary and financial analyses
Regarding global conditions, the world economy had been more resilient in the first quarter of 2025 than foreseen in the June Eurosystem staff projections, in terms of both overall economic activity and trade performance. In the United States, the expected slowdown had not yet materialised, while the labour market appeared to remain solid. In China, economic growth had also remained resilient, with the second quarter outcome being above projections. Major global stock markets were near record highs, partly on the back of better than expected earnings. Nonetheless, global GDP growth and trade were still expected to decelerate in 2025 compared with 2024. Furthermore, for the United States and China, available economic forecasts for 2025 and 2026 were still weaker than forecasts produced before the intensification of trade tensions in April. There were indications that global economic activity and trade had slowed in the second quarter of 2025, as had been expected. A key issue in the discussion was to what extent the apparent resilience in the first quarter of 2025 represented a frontloading of activity and trade before the threatened imposition of tariffs in April, or whether the impact of tariffs and uncertainty could have been smaller than previously thought.
With regard to the possible outcome of the ongoing trade negotiations with the United States, there was a general perception that, first, uncertainty remained very high and, second, the effective level of tariffs for the euro area was probably going to be higher than assumed in the baseline scenario of the June staff macroeconomic projections but not as high as in the severe scenario. It was commented that markets appeared to be reacting less to tariff news, especially when compared with developments in April. It was not clear whether market participants were looking through “noise” in trade-related announcements and waiting for actual decisions, whether they saw greater resilience in the global economy, or whether they considered the likely effects of the tariffs currently under discussion to be more moderate than previously assessed. However, the view was also expressed that markets might be complacent and might have a more adverse reaction once negotiations concluded, particularly if the outcome was worse than initially expected. Regarding the possible impact on inflation in the global economy and in the euro area economy, one question was whether any such impact would take the form of one-off price level effects or ongoing inflationary effects. In the current environment of relatively weak aggregate demand and modest underlying price pressures, the former was perhaps more likely than the latter. However, it was also argued that greater trade fragmentation might entail more pervasive and longer-lasting cost pressures on the supply side, posing upside risks to inflation, despite only limited evidence to date of acute bottlenecks in supply chains.
It was considered that regardless of the outcome of trade negotiations between the EU and US authorities, the reaction of Chinese exporters to US tariffs imposed on them would have important implications globally and for the euro area. Indeed, some effects were already visible. These included an increase in the volume of Chinese exports to the EU (as well as to other Asian economies) and a decrease in their average prices. This type of dynamics would make the life of EU producers harder, because they would face increased competition just when they might want to compensate for possible lost US sales by redirecting sales to other EU countries or to non-EU countries. At the same time, it was noted that the observed increase in imports from China was concentrated in intermediate goods, perhaps reflecting the frontloading of activity. This could point to a more benign situation, as it could boost the competitiveness of European firms (and also attenuate possible price pressures for non-energy industrial goods). The impact on inflation depended on whether these decreases in the cost of these imports were passed on to prices or not.
With regard to the possible impact of exchange rates on activity and prices, it was argued that bilateral exchange rates (particularly the EUR/USD exchange rate) and broader weighted indices provided different pictures regarding the extent of the most recent appreciation of the euro. The nominal effective exchange rate against a broad index of 41 currencies was now at its highest level in the history of the euro. Against the US dollar, the euro was above the average levels over the last decade, even though it was roughly at the mean level since its inception. The recent appreciation against the US dollar had in any case been greater than the appreciation of the nominal effective rate. At the same time, it was underlined that the impact of exchange rates on output and inflation depended on the nature and duration of the underlying shocks and drivers. The currency of a country imposing tariffs would normally be expected to appreciate, but other factors could work in the opposite direction, including changes in relative demand, fiscal and monetary policies, and risk and market sentiment.
In this respect, reference was made to models suggesting that relative demand effects had contributed to the appreciation of the euro against the US dollar, although it was mainly due to US dollar weakness. It was argued that the pass-through to consumer prices was likely to be limited as the dampening effect from lower import prices might be partly offset by stronger price pressures from rising domestic demand. The previously high correlation between the nominal effective exchange rate of the euro and the EUR/USD exchange rate had diminished over the past decade, primarily as a result of the weakness of Asian currencies despite the recent rapid economic growth of Asia. However, exchange rate developments over recent months were also seen to have a structural dimension and to be unlikely to reverse in the near term.
There was considerable discussion on the role of uncertainty, which remained very high, related both to trade policy and geopolitics. It was noted that, although measures of policy uncertainty remained high, measures of market volatility appeared contained. On the one hand, this disconnect suggested that uncertainty might not have such a negative impact as previously thought. This was supported by some market analysis and by the observed resilience of the global economy and the euro area economy. In addition, risk and uncertainty might not prove to be as protracted and detrimental as estimated in the adverse trade scenario in the June projections. On the other hand, there was a concern that uncertainty was exerting an insidious and lasting impact, as firms and consumers were likely to delay investment and consumption decisions while they remained in a wait-and-see mode, as firms reported in the Corporate Telephone Survey. Ultimately, members felt that uncertainty (related both to trade and to geopolitical developments) would remain a key feature of the global and euro area economic outlook for some time to come.
With regard to euro area economic activity, members broadly agreed with the assessment by Mr Lane. While data for the first quarter of 2025 had been a positive surprise, the overall picture from the June 2025 staff projections likely remained broadly valid. The prediction embedded in the June projections was that economic activity in the euro area at the beginning of the year had likely been supported by frontloading of activity and trade before the expected imposition of tariffs but that economic growth would decelerate measurably around the middle of 2025. It was observed that the strong first quarter outcome did not alter the underlying fundamentals, which pointed to ongoing but fragile economic growth. At the same time, it was argued that frontloading could not fully explain the pick-up in growth. The composition of GDP growth in the first quarter showed that both consumption and investment had made a significant contribution, which suggested a pick-up in economic momentum over and above the frontloading of exports. Moreover, future output expectations should be measurably weaker if frontloading were the sole driver.
The latest data appeared to be confirming that the broad outlook contained in the June 2025 projections largely held up. PMI data for June (and the July data released on Thursday, 24 July), while above the threshold of 50 and thus suggesting expansion, were still at a relatively modest and subdued level from a historical perspective. Estimates of euro area real GDP growth in the second quarter of 2025, including from surveys, suggested broadly stable activity with practically no growth. Forecasts for the third quarter were slightly more positive, but were also subdued. It was noted that the current constellation of strong hard data (for the first quarter) and weaker soft data (for the second and third quarters) was particularly challenging to assess. In this respect, it was argued that soft data suggested a more benign situation than at the time of the June Governing Council meeting. Sentiment among firms had improved in June, with a measurable rise in expectations regarding future output. In the manufacturing sector in particular, the forward-looking PMI for business expectations was rising and stood at a three-year high. Moreover, industrial production had bounced back strongly in May and its level in the second quarter was so far higher than the level in the first quarter when excluding construction.
In line with expectations, private consumption had made a further positive contribution to euro area economic growth in the first quarter and was expected to continue doing so. However, this contribution had been relatively modest, with the underlying determinants providing little support to the expectation of a significant acceleration in consumption growth. In particular, consumer uncertainty had eased but remained relatively elevated. Similarly, consumer confidence, while having improved since April, remained relatively weak. Compensation of employees continued to grow, but the rate of growth had slowed. Thus, any acceleration in consumption growth was seen to require some decline in the savings rate, which in fact had increased in the first quarter of 2025. Overall, the ongoing growth in labour incomes and the impact of past policy rate cuts were seen as providing a supportive backdrop and gave grounds for confidence in the expected positive contribution from private consumption in the period ahead.
Both housing and business investment had surprised significantly to the upside in the first quarter of 2025, compared with the June projections, but investment growth in the rest of 2025 was seen as more modest. In the Corporate Telephone Survey, companies had reported that elevated trade uncertainties had prompted them to adopt a wait-and-see attitude in relation to capital formation. Nonetheless, the “accelerator” mechanism should eventually support business investment, as the economy was growing. The housing market appeared to have turned the corner, and housing investment had risen robustly in the first quarter, by 0.7%, quarter on quarter. The increase in total construction investment was similarly strong, benefiting from infrastructure investment. Yet, indications from the European Commission and PMI surveys had been relatively weak towards the end of the second quarter. Overall, housing investment was on an upward path and considered likely to make a moderate contribution to economic growth over the remainder of 2025. Meanwhile, the PMIs for capital goods had improved strongly, moving into expansionary territory.
Exports had grown relatively strongly in the first three months of 2025, but data for April and May suggested a sharp slowdown. Furthermore, much of the absolute increase in euro area exports to the United States in March had come from Ireland, in particular the pharmaceutical sector. Regarding standard indices of supply chain pressures, there had been some increase in the first half of 2025, but index levels remained well below previous highs observed in 2020-22.
Members observed that euro area labour markets remained resilient. In May the unemployment rate had stood near its all-time low and employment had continued to grow. Unemployment expectations of households remained low, supporting consumption. Nonetheless, there were some signs of a weakening, with a noticeable decrease in vacancies and the PMI composite employment index hovering around the threshold level of 50, indicating no change. Data on labour market inflows and outflows also argued for some caution in the assessment of prevailing labour market conditions.
With regard to fiscal and structural policies, members felt that, more than ever in the present environment, it was crucial to urgently strengthen the euro area and its economy. Fiscal and structural policies should make the economy more productive, competitive and resilient. Governments should prioritise growth-enhancing structural reforms and strategic investment, while ensuring sustainable public finances. It was important to complete the savings and investments union and the banking union, following a clear and ambitious timetable, and to rapidly establish the legislative framework for the potential introduction of a digital euro. Members welcomed the Eurogroup’s commitment to improve the effectiveness, quality and composition of public spending and supported the efforts by European authorities to preserve the mutual benefits of global trade. However, there was some concern that national governments and EU authorities were not conveying sufficient urgency and ambition, just when both were required more than ever.
On the fiscal outlook, members noted that planned increases in defence spending across many economies, as well as wider spending plans in the euro area’s largest economy specifically, would provide support to economic activity. However, this would likely materialise primarily in 2026 or later, and some other euro area economies would likely face a tighter fiscal situation. At the same time, reference was made to signs of growing momentum in the largest economy, with recent announcements of private as well as public investment plans. The fiscal stimulus in that economy appeared to be coming earlier than expected, triggering additional private investment. Conversely, provisional announcements for the euro area’s second-largest economy suggested a tightening of the fiscal stance, particularly for 2026. The concern was raised that some analyses suggested that fiscal expansions financed by structurally higher levels of debt could give rise to a more inflationary environment.
Against this background, members considered that the risks to economic growth remained tilted to the downside. Among the main risks were a further escalation in global trade tensions and associated uncertainties, which could dampen exports and drag down investment and consumption. A deterioration in financial market sentiment could lead to tighter financing conditions and greater risk aversion, making firms and households less willing to invest and consume. Geopolitical tensions, such as Russia’s unjustified war against Ukraine and the tragic conflict in the Middle East, remained a major source of uncertainty. By contrast, if trade and geopolitical tensions were resolved swiftly, this could lift sentiment and spur activity. Higher defence and infrastructure spending, together with productivity-enhancing reforms, would add to growth. An improvement in business confidence would also stimulate private investment.
In this context, it was considered that, while the risks to the near-term outlook may have shifted to the upside on the back of strong first quarter data, to the extent that this represented stronger than anticipated frontloading, the risks for 2026 could have tilted further downwards, as lower quarter-on-quarter growth in the remaining quarters of 2025 would affect the 2026 outcome. Regarding 2025, it was underlined that the strong growth recorded in the first quarter of 2025 implied an “acquired growth” of 1.1% for 2025 as a whole (assuming zero growth in the remaining quarters), compared with 0.9% foreseen in the June projections.
With regard to price developments, members widely shared the overall assessment that inflation had been evolving broadly as expected. Headline inflation had stood at 2.0% in June, and measures of underlying inflation had been moving closer to 2%. The increase in energy prices since the last meeting (partly attenuated by the stronger euro) had reduced the extent of the temporary undershoot of inflation relative to target expected for 2026. Next year inflation was expected to be 1.8% according to the results of the Survey of Professional Forecasters and market pricing, and to be 1.9% according to the results of the Survey of Monetary Analysts. Overall, the evolution of headline inflation, as well as its main components, was considered broadly reassuring. At the same time, domestic inflation, and services inflation in particular, remained elevated, with the projected sharp decline predicated on the materialisation of further wage moderation. Moreover, when including owner-occupied housing, inflation was currently around 0.2 percentage points higher.
Among the main components, non-energy industrial goods inflation continued to be stable at a moderate rate. Two main factors were expected to maintain this moderation. First, the euro appreciation would continue to have an attenuating impact on import prices. Second, increased import penetration from China had also been having a dampening effect. At the same time, the possibility of fragmenting supply chains was seen as a possible upward force, although this was not very visible in the current data. Nonetheless, it was felt that supply-side effects – especially potential supply chain disruptions, as observed for rare earths, and cost-push shocks rippling through global value chains –warranted more consideration in the staff scenario analysis of the impact on inflation of tariffs and other trade restrictions.
Regarding food prices, international commodity prices had fallen back from the high levels observed for much of the past 12 months. Food prices nevertheless remained a risk factor, particularly in view of the extreme weather events witnessed in many parts of Europe. Services inflation had continued to show signs of moderation in line with expectations. Services inflation momentum remained high at around 4%, but over the coming months it was expected to record a further substantial moderation, in part reflecting easing wage growth.
Market and survey-based measures of longer-term inflation expectations were generally seen as anchored around the 2% target. Furthermore, according to the Consumer Expectations Survey, consumers’ shorter-term (one-year ahead) inflation expectations in May and June 2025 had reversed the increases observed in March and April. Firms’ inflation expectations for the same period – most notably those of large firms – had also decreased in June.
Regarding wages, members considered that the latest available information from wage negotiations and survey data had given them confidence that the ongoing moderation in wage growth was on track. The growth rate of compensation per employee, while having surprised on the upside, had fallen to 3.8% in the first quarter of 2025, down from 4.1% in the final quarter of 2024. Moreover, the latest data both from the ECB wage tracker and on negotiated wages pointed to a significant moderation in wage growth during the second half of the year and average wage growth in 2025 substantially below the 2024 level. Comfort was taken from the fact that this assessment was supported by data from a range of surveys. At the same time, the recent Corporate Telephone Survey results suggested somewhat higher wage growth than in the previous round. It was also noted that the information content of the wage tracker for later periods was rather limited. In addition, a further decline in unit labour costs, following the drop registered in the first quarter, remained predicated on a rebound in productivity and no lasting deterioration in the supply side of the economy, including from trade fragmentation.
Turning to the risk assessment, members considered that the outlook for inflation had been more uncertain than usual, as a result of the volatile global trade policy environment. On the downside, a stronger euro could bring inflation down further than expected. Moreover, inflation could turn out to be lower if higher tariffs led to lower demand for euro area exports and prompted countries with excess capacity to re-route their exports to the euro area. Trade tensions could lead to greater volatility and risk aversion in financial markets, which would weigh on domestic demand and thereby also lower inflation. By contrast, on the upside, inflation could turn out to be higher if a fragmentation of global supply chains pushed up import prices and added to capacity constraints in the domestic economy. A boost in defence and infrastructure spending could also raise inflation over the medium term. Extreme weather events, and the unfolding climate crisis more broadly, could drive up food prices by more than expected. In this context, the ongoing trade tensions and the possibility of countermeasures by EU authorities were seen as entailing an upside risk to inflation.
With regard to the monetary and financial analysis, market interest rates – especially for longer maturities – had increased since the Governing Council’s 4-5 June monetary policy meeting. Market participants had attached almost no probability to a cut at the present meeting but were fully pricing in one further 25 basis point cut by the end of the year. Option prices implied a lower likelihood of bigger cuts than at the time of the June meeting. While longer-term yields had gone up recently, they had not increased relative to pre-April levels, in contrast to those in other major economies. This could partly be attributed to safe-haven flows into the euro area, which had generated a loosening of financial conditions that had helped to counteract the tightening caused by the appreciation of the euro exchange rate. Indeed, standard indices implied that financial conditions were quite loose compared with their level at the beginning of 2022. Meanwhile, euro area long-term yields had increased notably since the start of the year, despite the 100 basis point decline in the deposit facility rate since then.
Wider financial markets appeared quite sanguine with respect to the future. Major global stock markets had recovered since the troughs seen at the beginning of April and now stood near record highs. These developments could be linked to perceptions that the world economy was stronger than previously forecast and to better than expected earnings and earnings expectations. Euro area financial markets had also continued to function well, despite temporary volatility.
Financial markets were seen to be pricing in a benign trade scenario, and market participants could potentially have become over-optimistic as they were now more accustomed to negative news and trade policy uncertainty from the United States. In particular, risk asset prices had been largely unaffected by the latest tariff news. There was also a disconnect between the relative calmness of financial markets and global trade uncertainty. This could be a cause for concern, as it might increase the risk of market disruptions in the future. Even though economies had held up fairly well so far in the face of trade tensions, this might not continue. It was also argued that the limited market reaction to recent trade news could be because the impact of tariffs and the effect of the associated uncertainty might be less than thought and smaller than reflected in standard models.
As for debt financing conditions, the transmission of past interest rate cuts was continuing to make corporate borrowing less expensive for both bond and loan financing. The cost of issuing market-based debt had also come down. By contrast, the average interest rate on new mortgages had barely changed since the start of the year. At the same time, the growth rate of bank loans to firms had moderated to 2.5%, although corporate bond issuance was stronger, growing at a rate of 3.4% in annual terms. For its part, growth in mortgage lending had edged up to 2.0% in May.
According to the latest bank lending survey for the euro area, credit standards for business loans were broadly unchanged in the second quarter. This was because stronger competition among lenders had broadly offset the tightening related to banks’ concerns about the economic risks faced by their customers. Credit standards for mortgage lending had tightened slightly. It was seen as encouraging that there had only been a marginal tightening in overall credit standards in the recent period, despite the volatile macroeconomic environment. Firms’ demand for credit had increased slightly in the second quarter, while there had been a strong increase in demand for mortgages. Lower interest rates had been a supporting factor, especially for households’ mortgages, but global uncertainty and trade tensions had exerted a dampening effect on firms’ demand for credit.
Monetary policy stance and policy considerations
Turning to the monetary policy stance, members assessed the data that had become available since the last monetary policy meeting in accordance with the three main elements that the Governing Council had communicated in 2023 as shaping its reaction function. These were (i) the implications of the incoming economic and financial data for the inflation outlook, (ii) the dynamics of underlying inflation, and (iii) the strength of monetary policy transmission.
Starting with the inflation outlook, members welcomed the fact that headline inflation was currently at the 2% medium-term target and judged that the incoming information was broadly in line with their previous assessment of the inflation outlook. The picture from the June staff baseline projections had not changed materially. In fact, recent data had generally validated the baseline scenario, as had been the case for at least the past year, and inflation was expected to be at target in the medium term despite continued and historically high uncertainty regarding the outlook owing to the volatile global trade policy environment. Market and survey-based inflation expectations were also well anchored and consistent with the central outlook.
Against this background, most members viewed the risks surrounding the inflation outlook as broadly balanced. It was noted that the recent resilience of the euro area economy observed in the data had already been largely embedded in the baseline outlook in the June projections, which had been broadly corroborated.
Several members viewed inflation risks as tilted to the downside relative to the June staff projections, at least for the next two years. The likely outcome to trade negotiations seemed set to be worse than the 10% tariff scenario assumed in the June baseline, although it would probably be better than the severe scenario published in June. In addition, if tariffs were at least 15% globally, and significantly higher for some countries, such a big increase could lead to a significant slowdown in the world economy, which might, in turn, exert downward pressure on energy prices. More generally, there could be additional downward pressure on inflation resulting from countries with overcapacity re-routing their exports to the euro area. Moreover, a stronger euro could bring inflation down further than expected. In this context, it was noted that inflation had already been projected in June to remain persistently below target for several consecutive quarters. Market-based inflation compensation also indicated that inflation in 2026, at 1.8%, would be below 2%, and that it might remain slightly below target over the medium term. It was important to keep in mind that both the staff projections and market expectations for inflation undershooting were based on a market interest rate curve that still implied one further interest rate cut.
A few members judged risks to be tilted to the upside relative to the June staff projections, especially over the medium term. While headline inflation was at target, this was partly due to volatile developments in energy prices and the exchange rate, which could easily reverse. Moreover, even though services inflation and its momentum were projected to decline sharply, they currently remained high. It was contended that the economy was proving more resilient than had been expected, which made a sustained undershooting of inflation increasingly unlikely. Therefore, an excessive focus on undershooting the inflation target seemed misguided. The increase in oil prices since the June meeting had offset some of the deflationary effects from the appreciation of the euro and had made the expected inflation undershoot in 2026 shallower, while the recent heat waves in Europe could exert upward pressure on food prices. Indeed, median expectations for inflation in 2026 – according to market pricing and surveys of market participants – were only marginally below 2% and well above the June staff projection, with the balance of risks in the Survey of Monetary Analysts and the Survey of Professional Forecasters also seen as tilted to the upside for the later years of the horizon. The staff baseline projections might also be underestimating the inflationary impact of trade policy adjustments. The potential for supply chain disruptions, as already observed for rare earth elements, and a strategic reorientation by firms owing to trade tensions remained a concern. Even though there had not been widespread signs of such disruptions so far, past experience suggested that disruptions or higher costs could ripple through global value chains and affect inflation more broadly. Over the medium term, a boost in defence and infrastructure spending in the euro area could also result in higher inflation. Moreover, it was argued that the projections could be underestimating the inflationary effects of the global fiscal expansion. Finally, a more fragmented global economy and growing labour scarcity owing to demographic change also posed upside risks to inflation over the medium term.
Turning to underlying inflation, members concurred that measures were generally consistent with the 2% medium-term target. At 2.3%, core inflation was at its lowest in over three years, and it was expected to fall further to 2% by early next year. Domestic price pressures had continued to ease, with year-on-year growth in compensation per employee slowing in the first quarter, even though it had surprised on the upside. Still, combined with stronger productivity growth, this had led to slower growth in unit labour costs. Forward-looking indicators, including the ECB wage tracker and surveys on the wage expectations of firms, consumers and professional forecasters, pointed to a further decline in wage growth until at least early next year.
Finally, the transmission of monetary policy continued to be smooth. The monetary policy stance had eased significantly – the rate on the deposit facility having been cut by 200 basis points since the start of the easing cycle – and had been transmitting to lending rates and credit developments. Past interest rate cuts and easier financing conditions had underpinned domestic demand, including in the housing market, without causing its growth to accelerate, and had helped to support the overall resilience of the euro area economy in a challenging global environment. It was argued that interest rates were already significantly supportive of loan demand and past interest rate cuts had yet to have their full impact, with some transmission remaining in the pipeline. It was also argued that credit developments were slowly moving in the right direction and still broadly in line with historical patterns. By leading to a structurally higher level of debt, it was contended that the recent fiscal expansion in the euro area would push up the neutral rate of interest, thereby making the current monetary policy stance more expansionary.
However, it was also argued that transmission to credit was slow and that credit growth remained weak. This could be attributed to weak demand overall and the accumulated tightening of credit standards, with growth in credit to the private sector well below historical averages. In addition, a risk remained that a deterioration in financial market sentiment could lead to tighter financing conditions and greater risk aversion, making firms and households less willing to invest and consume. It was also noted that the Eurosystem balance sheet had continued to decline and that this implied an ongoing small tightening impact on financial conditions. At the same time, it was recalled that balance sheet reduction was very gradual and a large part of its impact had already been priced in. So, even though there was still some ongoing transmission from the cessation of reinvestment of maturing securities, the effect was minimal.
Monetary policy decisions and communication
Against this background, all members supported the proposal made by Mr Lane to keep the three key ECB interest rates unchanged. There was no immediate pressure to change policy rates at the current meeting. Interest rates were in broadly neutral territory after eight cuts in the last nine meetings, financial conditions remained broadly stable, and the incoming data since the June meeting had confirmed that inflation and the inflation outlook were in a good place, with inflation set to stabilise at the target in the medium term. The environment remained exceptionally uncertain, especially because of trade disputes but also owing to geopolitical developments. Such uncertainty could also justify keeping interest rates unchanged. In particular, maintaining policy rates at their current levels would allow more time to see how trade negotiations unfolded and to thoroughly assess the consequences of any final outcome for the interest rate path. Moreover, it would allow for further evaluation of the transmission of past interest rate cuts and for an assessment of additional incoming information, including in relation to manufacturing output, trade re-routing, services inflation, the exchange rate and financial market developments – also in the context of a fresh set of staff projections. All of this should facilitate, by September, a better understanding of how the economy was responding to the current challenges, including in relation to the counteracting forces currently obscuring the data signals, and what that implied for the outlook.
While a view was expressed that the current conditions would also be consistent with a further rate cut, owing to increasing downside risks to output and inflation, keeping interest rates unchanged was seen as a robust approach to managing shocks and two-sided inflation risks across a wide range of plausible scenarios. Overall, there was currently a high option value to waiting for more information and the resolution of some uncertainty.
With regard to communication, members reiterated that the Governing Council was determined to ensure that inflation would stabilise at its 2% target in the medium term. In view of the updated monetary policy strategy statement, members also agreed to amend the formulation of the Governing Council’s reaction function by adding a reference to the risks surrounding the inflation outlook. In particular, a faithful description of the process leading to the Governing Council’s interest rate decisions needed to emphasise that the assessment of the inflation outlook took into account the risks surrounding the outlook, in light of the incoming economic and financial data, as well as the dynamics of underlying inflation and the strength of monetary policy transmission. The Governing Council would also continue to follow a data-dependent and meeting-by-meeting approach to determining the appropriate monetary policy stance without pre-committing to a particular rate path.
Given the exceptional uncertainty and the risks of large inflationary and growth shocks in both directions, it was important for the Governing Council to have a two-sided perspective, maintaining full optionality for future meetings and being agile in order to react quickly to large shocks if necessary. Communication should maintain a careful, neutral tone and be deliberately uninformative about future interest rate decisions. At the same time, with the previous disinflationary cycle essentially at an end, the discussion had moved from the speed at which interest rates should be normalised, as part of a rate-cutting campaign, to potential marginal adjustments for the remainder of 2025 in view of the economic outlook and prevailing uncertainties. This called for data dependence in terms of how the incoming data would influence the medium-term outlook, rather than overreacting to individual data points.
Taking into account the foregoing discussion among the members, upon a proposal by the President, the Governing Council took the monetary policy decisions as set out in the monetary policy press release. The members of the Governing Council subsequently finalised the monetary policy statement, which the President and the Vice-President would, as usual, deliver at the press conference following the Governing Council meeting.
Monetary policy statement
Monetary policy statement for the press conference of 24 July 2025
Press release
Meeting of the ECB’s Governing Council, 23-24 July 2025
Members
- Ms Lagarde, President
- Mr de Guindos, Vice-President
- Mr Centeno
- Mr Cipollone
- Mr Demarco, temporarily replacing Mr Scicluna
- Mr Dolenc, Deputy Governor of Banka Slovenije
- Mr Elderson
- Mr Escrivá
- Mr Holzmann
- Mr Kazāks
- Mr Kažimír
- Mr Lane
- Mr Makhlouf*
- Mr Müller*
- Mr Nagel
- Mr Panetta
- Mr Patsalides
- Mr Rehn*
- Mr Reinesch
- Ms Schnabel
- Mr Šimkus
- Mr Sleijpen
- Mr Stournaras
- Mr Villeroy de Galhau*
- Mr Vujčić
- Mr Wunsch*
* Members not holding a voting right in July 2025 under Article 10.2 of the ESCB Statute.
Other attendees
- Mr Dombrovskis, Commissioner**
- Ms Senkovic, Secretary, Director General Secretariat
- Mr Rostagno, Secretary for monetary policy, Director General Monetary Policy
- Mr Winkler, Deputy Secretary for monetary policy, Senior Adviser, DG Monetary Policy
** In accordance with Article 284 of the Treaty on the Functioning of the European Union.
Accompanying persons
- Mr Arpa
- Ms Bénassy-Quéré
- Mr Debrun
- Mr Gilbert
- Mr Kaasik
- Mr Madouros
- Mr Martin
- Mr Mylonas
- Mr Nicoletti Altimari
- Mr Novo
- Mr Nuño
- Mr Rutkaste
- Ms Schembri
- Mr Šiaudinis
- Mr Šošić
- Mr Tavlas
- Mr Ulbrich
- Mr Välimäki
- Ms Žumer Šujica
Other ECB staff
- Mr Proissl, Director General Communications
- Mr Straub, Counsellor to the President
- Ms Rahmouni, Director General Market Operations
- Mr Arce, Director General Economics
- Mr Sousa, Deputy Director General Economics
Release of the next monetary policy account foreseen on 9 October 2025.
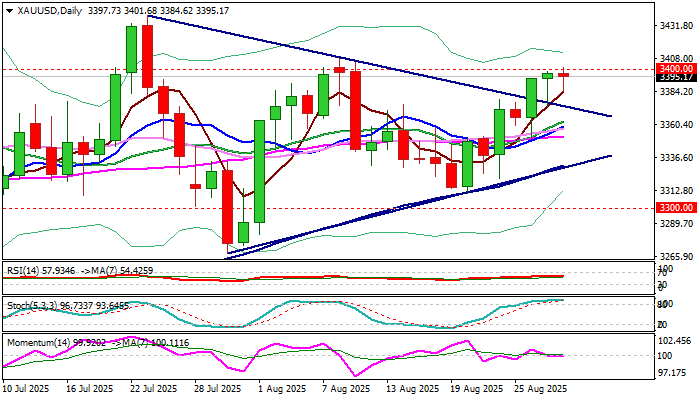
Gold: Bulls Crack Critical $3,400 Resistance Zone, US Inflation Data Eyed for Fresh Signals
Gold keeps firm tone and cracks very significant $3400 resistance zone (psychological / Aug 8 peak), trading at the highest in nearly three weeks on Thursday.
Bulls are driven by uncertainty after President Trump’s attempts to fire Fed Governor and persisting tensions over potential replacement of Chair Powell, as well as expectations for Fed rate cut in September.
Although Chair Powel showed a dovish shift in his latest speech, he did not commit to any action in the near future, implying that coming economic data (US PCE index, due on Friday and August Labor report, due next week) will provide more details about inflation and condition in the labor sector and contribute to the central bank’s decision in September’s policy meeting.
While the fundamentals move into desired direction (PCE index is expected to keep steady rise by 2.6% in July, while recent strong drop in US employment and rise of unemployment) and contribute to rising bets for rate cut.
Technical picture remains predominantly bullish on daily chart (MA’s in full bullish configuration/break above triangle upper boundary / long tail of Wednesday’s daily candle) but positive signals are partially offset by strongly overbought Stochastic and flat 14-d momentum.
This implies that bulls will face difficulties to break critical $3400 zone, with consolidation likely to precede fresh push higher.
Broken Fibo 76.4% barrier ($3385) should ideally contain, with extended dips expected to find solid ground above broken triangle’s upper boundary ($3373) to keep bulls in play.
Firm break of key obstacles at $3400/08 to signal bullish continuation and expose targets at $3438/52 (tops of July 23 / June 16 respectively).
Res: 3400; 3408; 3438; 3452.
Sup: 3385; 3373; 3367; 3356.
Nasdaq 100 Technical: Bullish Trend Intact Despite Nvidia -3% (After-Hours) Sell-off
This is a follow-up analysis and a timely update of our prior report, “Nasdaq 100 Technical: Potential bullish reversal at 50-day moving average” dated on 21 August 2025, considering the latest second-quarter earnings release of Nvidia, the Artificial Intelligence (AI) juggernaut and largest market-cap component stock of the Nasdaq 100.
Since our last publication, the price actions of the US Nasdaq 100 CFD Index (a proxy of the Nasdaq 100 futures) have staged the expected bullish reversal, rallied by 2%, and hit the intermediate resistance zone of 23,580/660 as expected.
Thereafter, the US Nasdaq 100 CFD Index has drifted in a sideways range of 1% since this Monday, 25 August, ahead of Nvidia earnings release scheduled after the close of Wednesday, 27 August’s US session.
In today’s early Asian session, the Nasdaq 100 futures have shed an intraday loss of -0.2% in reaction to Nvidia’s after-hours share price negative performance of -3.1% after the release of its second-quarter earnings.
Despite Nvidia’s lackluster ex-post earnings share price performance, the short to medium-term bullish trend phases of the US Nasdaq 100 CFD Index remain intact.
Let’s decipher in greater detail.
Nvidia tumbled -3% (after hours), but the bullish trend remains intact

Fig. 1: Nvidia revenue by business segments with data centre y/y growth as of Q2 2025 (Source: MacroMicro)
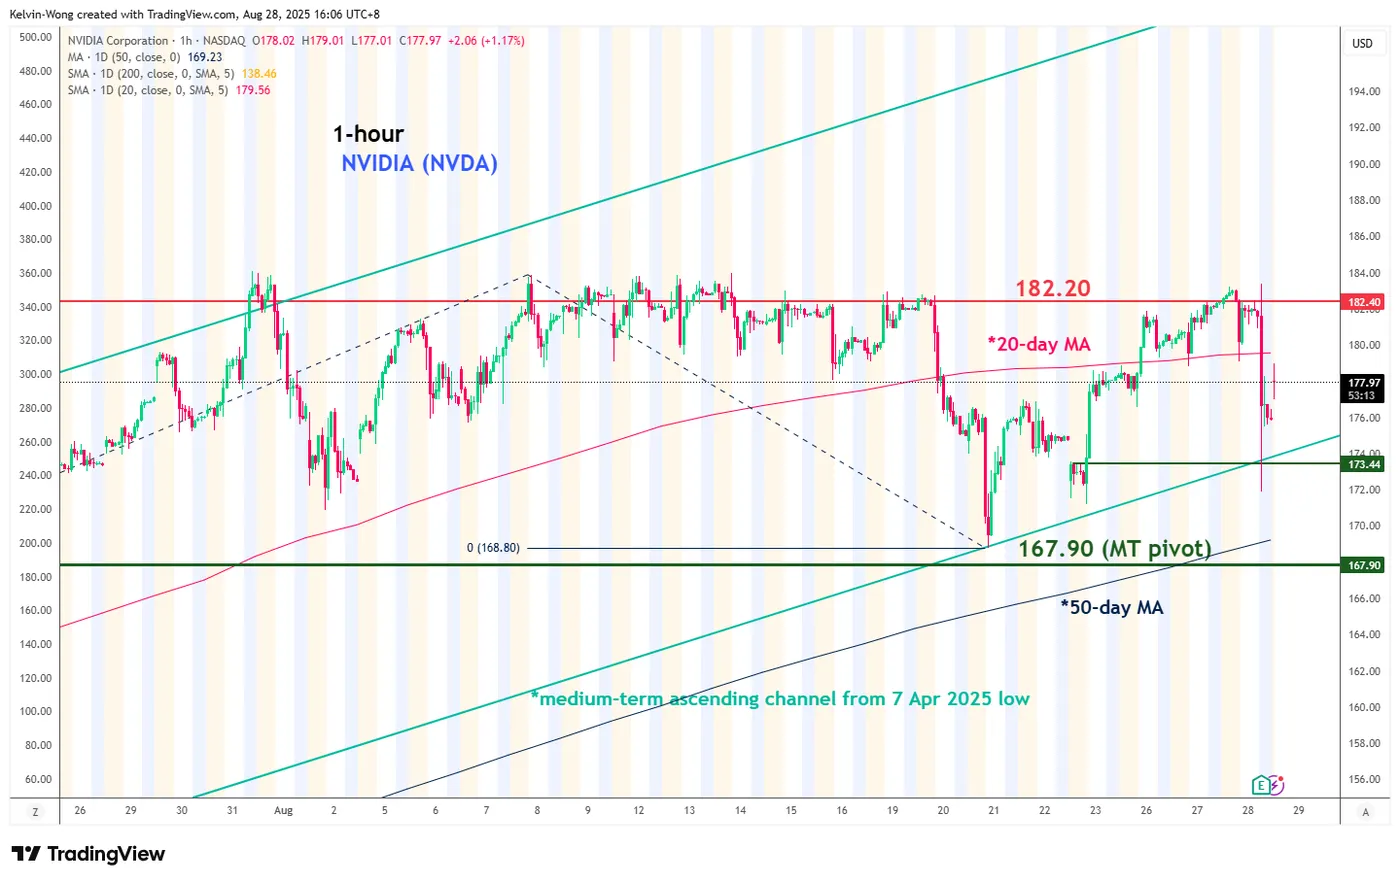
Fig. 2: Nvidia minor trend as of 28 Aug 2025 (Source: TradingView)
The lacklustre after-hours share price performance of Nvidia has been attributed to its significant Artificial Intelligence (AI)- centric data centre revenue, which came in below expectations at US$41 billion, compared to analysts' expectations of US$41.3 billion.
Year-on-year growth in data centre revenue has continued to decelerate, easing from a staggering 155% in Q2 2024 to 56% in Q2 2025.
Despite the Q2 slowdown in data centre revenue growth, Nvidia has issued a positive outlook on its data centre business segment during the earnings call. It anticipates a US$3 to $4 trillion AI infrastructure spend by the end of the decade, presenting long-term growth opportunities. Also, Nvidia is on track to achieve over US$20 billion in sovereign AI revenue in 2025.
In addition, Nvidia is preparing for the next generation of graphics processing units (GPUs) with the Rubin platform that is expected to ramp up in production in the latter part of 2025.
Lastly, based on a technical analysis standpoint, the intra-session drop of -5.3% seen in Nvidia in the after-hours session upon the release of its Q2 earnings has managed to stall at its medium-term ascending channel support in place since 7 April 2025 low, and came close to its 50-day moving average (see Fig. 2).
Positive technical indicators, combined with upbeat guidance from Nvidia’s data centre segment, are expected to support its share price, potentially creating a reinforcing effect on the broader Nasdaq 100.
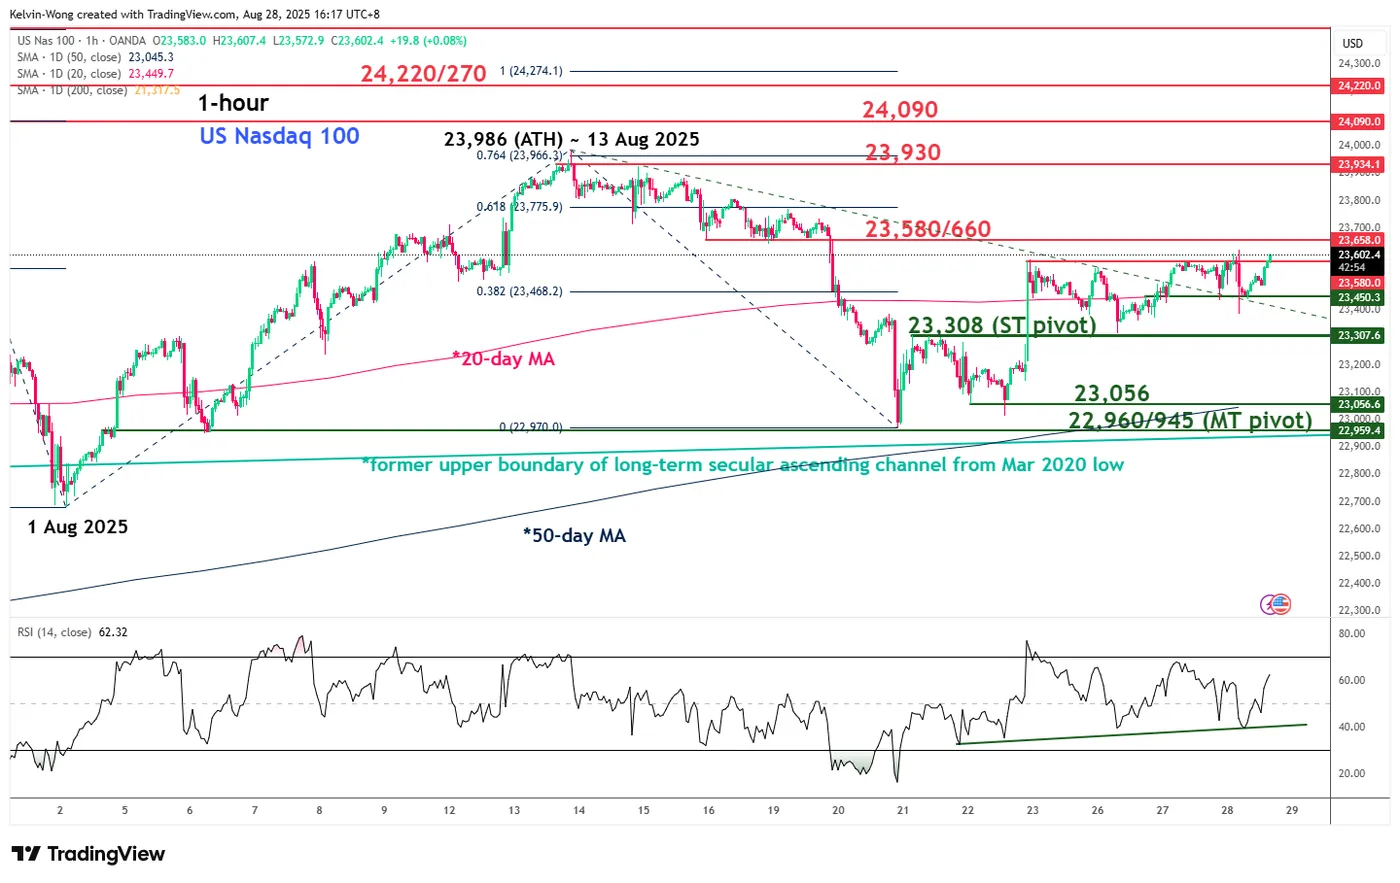
Fig. 3: US Nasdaq 100 CFD Index minor trend as of 28 Aug 2025 (Source: TradingView)
Preferred trend bias (1-3 days)
Maintain bullish bias on the US Nasdaq 100 CFD Index with tightened key short-term pivotal support now at 23,308. A clearance above 23,660 reinforces the new bullish impulsive sequence to retest the current all-time high area at 23,930 before the next intermediate resistance comes in at 24,090 (Fibonacci extension) (see Fig. 3).
Key elements
- The price actions of the US Nasdaq 100 CFD Index have staged a bullish breakout and retested its former minor descending resistance, drawn from its current all-time high level of 23,986, now turns into an intermediate pull-back support at 23,450.
- The US Nasdaq 100 CFD Index has now traded back above its 20-day moving average.
- The hourly RSI momentum indicator of the US Nasdaq 100 CFD Index has staged a rebound after a test on its parallel ascending support, which suggests bullish momentum condition remains intact.
Alternative trend bias (1 to 3 days)
A break below the 23,308 key support negates the bullish tone on the US Nasdaq 100 CFD Index for another round of minor corrective decline to retest the intermediate support at 23,056, with a maximum limit set at the 22,960/22,945 key medium-term pivotal support (also the 50-day moving average).
Bitcoin Gained Confidence, Looking at Altcoins and Stocks
Market Overview
The crypto market capitalisation recovered by another 1.6% in 24 hours to $3.92 trillion, adding for the second day in a row. This time, Bitcoin even slightly outperformed the market (+2.2%), but still lagged Solana (+5.1%). However, all the top coins have been overshadowed by Cronos over the last couple of days, which added 55% in 24 hours and 137% in 7 days.
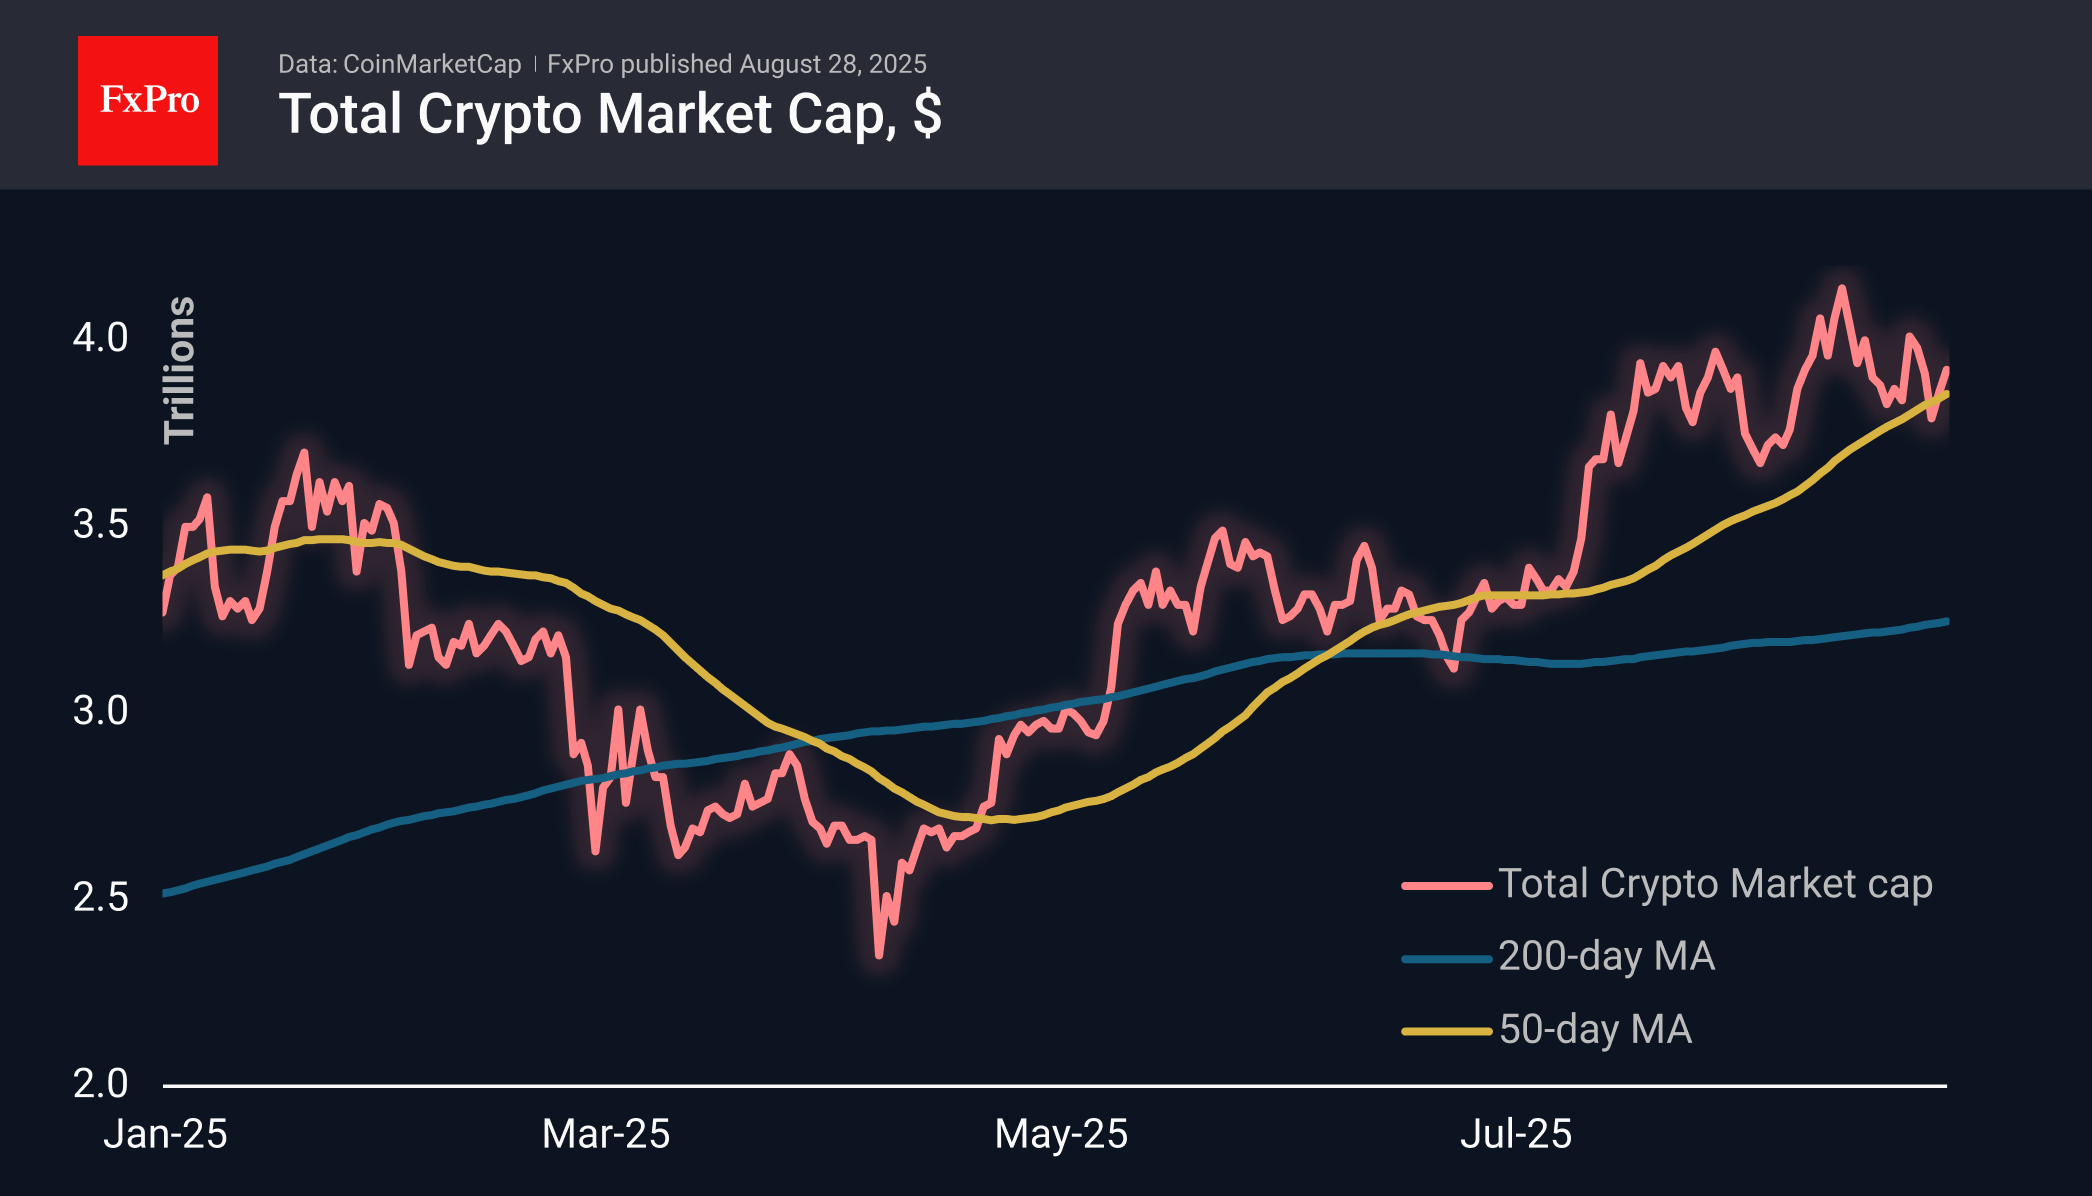
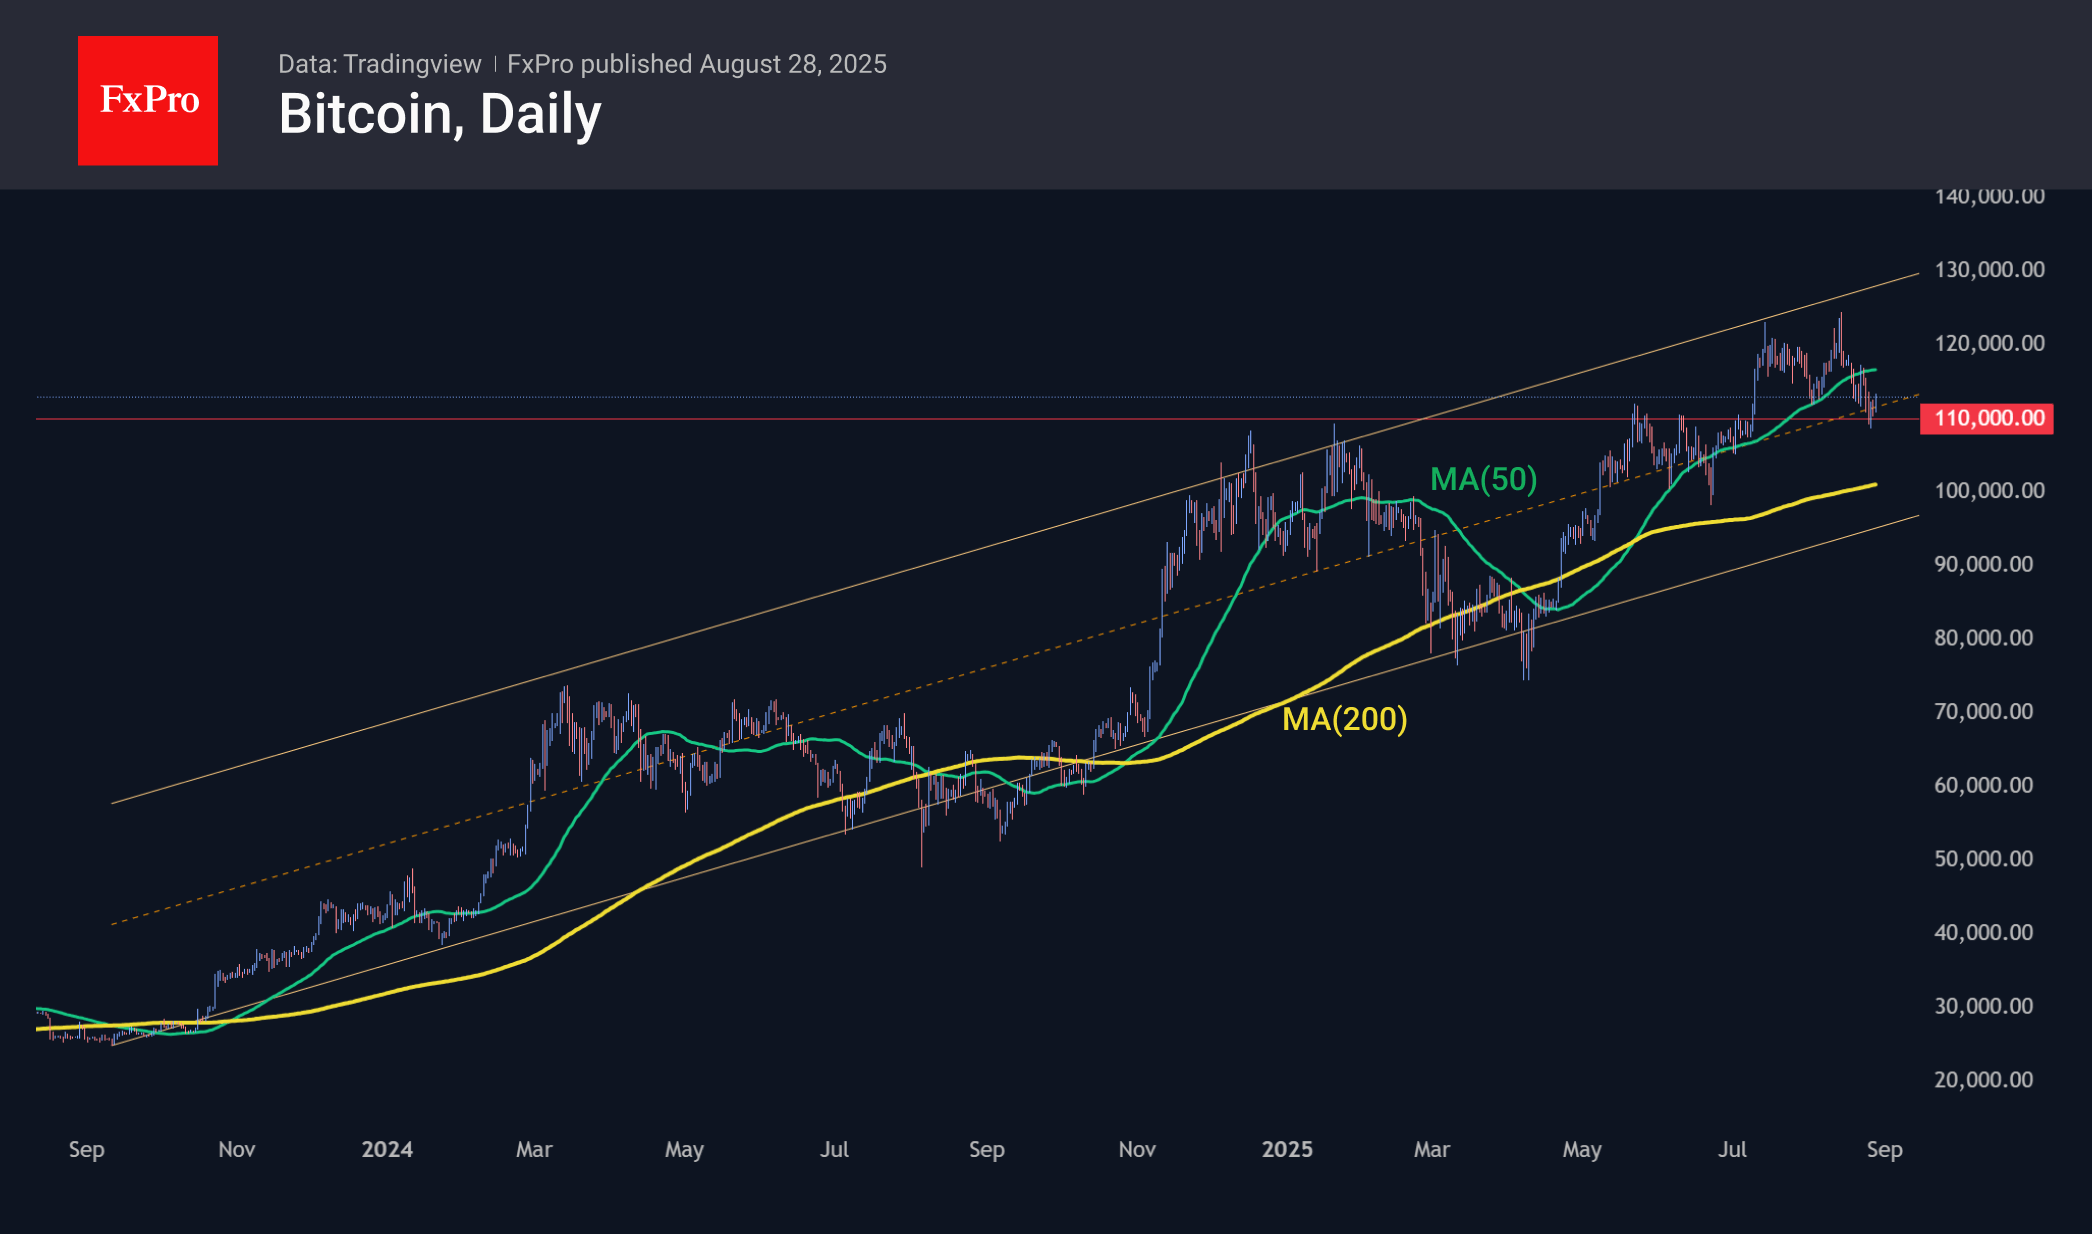
Bitcoin is drawing its third rising daily candle, trading above $113K on Thursday morning. The growth of altcoins, coupled with the rise in stock indices, has created an environment of increased risk appetite, while BTC’s decline to $110K has restored its attractiveness to buyers.
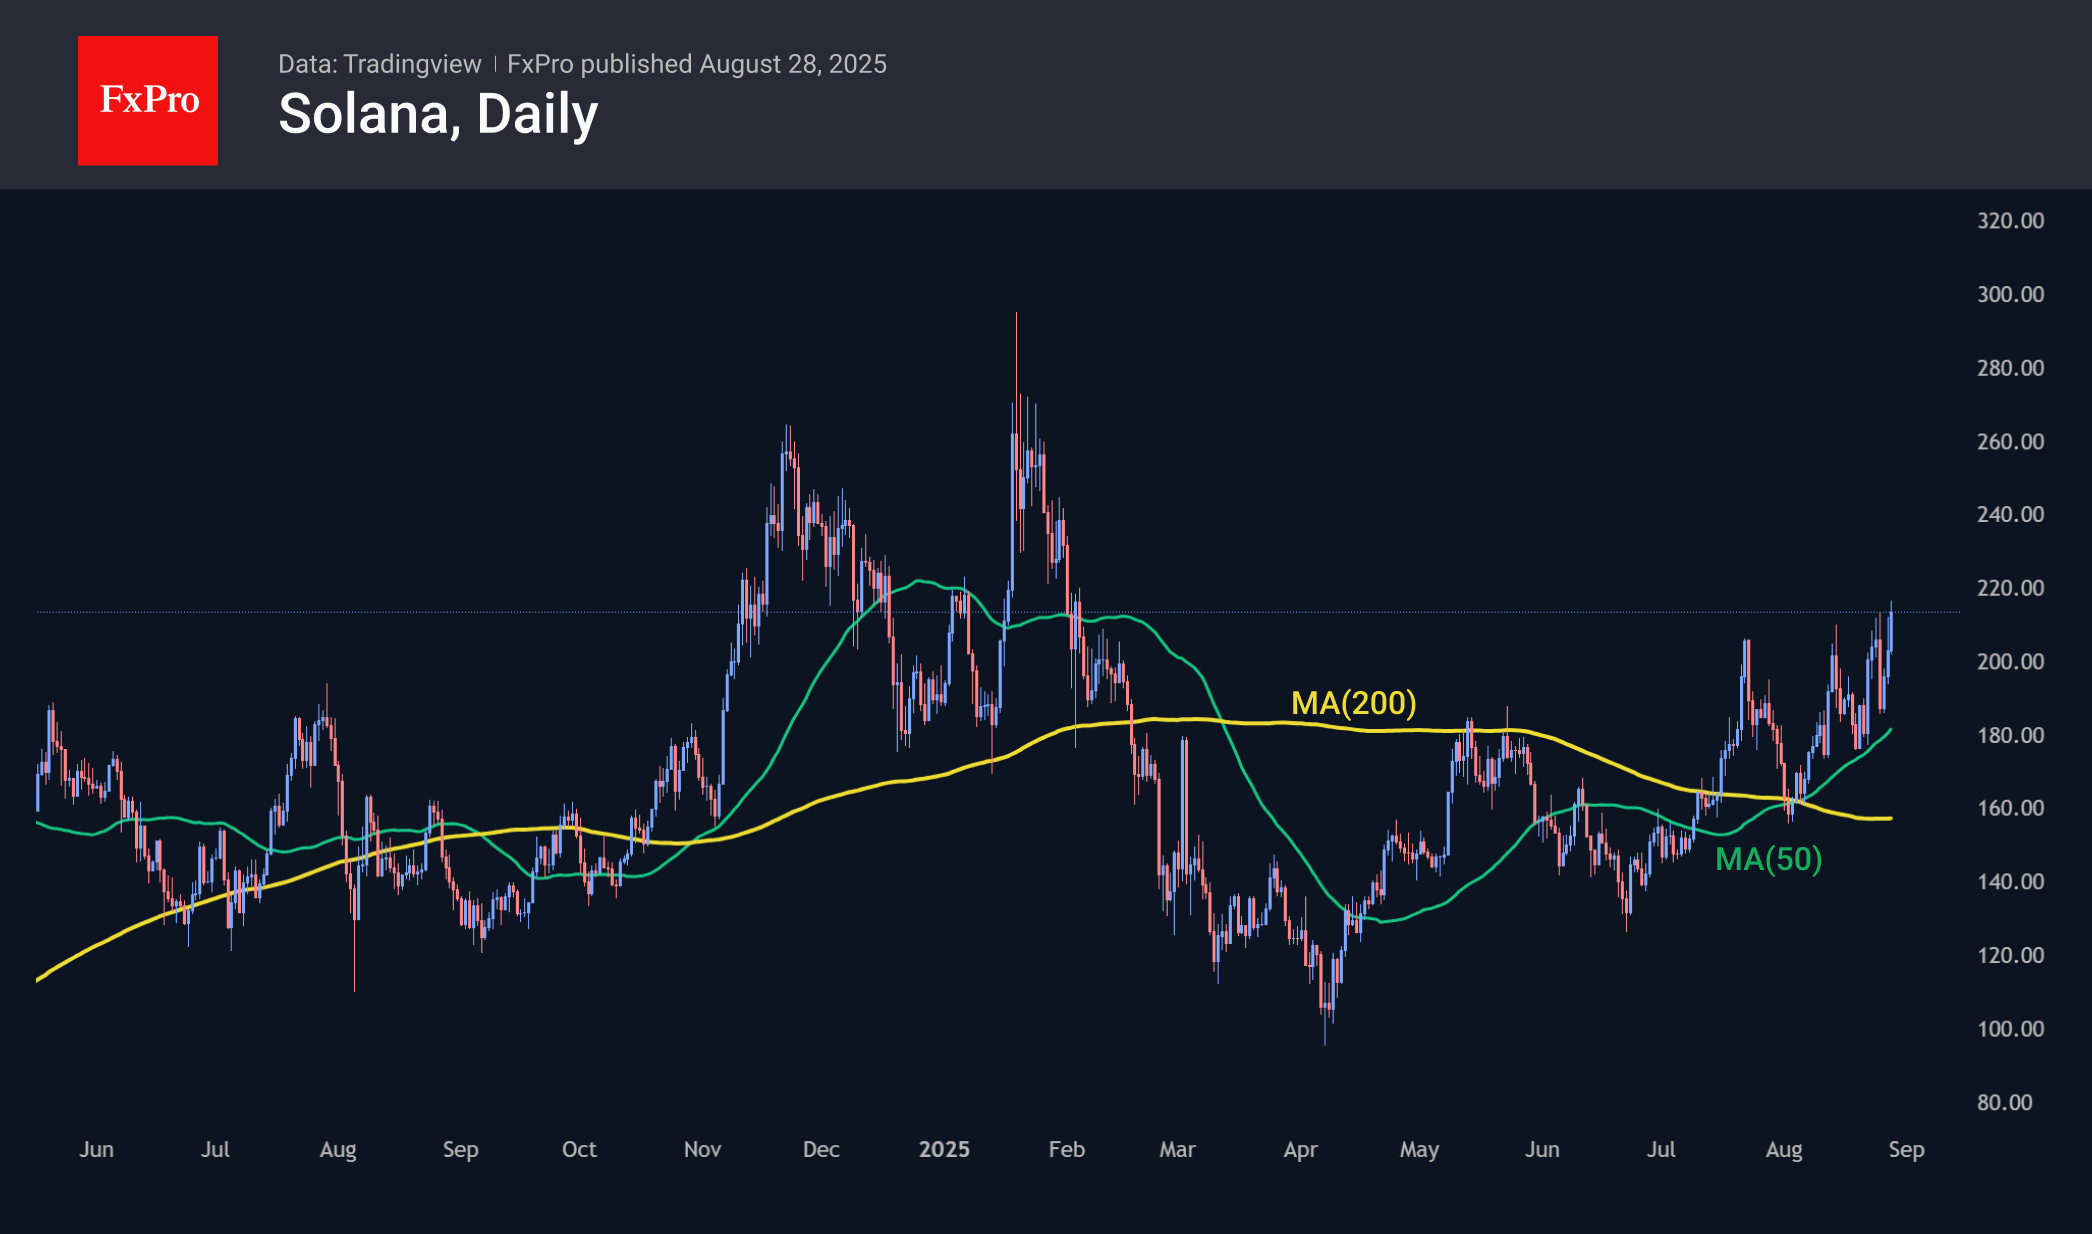
Solana rose to $215, adding 18% since Tuesday and reaching its highest level since early February. Technically, the coin managed to stay above the 50-day moving average and continued to record a series of higher local highs, confirming its commitment to the uptrend.
News Background
Amid the background sell-off, there has been an influx of capital into Binance. According to CryptoQuant, $1.65 billion in stablecoins has been deposited on the exchange. Large inflows of ‘stablecoins’ to platforms often precede an increase in demand for cryptocurrencies.
10x Research estimates the probability of Bitcoin reaching $140,000 by the end of the year at only 54%. The pessimism is linked to a slowdown in institutional inflows, large-scale sell-offs by miners, and BTC’s traditional weakness in the third quarter.
BlackRock CEO Larry Fink called Bitcoin a ‘currency of fear’ and digital gold, explaining that it serves as a reliable store of value in times of economic uncertainty.
According to Standard Chartered, Ethereum and companies that own ETH are undervalued. The bank maintains its forecast for Ethereum at $7,500 by the end of the year and $25,000 by 2028.
Sterling Demonstrating Stability, Buoyed by Shifting Rate Expectations Surrounding BoE
The GBP/USD pair advanced to 1.3509 on Thursday. The primary catalyst for traders was the latest UK Producer Price Index (PPI) data.
UK producer inflation accelerated to a two-year high, reaching 1.9% year-on-year (y/y) in June. This follows a previous report showing that consumer price inflation (CPI) rose to 3.8% y/y in July, an 18-month peak. Despite these inflationary pressures, money markets are currently pricing in only a 40% probability of a BoE rate cut by the end of the year.
Despite near-term volatility, sterling remains approximately 1.5% higher against the US dollar for August. This appreciation has been driven by diminishing expectations of an imminent BoE rate cut and a series of robust macroeconomic data releases. The hawkish sentiment was underscored by comments from Catherine Mann, a member of the BoE's Monetary Policy Committee, who stated that policy must remain unchanged to anchor inflation effectively.
In summary, a hawkish repricing of BoE interest rate expectations is providing short-term momentum for the pound.
Technical Analysis: GBP/USD
H4 Chart:
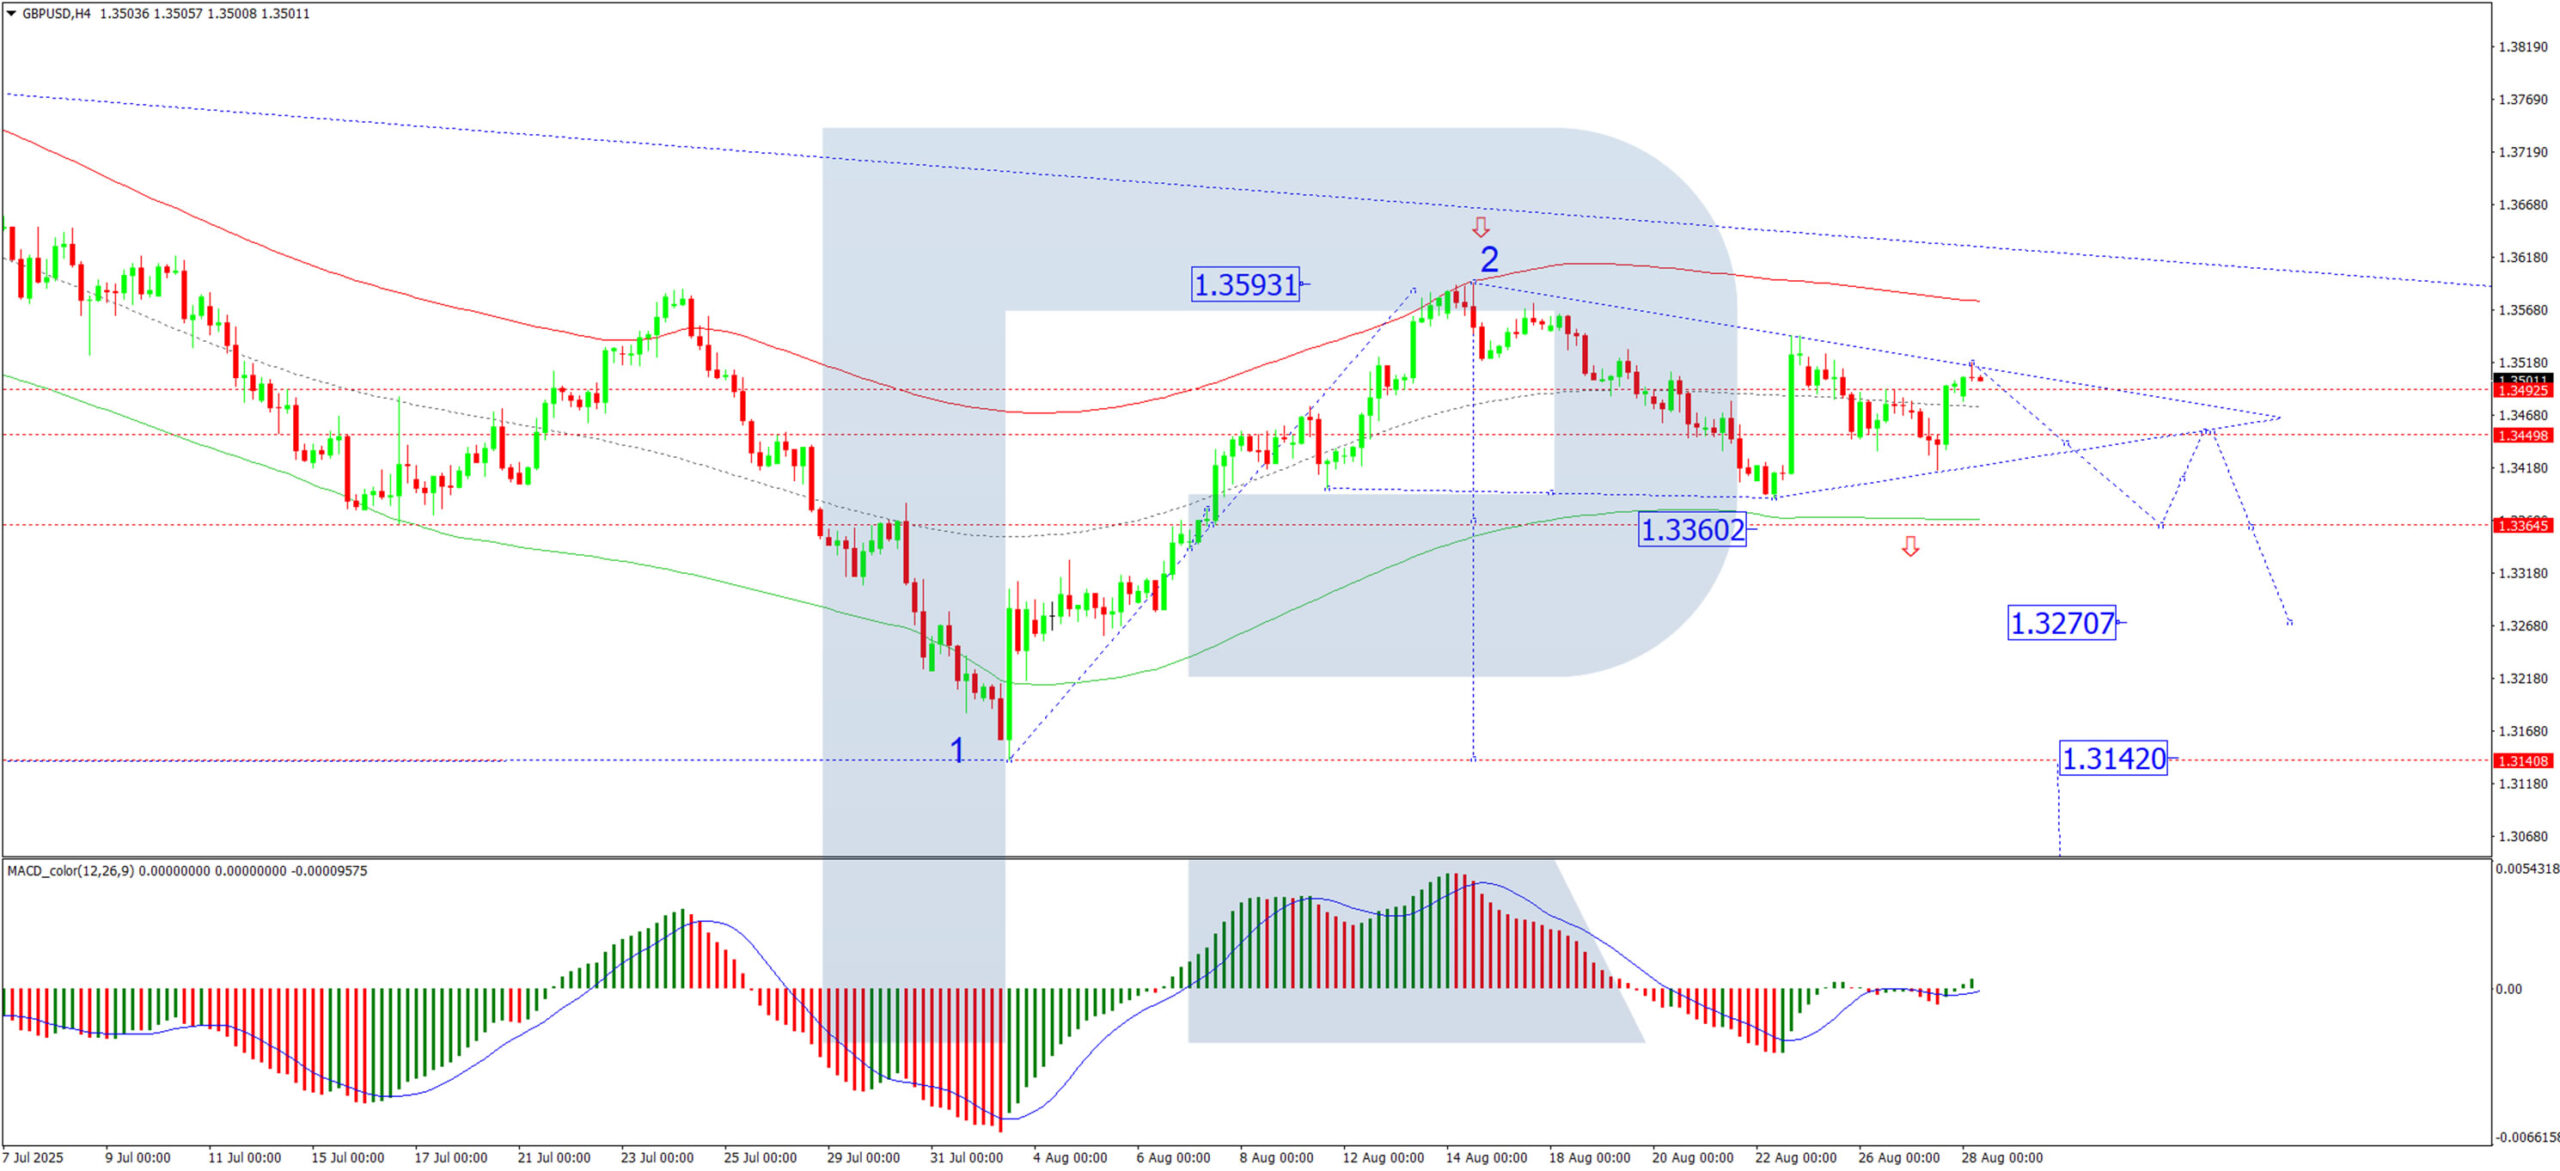
On the H4 chart, the GBP/USD pair completed a downward impulse wave to the 1.3420 level, followed by a corrective bounce to 1.3515. The market continues to develop a consolidation range around the 1.3455 level. The primary scenario for today is a resumption of the downward wave towards the 1.3360 support. A decisive break below this level would open the potential for a further decline towards the next downside targets of 1.3270 and 1.3140. This bearish outlook is technically supported by the MACD indicator, whose signal line remains below zero and is pointing sharply lower.
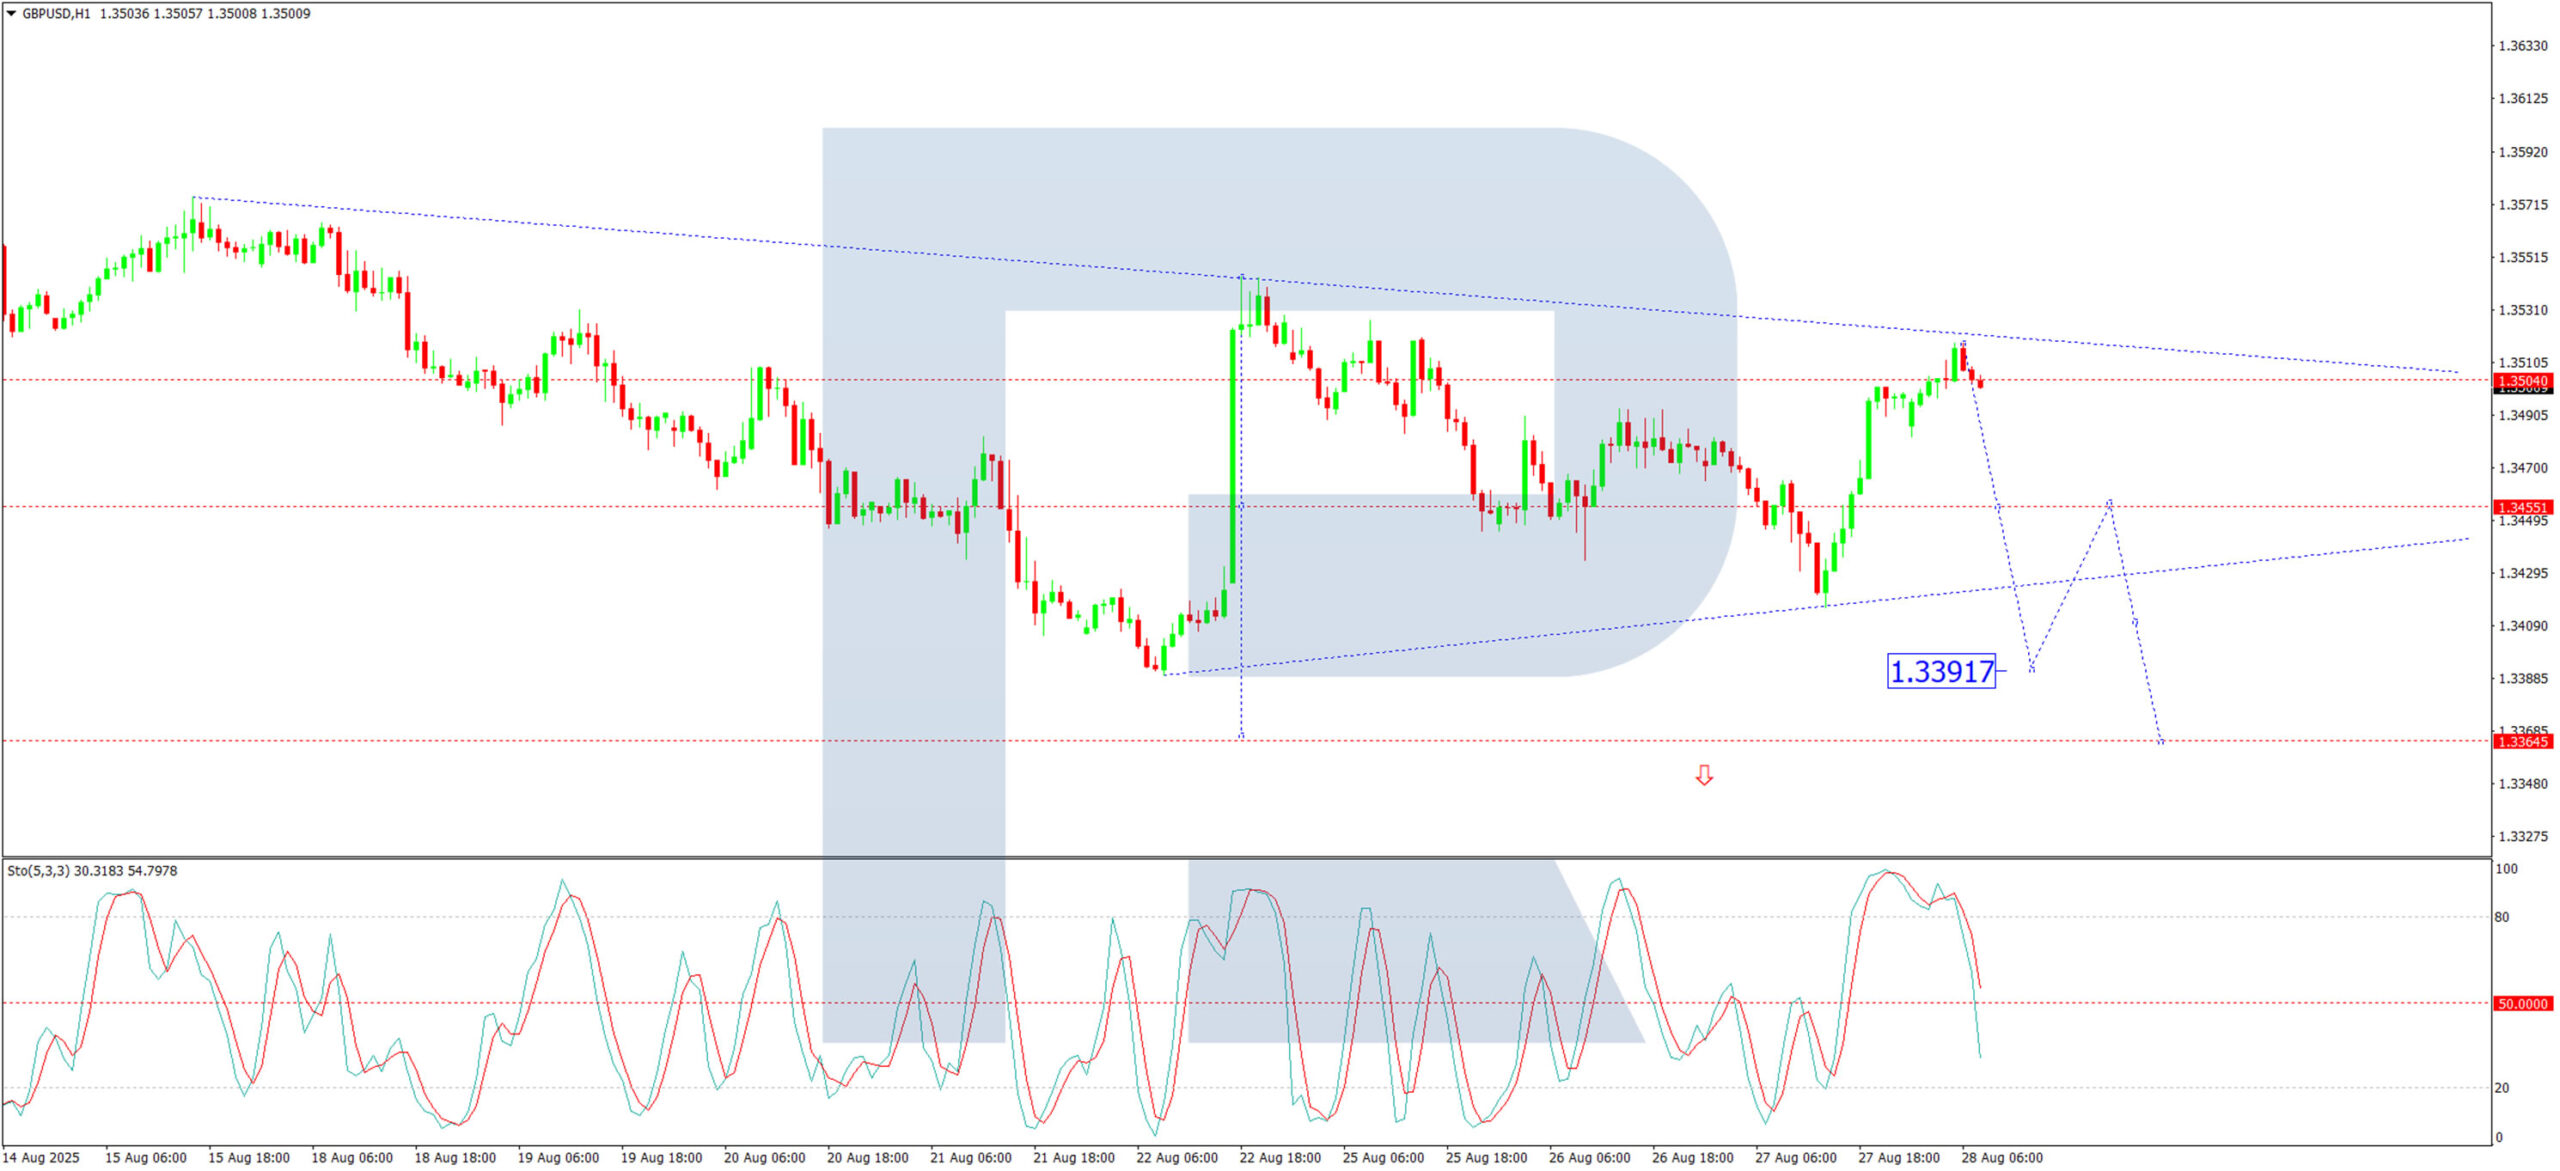
H1 Chart:
On the H1 chart, the market formed a downward wave structure towards 1.3417, which was followed by a corrective wave to 1.3517. The current expectation is for the initiation of a new declining wave towards 1.3455, with the potential to extend the downward structure towards the 1.3390 level. This scenario is technically corroborated by the Stochastic oscillator. Its signal line is currently below the 80 level and is trending sharply downwards towards 20, indicating strengthening bearish momentum.
Conclusion
The fundamental backdrop, characterised by persistent inflation and hawkish BoE rhetoric, offers near-term support for sterling. However, from a technical perspective, both the H4 and H1 charts suggest a high probability of a short-term bearish correction. Key levels to watch on the downside are 1.3360 and 1.3390. A break below these support levels could trigger a deeper pullback, despite the positive fundamental drivers.
EUR/USD Recovers from 20-Day Low
The EUR/USD pair today is moving under the influence of several factors:
- Donald Trump’s decision to dismiss Lisa Cook, a member of the Federal Reserve Board of Governors, raising concerns over the Fed’s independence;
- expectations of a Fed rate cut in September;
- anticipation of US GDP and jobless claims data (due today at 15:30 GMT+3);
- the political crisis in France.
These and other drivers pushed the pair down to a 20-day low yesterday (with a local low L3 formed on the EUR/USD 4-hour chart), before it staged a firm recovery.
EUR/USD Chart Technical Analysis
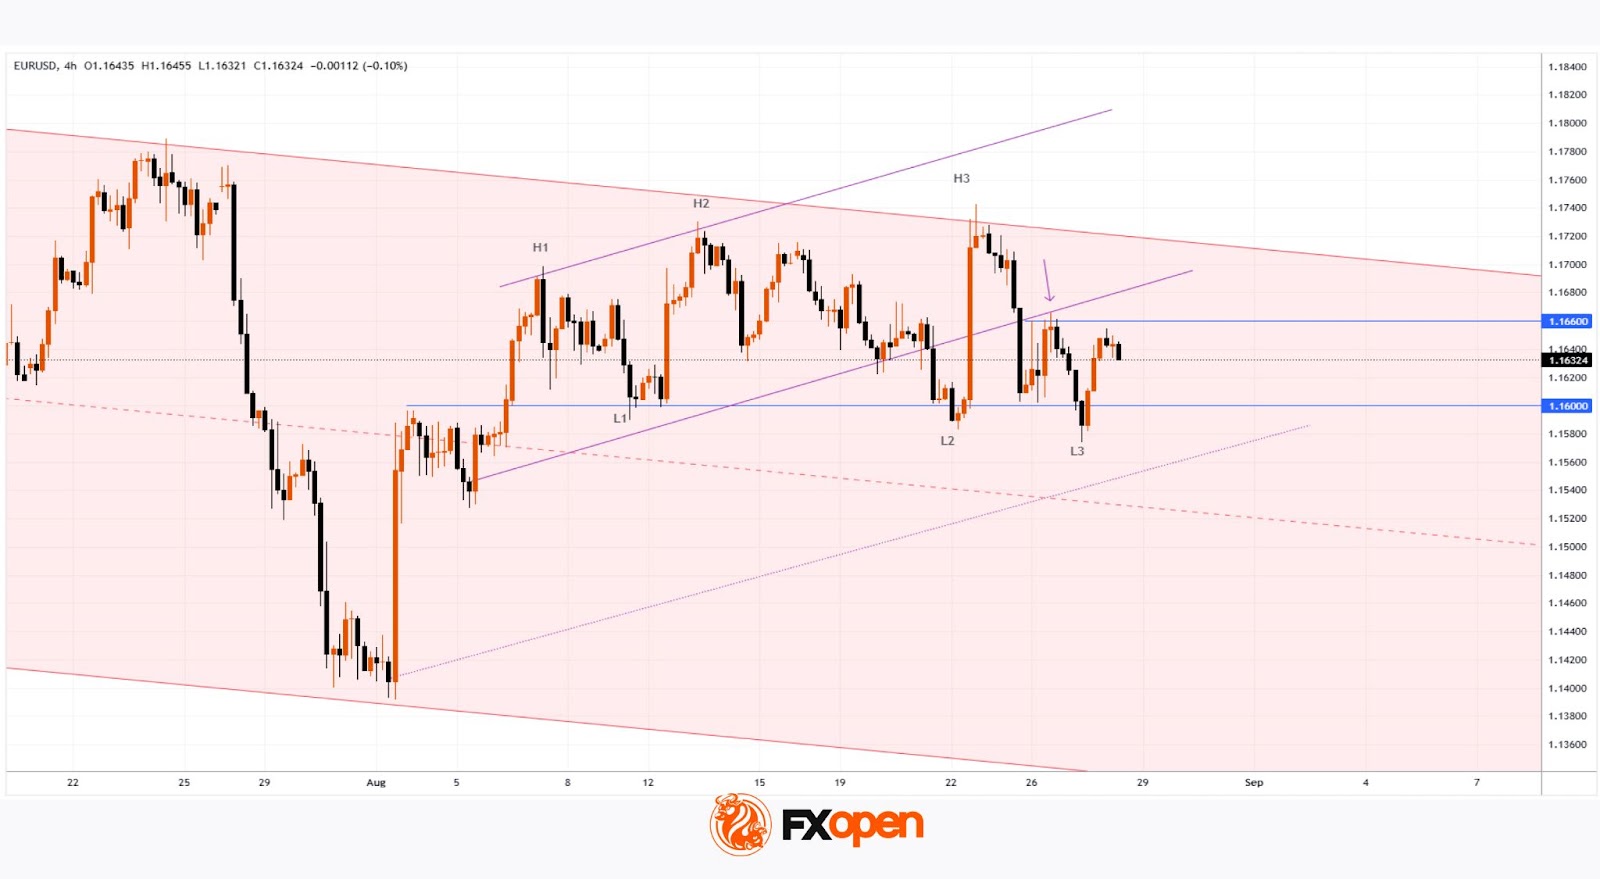
At the start of the week, we:
→ outlined a descending channel (shown in red);
→ drew an interim upward price trajectory (purple lines);
→ highlighted bearish signs (for instance, the lower purple line acting as resistance), suggesting a possible attempt to break key support at 1.1600.
Yesterday’s price action confirmed such an attempt, but it triggered renewed demand. The bulls prevented further downside momentum, leaving EUR/USD trading above 1.1600 today.
At the same time:
→ with the formation of the L3 low, a bullish engulfing pattern can be observed;
→ the sequence of higher highs (H1→H2→H3) alongside lower lows (L1→L2→L3) forms a megaphone pattern.
As for resistance, the 1.1660 level stands out – bears were successful here when they broke through the lower boundary of the interim upward trajectory, and this zone also coincides with the axis of the megaphone pattern.
Thus, we could assume that in the near term EUR/USD may fluctuate within the 1.1600–1.1660 range, until sentiment shifts – for example, due to statements from Washington or fresh US labour market data.
Trade over 50 forex markets 24 hours a day with FXOpen. Take advantage of low commissions, deep liquidity, and spreads from 0.0 pips. Open your FXOpen account now or learn more about trading forex with FXOpen.
This article represents the opinion of the Companies operating under the FXOpen brand only. It is not to be construed as an offer, solicitation, or recommendation with respect to products and services provided by the Companies operating under the FXOpen brand, nor is it to be considered financial advice.
European Currencies Hold Key Levels: Market in Search of New Signals
The major European currencies held their ground near key levels on Thursday. Following Jerome Powell’s dovish remarks at the Jackson Hole symposium, the US dollar first fell sharply, then corrected higher on Monday, only to weaken again by midweek. Market reaction, however, remains uncertain: investors have yet to form a consensus on whether the dollar’s decline marks the continuation of a downtrend or if the current consolidation will develop into a new upward impulse for the greenback. Against this backdrop, the EUR/USD and USD/CHF pairs have once again tested important levels but managed to rebound, maintaining a balance between supply and demand.
Market participants are now focused on the upcoming data releases from Europe and the United States. In the euro area, figures on consumer and business sentiment, inflation expectations, and business climate indices are due, which could adjust short-term forecasts for the euro. In the US, attention will centre on labour market and price dynamics – jobless claims, the GDP deflator, and the Personal Consumption Expenditures (PCE) index will be key indicators for assessing the Federal Reserve’s future policy trajectory. These publications could determine whether EUR/USD and USD/CHF remain within their current ranges or if the market is preparing for new impulses.
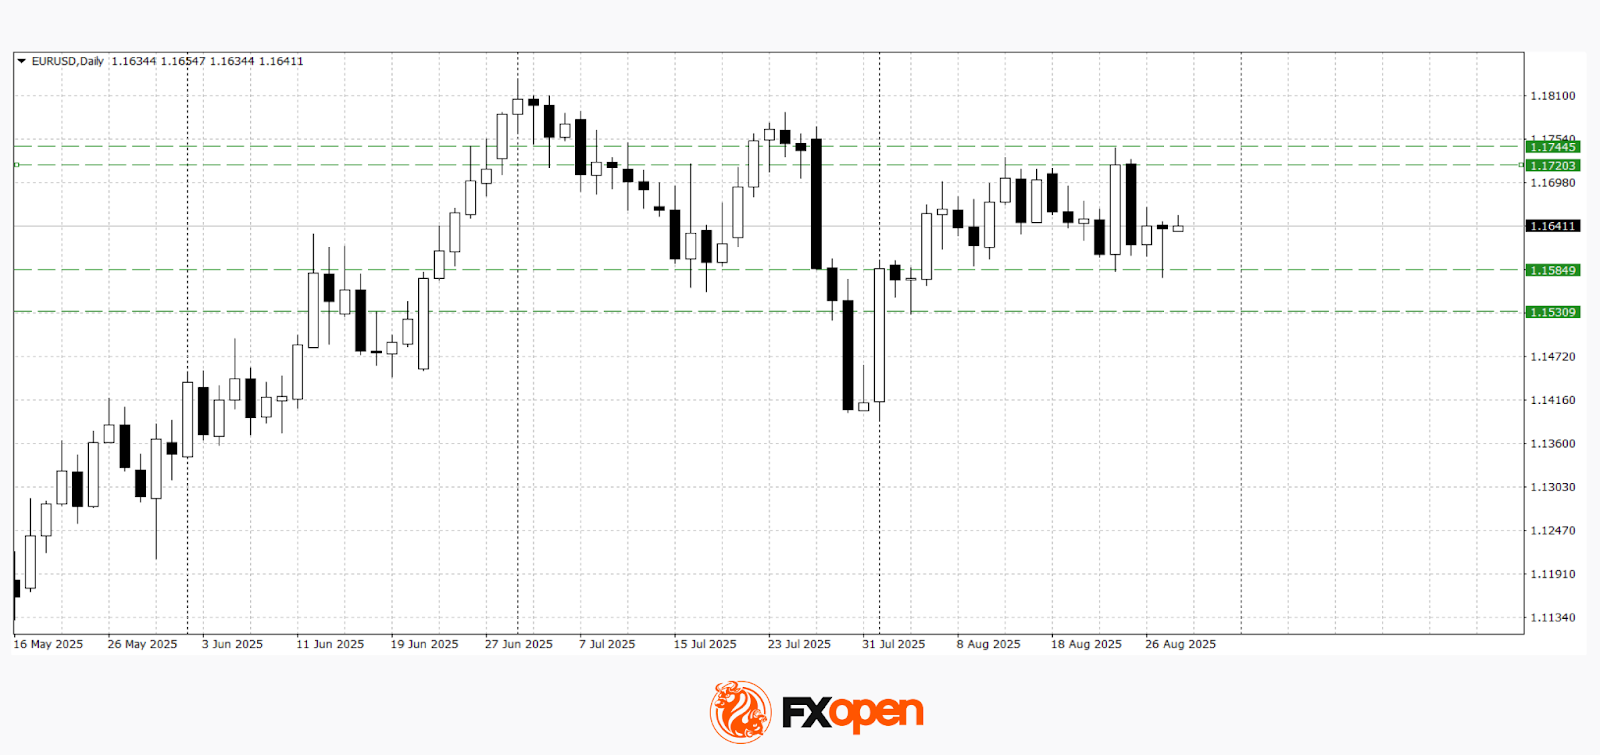
EUR/USD
Yesterday, sellers of the single European currency attempted to break key support at 1.1600. The price set a new August low, but the breakout proved false, and the pair returned to 1.1640. Technical analysis of EUR/USD indicates sideways trading between 1.1580 and 1.1740. A significant fundamental driver would be required to push the pair beyond this range.
Factors that could influence the EUR/USD movement include:
- Today at 12:00 (GMT+3): Eurozone consumer and business confidence report
- Today at 14:30 (GMT+3): ECB monetary policy meeting minutes
- Tomorrow at 15:00 (GMT+3): Germany Consumer Price Index (CPI)
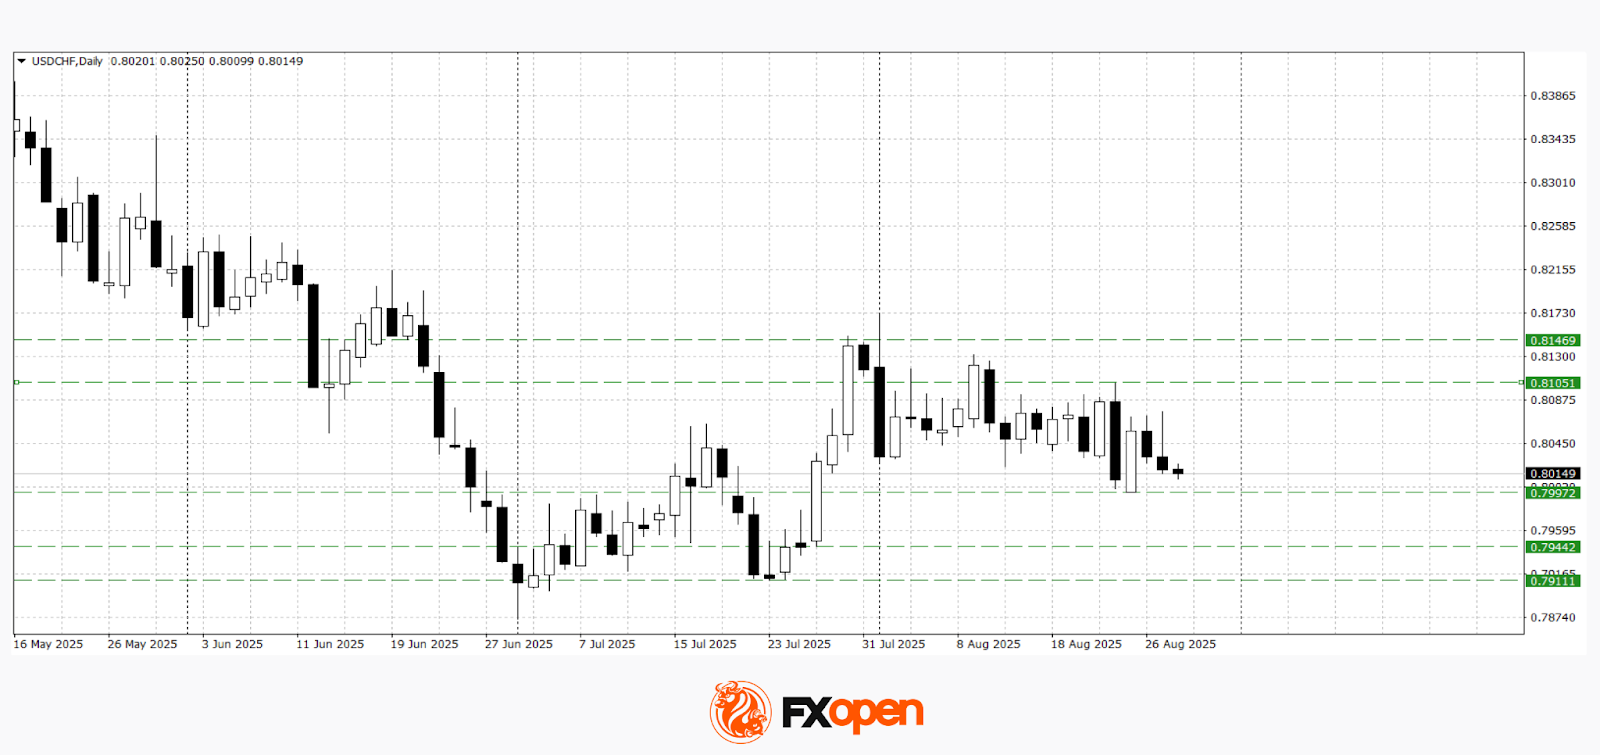
USD/CHF
The USD/CHF pair has been trading in a narrow range between 0.8000 and 0.8150 for several weeks. Following the Fed Chair’s dovish remarks, the price tested the lower boundary of this range, but no renewed downward momentum has been observed so far. Should positive US news emerge, the upper boundary of the sideways corridor at 0.8150 may be tested. A break below 0.8000 could trigger a decline towards 0.7910–0.7940.
Factors that could influence the USD/CHF movement include:
- Today at 15:30 (GMT+3): US GDP
- Today at 15:30 (GMT+3): US Initial Jobless Claims
- Tomorrow at 10:00 (GMT+3): Swiss KOF Leading Economic Indicator
Trade over 50 forex markets 24 hours a day with FXOpen. Take advantage of low commissions, deep liquidity, and spreads from 0.0 pips. Open your FXOpen account now or learn more about trading forex with FXOpen.
This article represents the opinion of the Companies operating under the FXOpen brand only. It is not to be construed as an offer, solicitation, or recommendation with respect to products and services provided by the Companies operating under the FXOpen brand, nor is it to be considered financial advice.
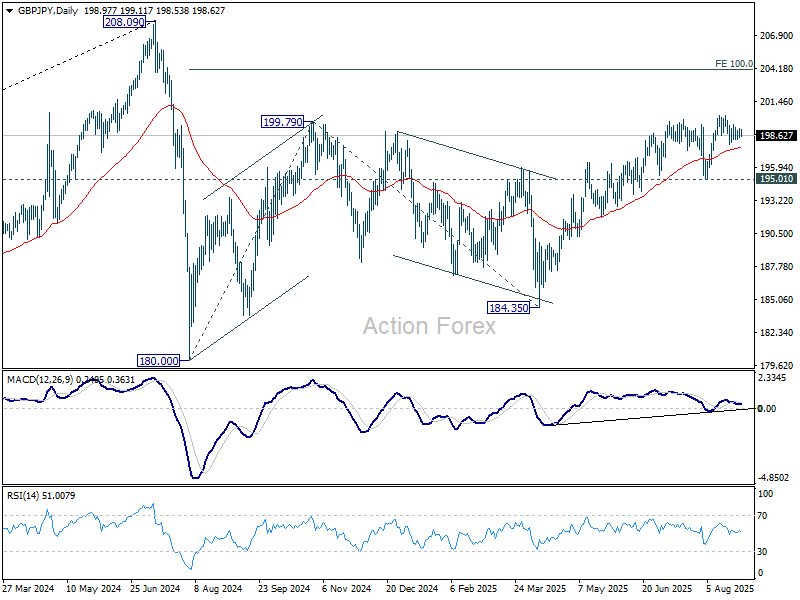
GBP/JPY Daily Outlook
Daily Pivots: (S1) 198.60; (P) 198.90; (R1) 199.30; More...
No change in GBP/JPY's outlook as range trading continues. Intraday bias remains neutral at this point. While another fall cannot be ruled out, near term outlook will stay bullish as long as 195.01 support holds. On the upside, firm break of 2002.6 will resume the whole rise from 184.35 to 100% projection of 180.00 to 199.79 from 184.35 at 204.14.
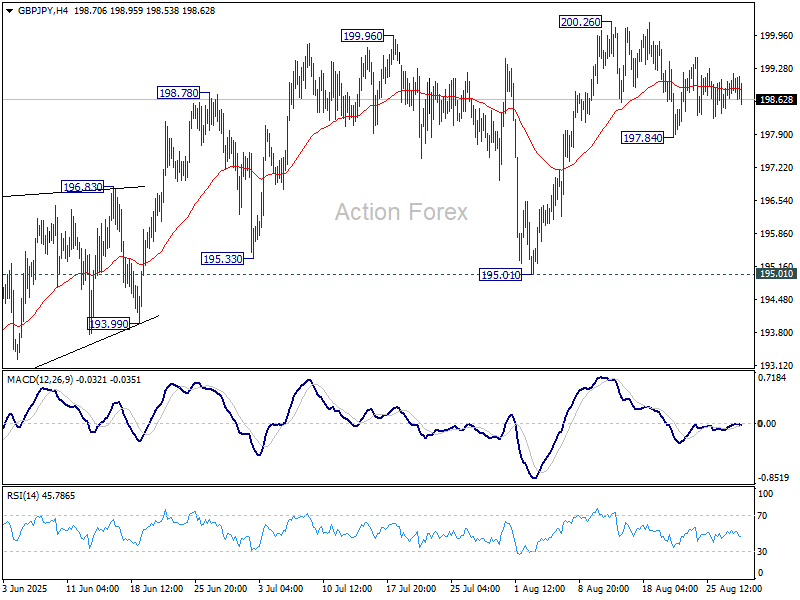
In the bigger picture, price actions from 208.09 (2024 high) are seen as a correction to rally from 123.94 (2020 low). The pattern might still extend with another falling leg. But in that case, strong support should be seen from 38.2% retracement of 123.94 to 208.09 at 175.94 to contain downside. Meanwhile, decisive break of 208.09 will confirm long term up trend resumption.
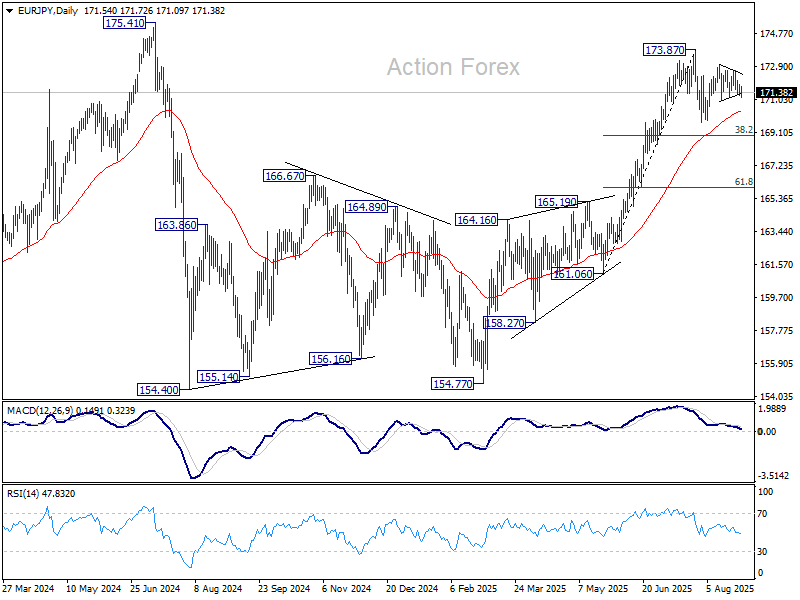
EUR/JPY Daily Outlook
Daily Pivots: (S1) 171.24; (P) 171.58; (R1) 171.89; More...
Intraday bias in EUR/JPY remains neutral for the moment. On the downside, break of 170.94 support will bring deeper fall to 169.69, or further to 38.2% retracement of 161.06 to 173.87 at 168.97. On the upside, above 172.99 will bring retest of 173.87 short term top.
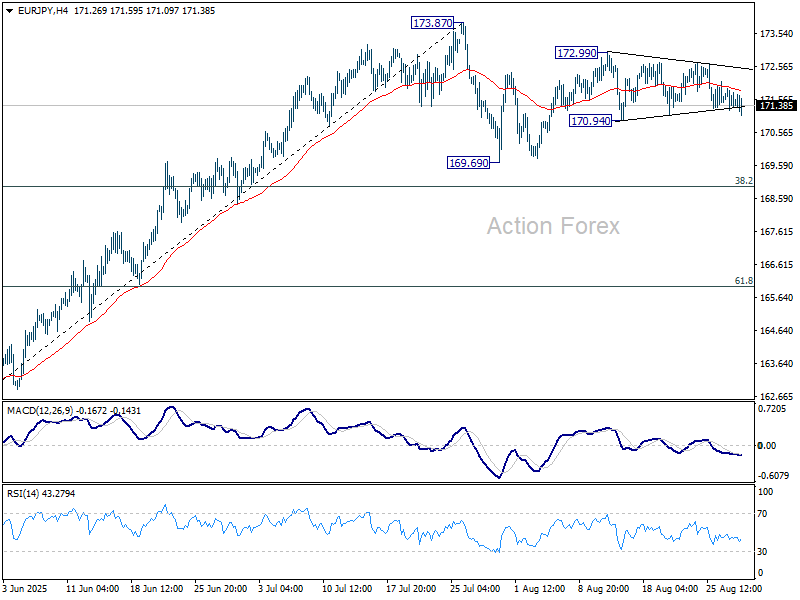
In the bigger picture, considering current strong momentum as seen in the rally from 154.77, corrective pattern from 175.41 could have already completed. Decisive break of 154.77 will confirm long term up trend resumption. Next target is 61.8% projection of 124.37 to 175.41 from 154.77 at 186.31. However, rejection by 175.41, followed by firm break of 55 D EMA (now at 170.34) will delay this bullish case.