
Sample Category Title
EUR/GBP Daily Outlook
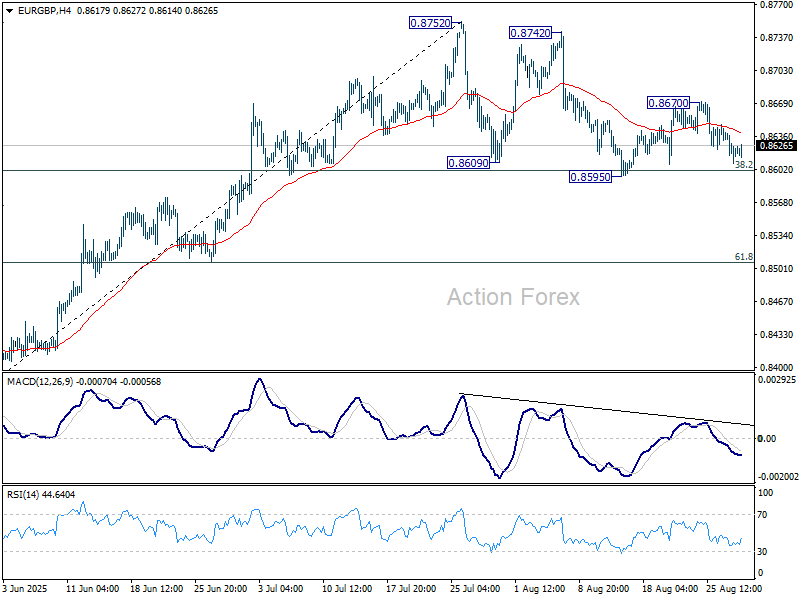
Daily Pivots: (S1) 0.8605; (P) 0.8627; (R1) 0.8645; More...
Intraday bias in EUR/GBP remains neutral for the moment. On the downside, sustained trading below 38.2% retracement of 0.8354 to 0.8752 at 0.8600 will indicate near term bearish reversal and target 61.8% retracement at 0.8506. On the upside, above 0.8670 will resume the rebound from 0.8595 to retest 0.8752 high.
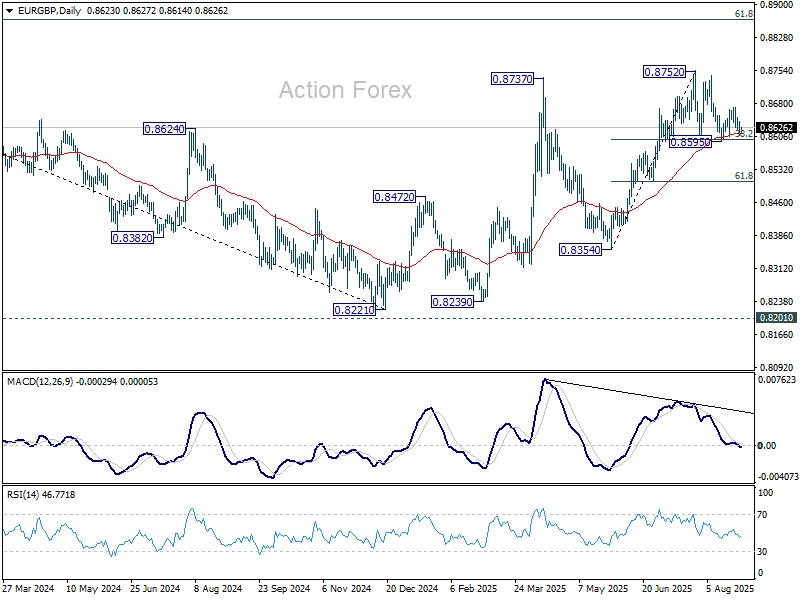
In the bigger picture, the structure from 0.8221 medium term bottom are not impulsive enough to suggest that it's reversing the down trend from 0.9267 (2022 high). But even if it's a correction, further rise is expected to 61.8% retracement of 0.9267 to 0.8221 at 0.8867. This will remain the favored case as long as 55 W EMA (now at 0.8508) holds.
EUR/AUD Daily Outlook
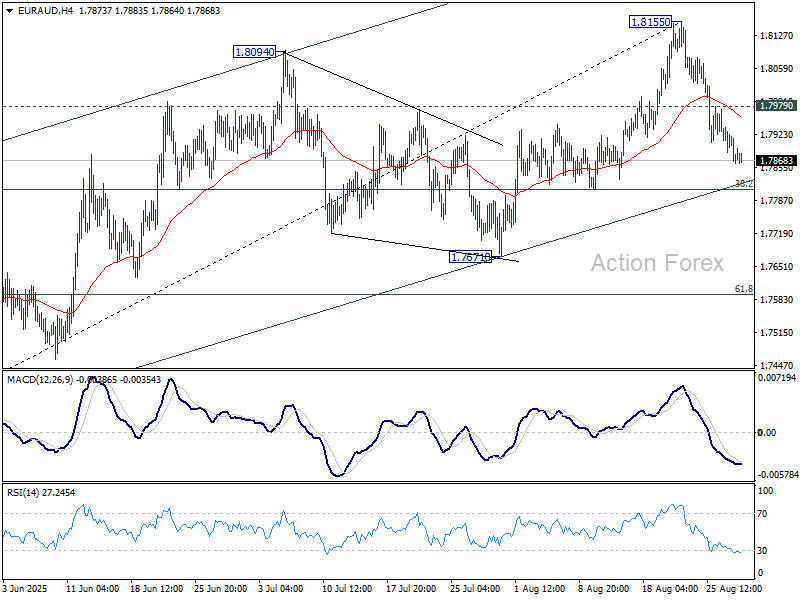
Daily Pivots: (S1) 1.7850; (P) 1.7904; (R1) 1.7943; More...
EUR/AUD's fall from 1.8155 short term top is in progress and intraday bias stays on the downside for 38.2% retracement of 1.7245 to 1.8155 at 1.7807. Sustained break there should confirm that whole rise from 1.7245 has completed. Corrective pattern from 1.8554 should then be in its third leg. Further decline should be seen to 61.8% retracement at 1.7593. On the upside, above 1.7979 minor resistance will turn intraday bias neutral first.
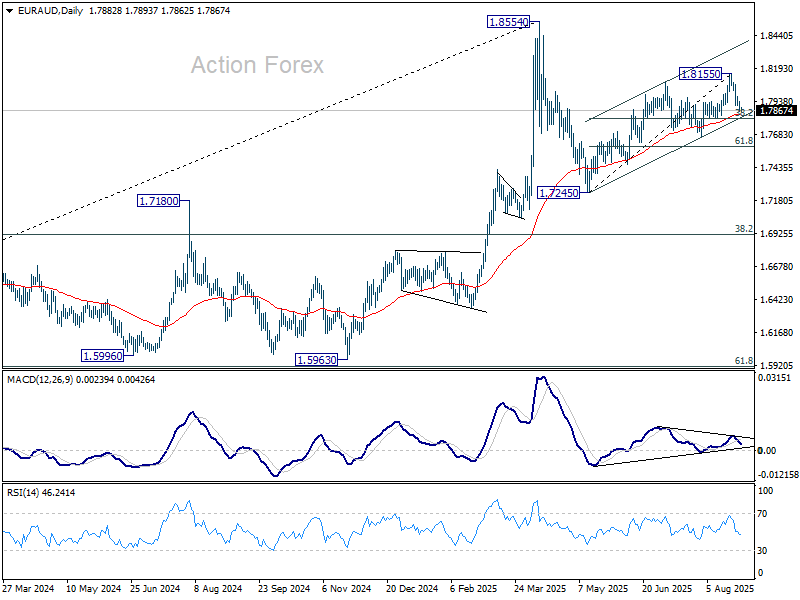
In the bigger picture, price actions from 1.8554 medium term top are seen as a corrective pattern. Such pattern could extend further with another falling leg. But even in that case, downside should be contained by 38.2% retracement of 1.4281 (2022 low) to 1.8554 at 1.6922 to bring rebound. Uptrend from 1.4281 is expected to resume at a later stage.
EUR/CHF Daily Outlook
Daily Pivots: (S1) 0.9308; (P) 0.9347; (R1) 0.9376; More....
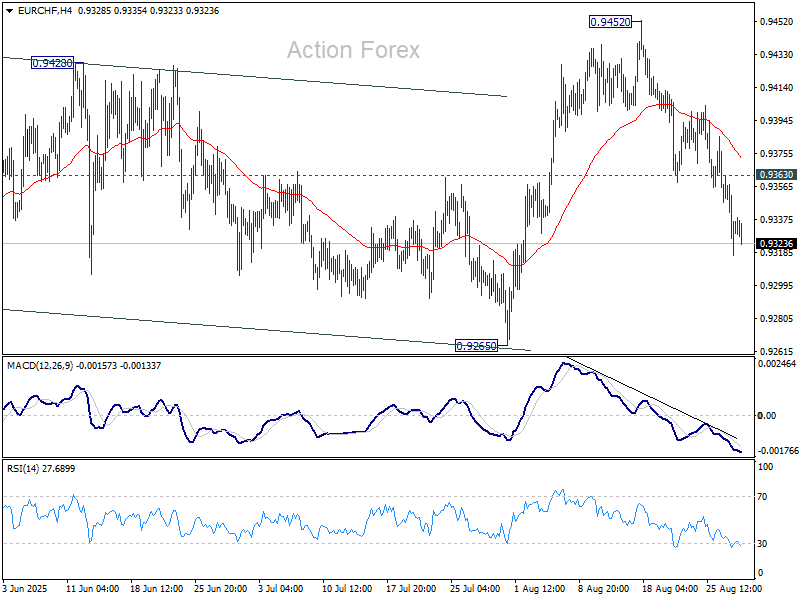
Fall from 0.9452 continues today and intraday bias stays on the downside. Corrective rebound from 0.9218 should have completed with three waves up to 0.9452. Break of 0.9265 support will confirm and bring retest of 0.9218 low. On the upside, above 0.9363 minor resistance will mix up the outlook and turn intraday bias neutral first.
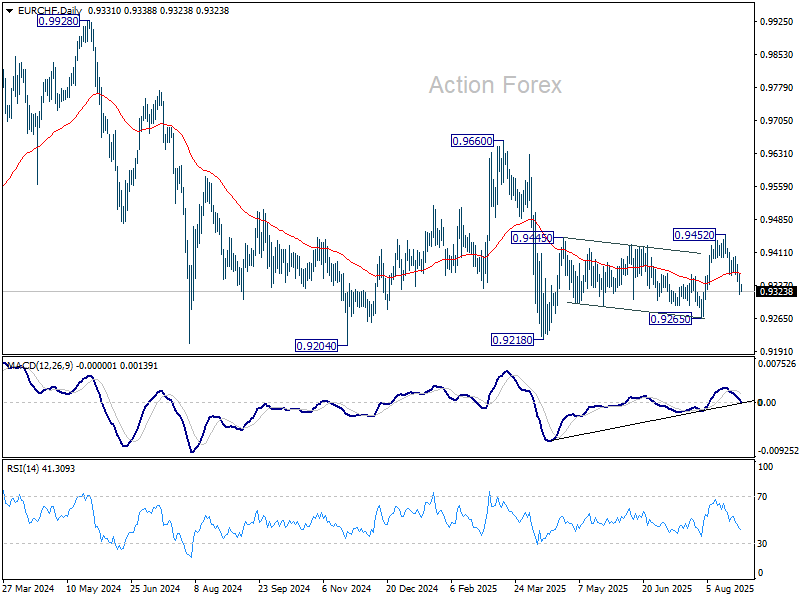
In the bigger picture, the down trend from 0.9204 (2018 high) might still be in progress considering that EUR/CHF is staying well inside the long term falling channel. However, with bullish convergence condition in W MACD, downside potential should be limited in case of another fall. Instead, firm break of 0.9660 resistance will be an important sign of medium term bullish trend reversal.
USD/CAD Daily Outlook
Daily Pivots: (S1) 1.3765; (P) 1.3811; (R1) 1.3840; More...
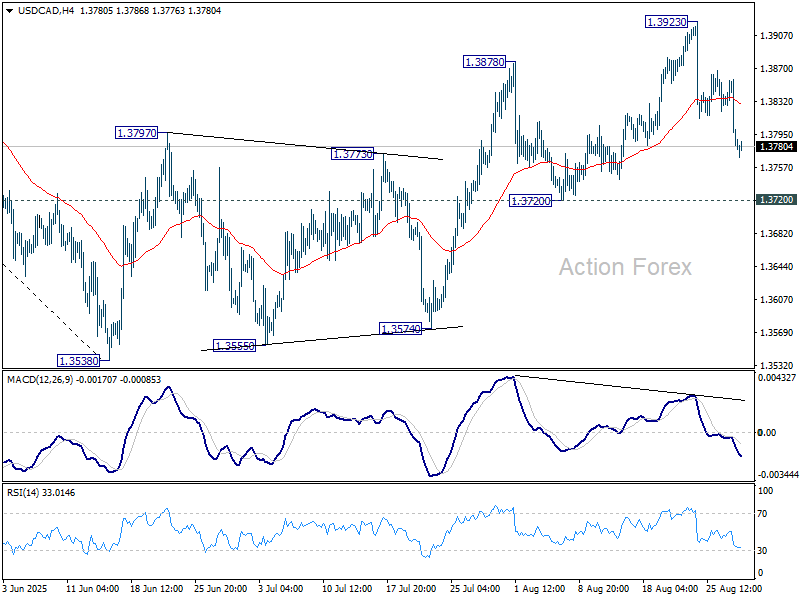
USD/CAD's pullback from 1.3923 extended lower, but it stays well above 1.3720 support so far. Intraday bias remains neutral first. On the upside, break of 1.3923 will extend the corrective rebound from 1.3538. But upside should be limited by 1.4014 cluster resistance (38.2% retracement of 1.4791 to 1.3538 at 1.4017). Meanwhile, firm break of 1.3720 will argue that the corrective bounce has already completed, and bring retest of 1.3538 low.
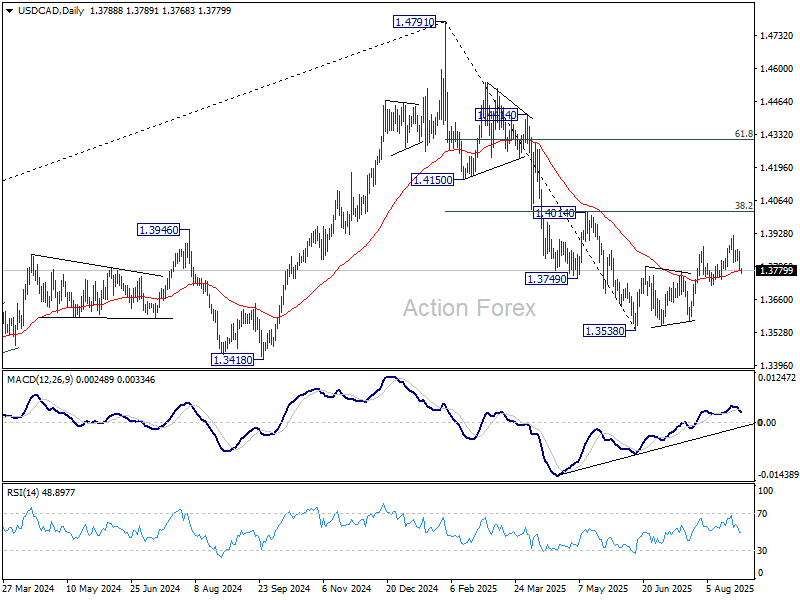
In the bigger picture, price actions from 1.4791 medium term top could either be a correction to rise from 1.2005 (2021 low), or trend reversal. In either case, further decline is expected as long as 1.4014 resistance holds. Next target is 61.8% retracement of 1.2005 (2021 low) to 1.4791 at 1.3069.
AUD/USD Daily Report
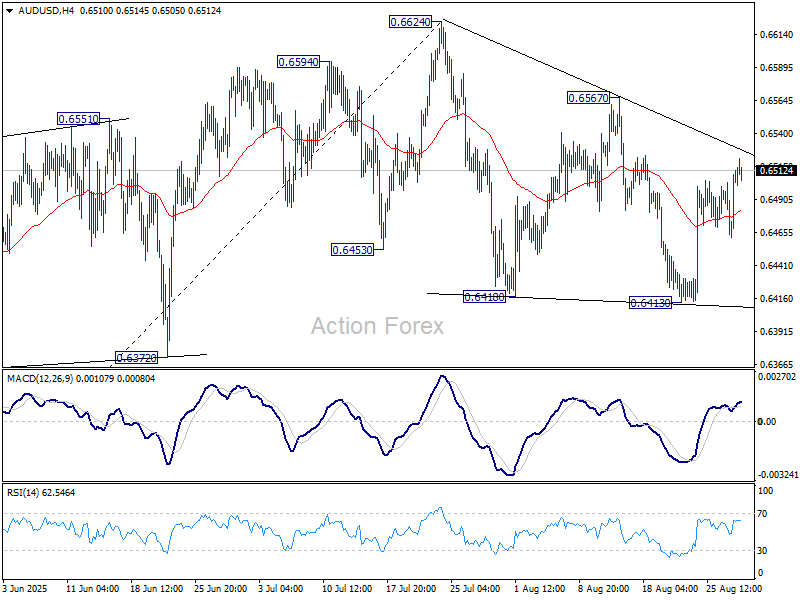
Daily Pivots: (S1) 0.6475; (P) 0.6494; (R1) 0.6525; More...
Intraday bias in AUD/USD remains neutral for the moment. Corrective pattern from 0.6624 could still extend further. On the upside, firm break of 0.6567 will argue that the correction has completed and bring retest of 0.6624 high. However, break of 0.6413 will extend the correction lower towards 38.2% retracement of 0.5913 to 0.6624 at 0.6352.
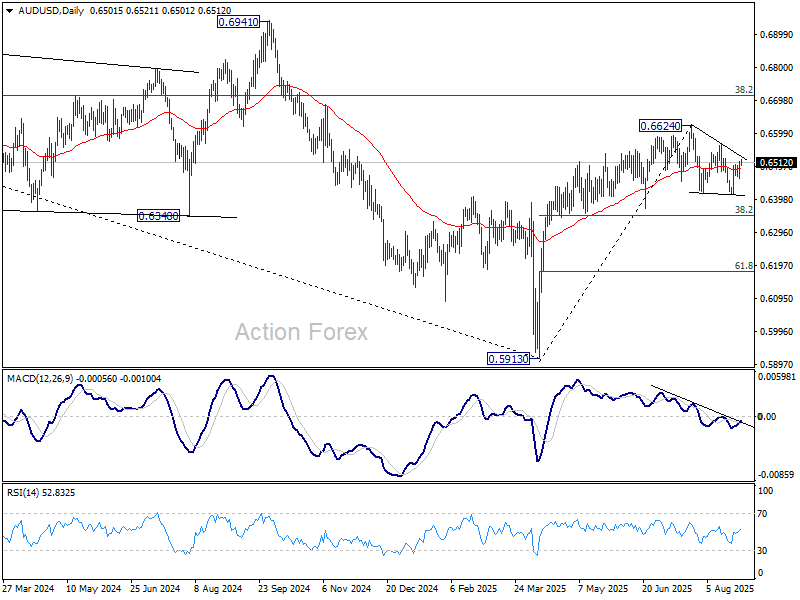
In the bigger picture, there is no clear sign that down trend from 0.8006 (2021 high) has completed. Rebound from 0.5913 is seen as a corrective move. While stronger rally cannot be ruled out, outlook will remain bearish as long as 38.2% retracement of 0.8006 to 0.5913 at 0.6713 holds. Nevertheless, considering bullish convergence condition in W MACD, even in case of another fall through 0.5913, downside should be contained above 0.5506 (2020 low).
EUR/USD Daily Outlook
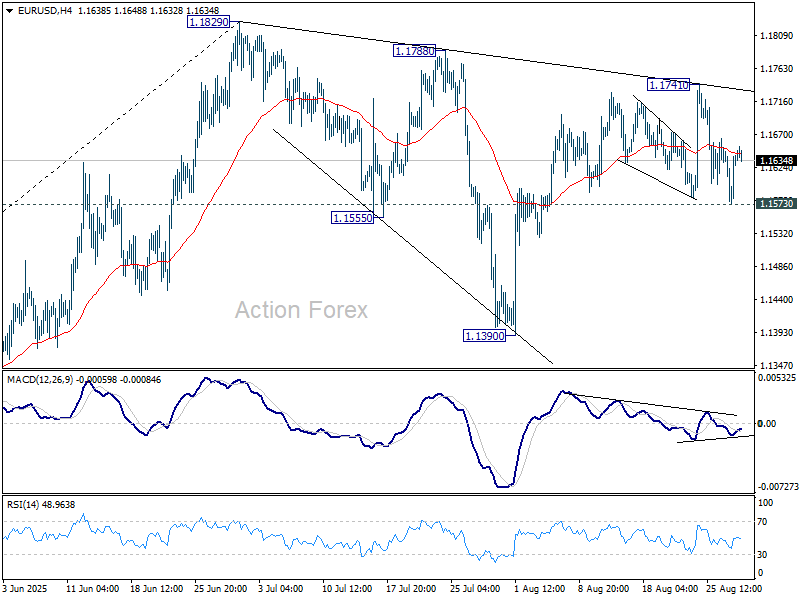
Daily Pivots: (S1) 1.1591; (P) 1.1621; (R1) 1.1668; More...
Intraday bias in EUR/USD stays neutral at this point. For now, further rise is in favor as long as 1.1573 support holds. Break of 1.1741 will resume the rally from 1.1390 to retest 1.1829 high. Firm break there will extend larger up trend. However, decisive break of 1.1573 will extend the corrective pattern from 1.1829 with another downleg, and target 1.1390.
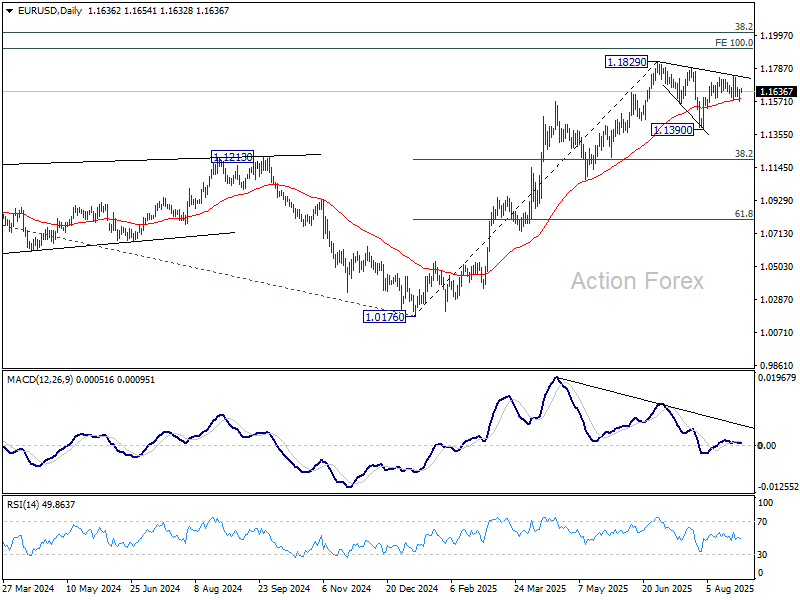
In the bigger picture, rise from 0.9534 long term bottom could be correcting the multi-decade downtrend or the start of a long term up trend. In either case, further rise should be seen to 100% projection of 0.9534 to 1.1274 from 1.0176 at 1.1916. This will remain the favored case as long as 1.1604 support holds.
GBP/USD Daily Outlook
Daily Pivots: (S1) 1.3443; (P) 1.3473; (R1) 1.3528; More...
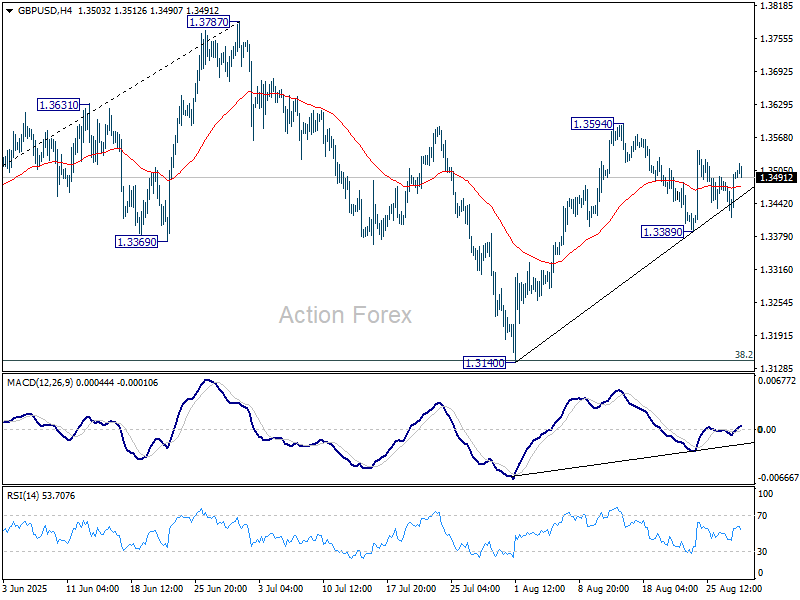
Intraday bias in GBP/USD remains neutral and further rise is mildly in favor as long as 1.3389 support holds. Above 1.3594 will resume the rebound from 1.3140 to retest 1.3787 high. On the downside, however, break of 1.3389 support will extend the corrective pattern from 1.3787 with another fall, and target 1.3140 support.
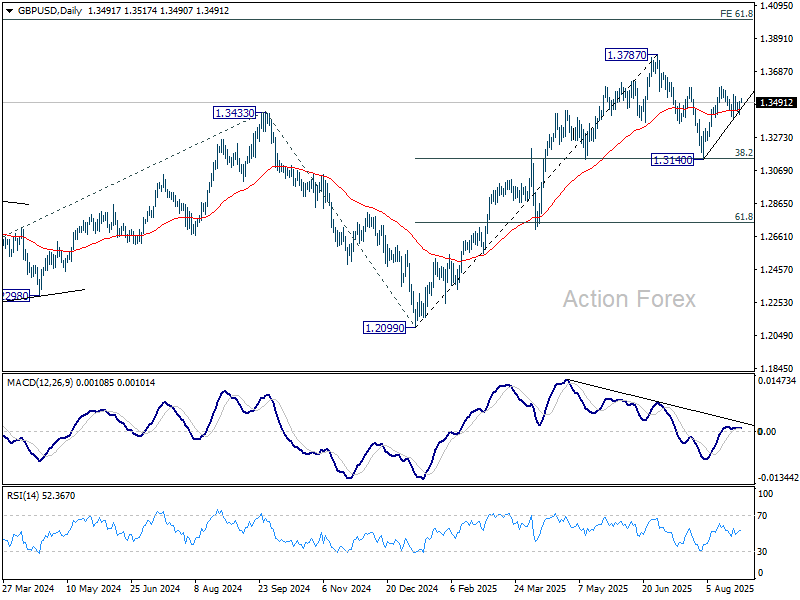
In the bigger picture, up trend from 1.3051 (2022 low) is in progress. Next medium term target is 61.8% projection of 1.0351 to 1.3433 from 1.2099 at 1.4004. Outlook will now stay bullish as long as 55 W EMA (now at 1.3073) holds, even in case of deep pullback.
USD/CHF Daily Outlook
Daily Pivots: (S1) 0.8001; (P) 0.8038; (R1) 0.8061; More….
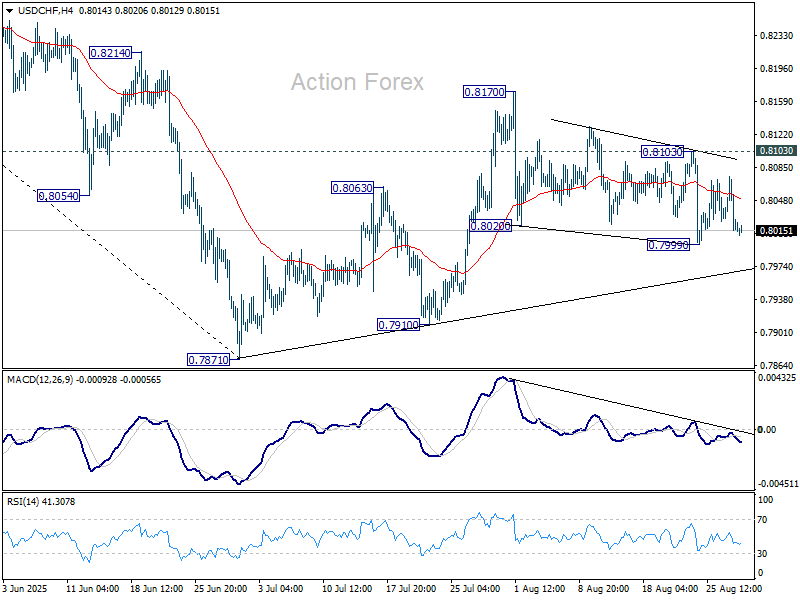
Intraday bias in USD/CHF stays neutral, and further decline is in favor with 0.8103 resistance intact. ON the downside, below 0.7999 will target a retest on 0.7871 low. However, break of 0.8103 will turn bias to the upside, and target 0.8170, to extend the corrective pattern from 0.7871.
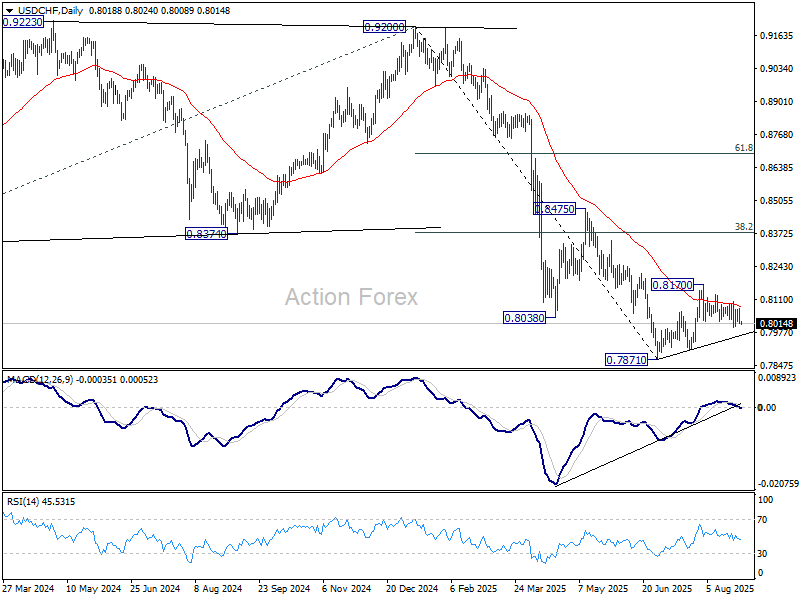
In the bigger picture, long term down trend from 1.0342 (2017 high) is still in progress. Next target is 100% projection of 1.0146 (2022 high) to 0.8332 from 0.9200 at 0.7382. In any case, outlook will stay bearish as long as 0.8475 resistance holds.
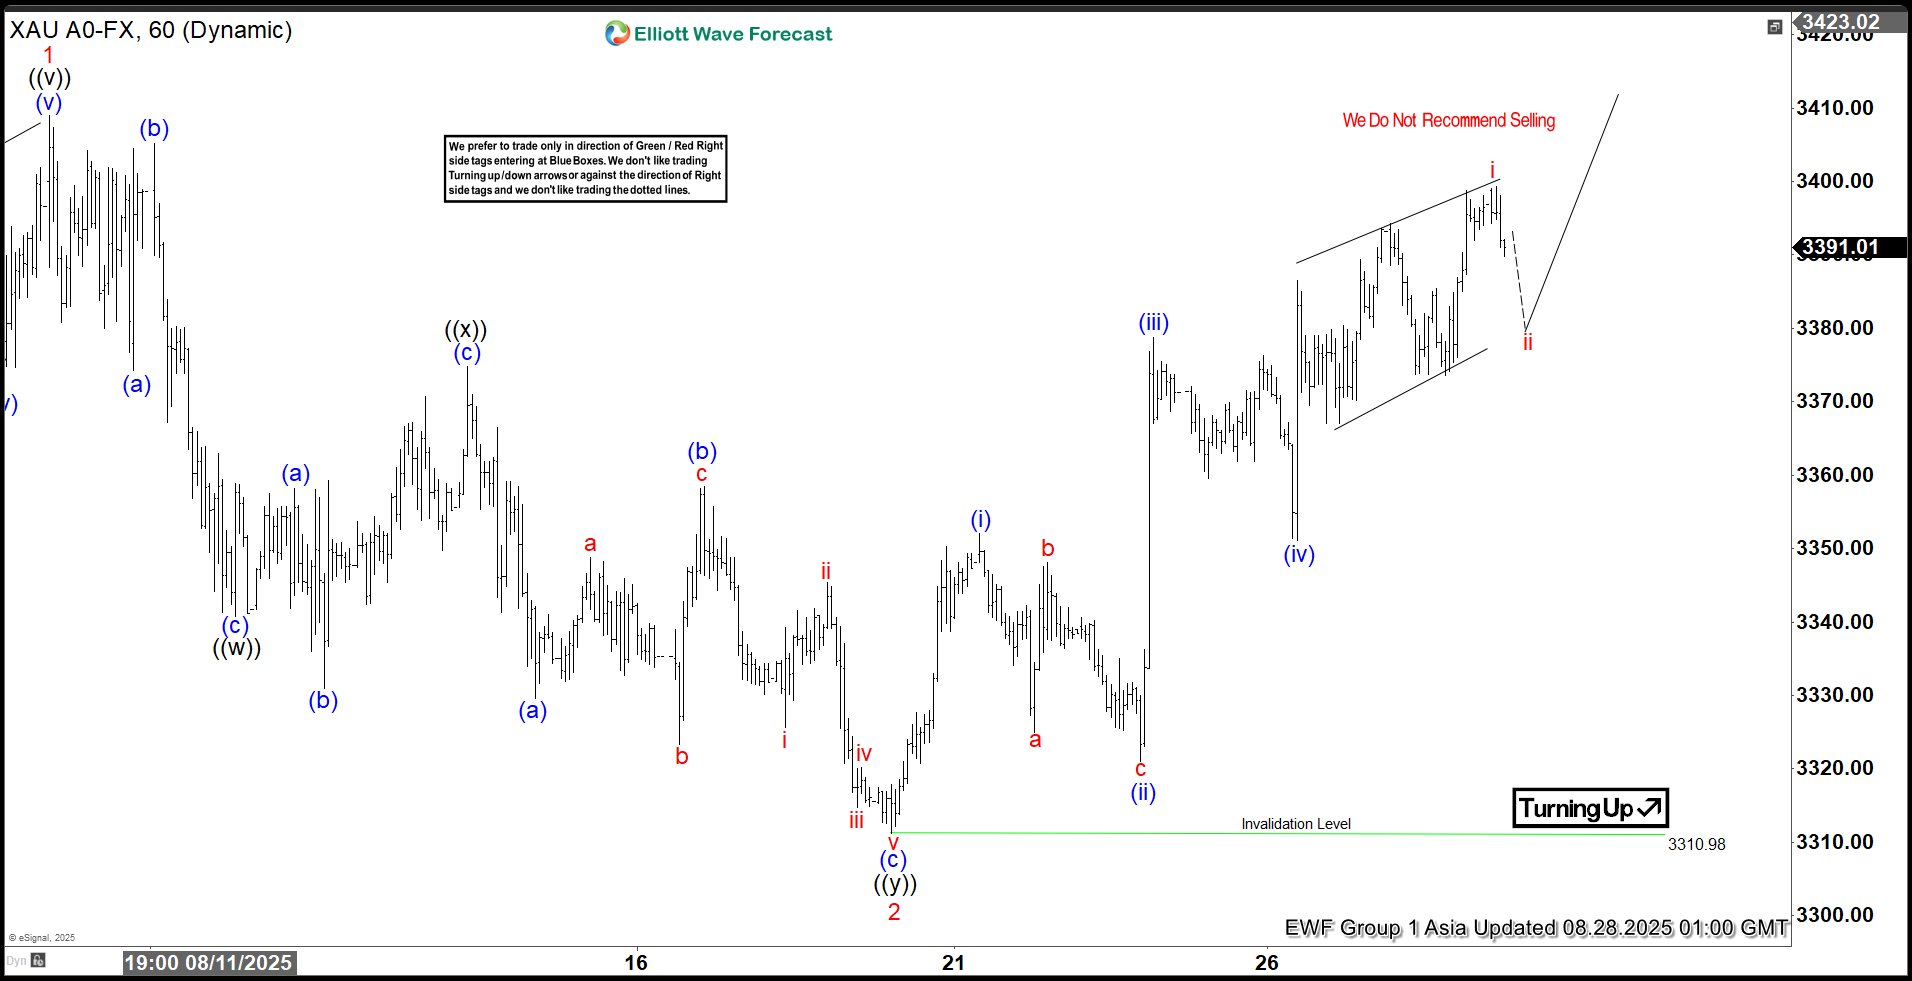
Elliott Wave Analysis: Gold (XAUUSD) Poised to Break Consolidation, Eyeing New Highs
The short-term Elliott Wave outlook for Gold (XAUUSD) indicates a sustained upward impulse from the July 31, 2025 low. The rally began with wave 1 peaking at 3409.4, followed by a wave 2 pullback concluding at 3311.26. This wave 2 correction formed a double three Elliott Wave pattern. Specifically, wave ((w)) declined to 3340.81, wave ((x)) rebounded to 3374.79, and wave ((y)) finalized at 3310.98, completing the higher-degree wave 2.
Gold has now advanced into wave 3, structured as a five-wave subdivision. From the wave 2 low, wave (i) reached 3352.12, with a brief wave (ii) dip to 3321.05. The subsequent wave (iii) climbed to 3378.8, and wave (iv) corrected to 3351.16. The metal is poised to extend higher, targeting two additional peaks to complete wave (v) of ((i)). After this, a correction from the August 20, 2025 low is likely in wave ((ii)) before the uptrend resumes. In the near term, as long as the 3310.98 pivot holds, dips should find support in a 3, 7, or 11 swing, fostering further upside. Gold’s bullish momentum remains intact, with the structure favoring new highs in the ongoing impulse sequence.
Gold (XAUUSD) – 60 Minute Elliott Wave Technical Chart:
XAUUSD – Elliott Wave Technical Video:
https://www.youtube.com/watch?v=VzE79yVKvdU
Accounts of ECB’s July Meeting Could Further Close Door for Another Rate Cut
Markets
Markets continued digesting this week’s mainly political event risk coming from the US and France. The US yield curve bull steepened with yields around 5 bps lower at the front end of the curve and broadly flat at the very long end. Apart from Fed Powell’s dovish pivot in Jackson Hole, markets start pricing the event risk in which US President Trump succeeds in ousting Fed governor Cook, setting a dangerous precedent and winning him a majority on the Washington Fed Board. The overarching aim is to keep policy rates low to help fund bloating public finances. In light of recent events, we wonder whether tomorrow’s PCE deflators (July), given risks for an upward surprise, will even matter to markets. The dies are cast for September (25 bps rate cut) it seems with markets starting to err on the side of consecutive moves lower. Next week’s payrolls report will be scrutinized for any signs of weakness. The dollar suffered a backlash during US trading hours on Treasuries’ outperformance, erasing earlier gains on the back of a weak euro: EUR/USD went back and forth between roughly 1.1640 and 1.1580. Underperformance of French OAT’s pushed the 10-yr French swap spread to 86 bps (88 bps YtD high early January) and weighs on the single currency. The spread added 10 bps since PM Bayrou announced the doomed-to-lose confidence vote over fiscal plans spelled out in July. New parliamentary elections are becoming ever more likely, but possibly unable to resolve the current paralysis in French politics while huge budget deficits and the spiraling debt ratio call for action. French OAT’s are now even converging to Italian BTP’s (10-yr BTP swap spread at 91 bps).
Revisions to the second quarter US GDP number and weekly jobless claims feature today’s agenda, but won’t impact markets. Accounts of the ECB’s July policy meeting could further close the door for another rate cut later this year. The US Treasury end its refinancing operation with a $44bn 7-yr Note sale. Yesterday’s 5-yr sale tailed slightly after a strong 2-yr deal on Tuesday. Lingering themes exploited above will continue to set the tone for both risk sentiment and overall trading. AI-bellwether Nvidia published good results after market close yesterday. It’s shares currently correct 2.75% lower in after-market trading. This contained reaction suggests limited spill-over to general sentiment.
News & Views
The Bank of Korea as expected left its policy rate unchanged for a second consecutive meeting this morning at 2.5%. The decision was taken by a 6-1 vote, with one member dissenting in favour of 25 bps rate cut. Regarding domestic economic growth, the BoK indicates that growth has improved due to a recovery in consumption and due to a better than expected increase in exports. Demand is expected to support a modest recovery. Exports might gradually slow due to the impact of US tariffs. The BoK upwardly revised its growth outlook for this year to 0.9% from 0.8%. The outlook for next year was left unchanged at 1.6%. CPI inflation was 2.1% in July and core inflation 2%. CPI inflation is expected at 2% this year. Overall and core CPI are seen at 1.9% next year, slightly up from the previous forecast of 1.8%. The Board will maintain its rate cut stance with governor Rhee saying that 5 of the 6 members are open to a rate cut in the next three months. At the same time, the BoK further assesses financial stability issues related to the housing price appreciation in the Seoul area and household debt growth, even as those issues have moderated of late. The won this morning gained modestly to USD/KRW 1387, but holds its recent consolidation pattern.
The Dutch caretaker government of PM Dick Schoof survived a no-confidence vote in Parliament yesterday. Only two smaller parties supported the no-confidence motion. However, even the after this vote the political deadlock in the country persists. The caretaker government has the support of 32 of the 150 seats in Parliament. In this respect, the cabinet needs relies on parliament on a case by case basis in the upcoming period toward snap elections scheduled for October 29. However, even after those elections, it might still be complicated to form a new government due to political fragmentation. For now, there was only a limited rise in the credit spread of the Netherlands over Germany (currently 19 bps).