
Sample Category Title
Why is EURUSD falling even though the Fed has softened its rhetoric?
EURUSD has fallen back below 1.1600, quickly losing Friday’s momentum and forming its third lower local peak since the beginning of July. Trade flows and expectations of weaker growth due to tariffs could bring the pair back to the lows of the end of last year or push it below parity.
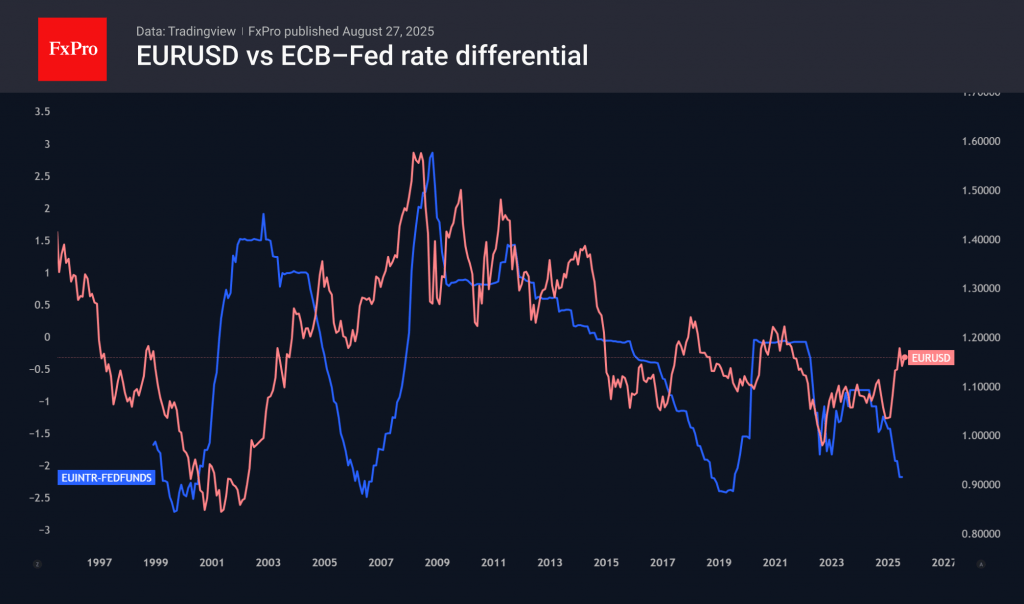
🟦 Blue line – ECB–Fed rate differential
- This measures the gap between the European Central Bank’s main refinancing rate and the U.S. Federal Funds rate.
- When the blue line rises, it means the ECB’s rate is moving higher relative to the Fed’s, narrowing or reversing the U.S. rate advantage.
- When it falls, the Fed’s rate advantage is widening.
🔴 Red line – EURUSD exchange rate
This dynamic contrasts with the news agenda, according to which the differential between the ECB and Fed key rates will soon begin to shift in favour of the former, as the ECB is close to completing its cycle of rate cuts and the Fed is ready to resume its easing.
But there is a perfectly reasonable explanation: trade flows. The EURUSD gained momentum sharply at the beginning of the year as US companies and consumers rushed to buy before tariffs were raised. Now we are at the point of the reverse process, when imports will be below the norm of recent years. Moreover, long-term fundamental factors are coming into play, such as suppressing production in Europe and supporting it in the US. The same shift from the dollar to the euro occurred in 2017, when the first trade conflicts began, and continued until March 2018, when tariffs were introduced.
The eurozone can counter this trend through further rate cuts or government financial incentives. Due to chronic budget deficits, the former is more likely. The Fed’s rate is now 2.2 percentage points higher than the ECB’s, above previous turning points of 2.7 points in 1999, 2.5 in 2006 and 2.4 in 2019.
This approach is supported by rising inflation in the US versus deteriorating activity in Europe. Fundamental factors alone could push EURUSD to last December’s lows or even below parity, which we last saw in September 2022.
However, traders in the market are dealing with a reality in which Washington is increasing pressure on the Fed, calling for a sharper rate cut. In extreme cases, this threatens to repeat the 33% rally in EURUSD between November 2005 and March 2008. In this case, the single currency could fall to the 1.40 level, which has not been reached for the last 11 years.
Nevertheless, we consider political interference in monetary policy a risk. The main scenario is based on a balance of fundamental forces, which are currently bearish for EURUSD.
USD/JPY Mid-Day Outlook
Daily Pivots: (S1) 146.97; (P) 147.45; (R1) 147.92; More...
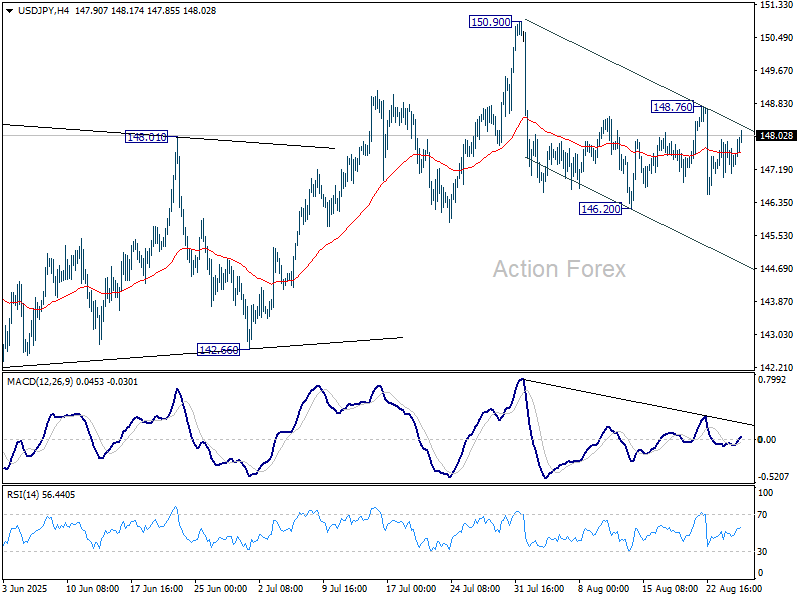
Intraday bias in USD/JPY remains neutral for the moment. On the downside, firm break of 146.20 will resume the fall from 150.90. Also, that would argue that rebound from 139.87 has completed as a corrective move to 150.90. Deeper fall should be seen to 142.667 support for confirmation. On the upside, above 148.76 will bring another rise to retest 150.90 instead.
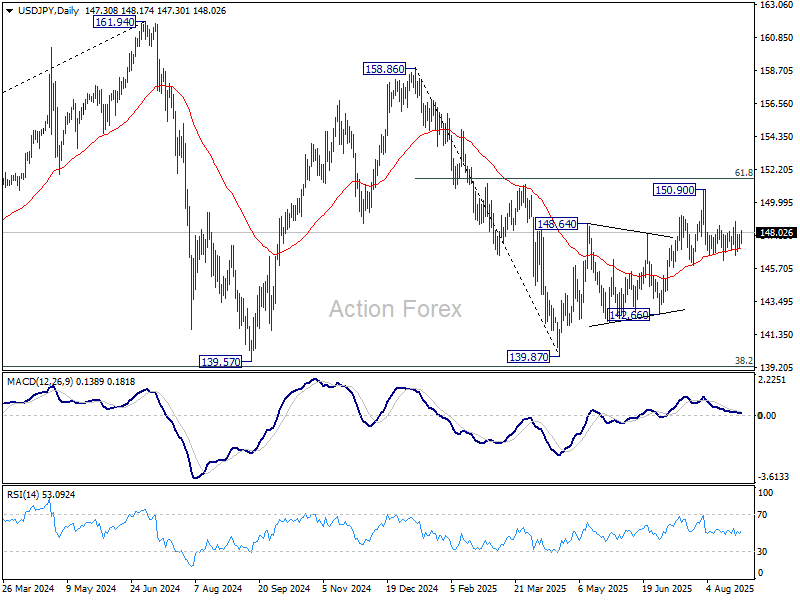
In the bigger picture, price actions from 161.94 (2024 high) are seen as a corrective pattern to rise from 102.58 (2021 low). Decisive break of 61.8% retracement of 158.86 to 139.87 at 151.22 will argue that it has already completed with three waves at 139.87. Larger up trend might then be ready to resume through 161.94 high. In case the corrective pattern extends with another fall, strong support is expected from 38.2% retracement of 102.58 to 161.94 at 139.26 to bring rebound.
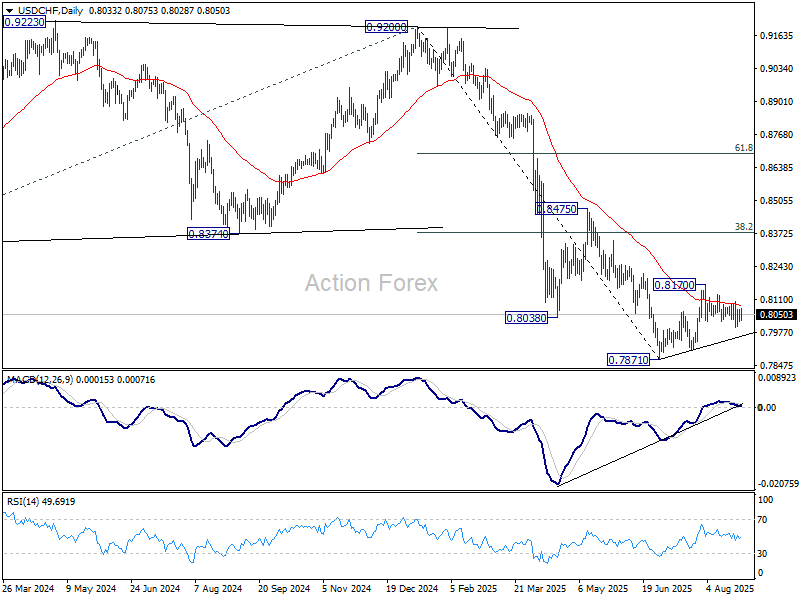
USD/CHF Mid-Day Outlook
Daily Pivots: (S1) 0.8016; (P) 0.8045; (R1) 0.8063; More….
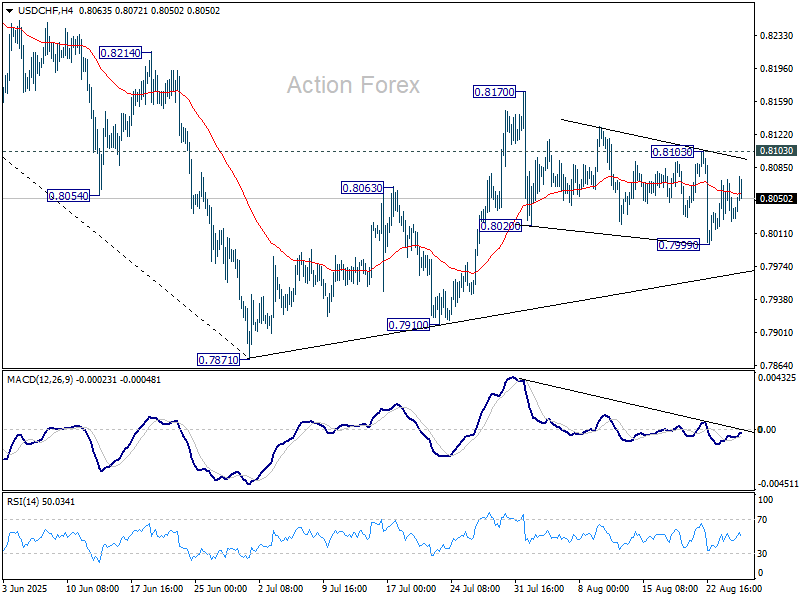
Intraday bias in USD/CHF remains neutral for the moment. Another fall is in favor as long as 0.8103 resistance holds. Below 0.7999 will target a retest on 0.7871 low. However, break of 0.8103 will turn bias to the upside, and target 0.8170, to extend the corrective pattern from 0.7871.
In the bigger picture, long term down trend from 1.0342 (2017 high) is still in progress. Next target is 100% projection of 1.0146 (2022 high) to 0.8332 from 0.9200 at 0.7382. In any case, outlook will stay bearish as long as 0.8475 resistance holds.
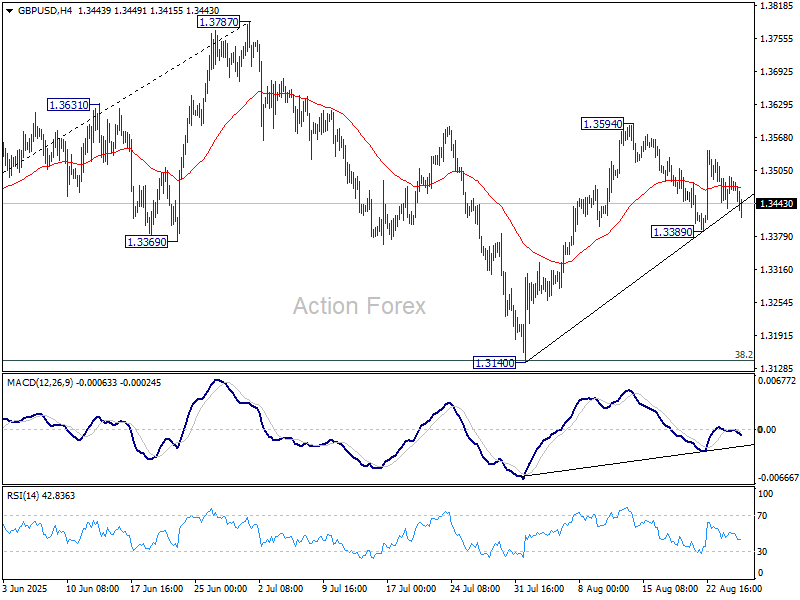
GBP/USD Mid-Day Outlook
Daily Pivots: (S1) 1.3444; (P) 1.3469; (R1) 1.3504; More...
Intraday bias in GBP/USD stays neutral for the moment. Overall, price actions from 1.3787 high are seen as a corrective pattern. On the upside, break of 1.3594 will resume the rebound from 1.3140 to retest 1.3787 high. Firm break there will resume the larger up trend. However, break of 1.3389 will bring deeper fall towards 1.3140 to extend the corrective pattern.
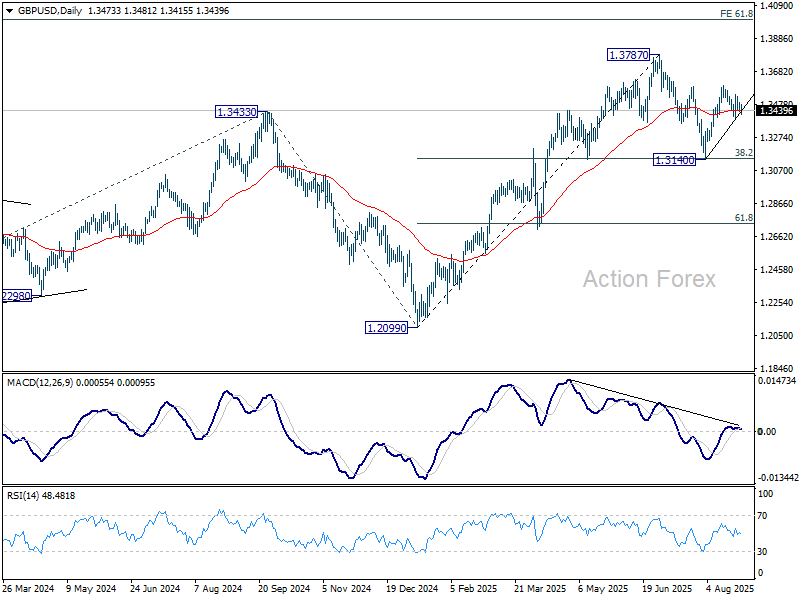
In the bigger picture, up trend from 1.3051 (2022 low) is in progress. Next medium term target is 61.8% projection of 1.0351 to 1.3433 from 1.2099 at 1.4004. Outlook will now stay bullish as long as 55 W EMA (now at 1.3073) holds, even in case of deep pullback.
EUR/USD Mid-Day Outlook
Daily Pivots: (S1) 1.1607; (P) 1.1636; (R1) 1.1670; More...
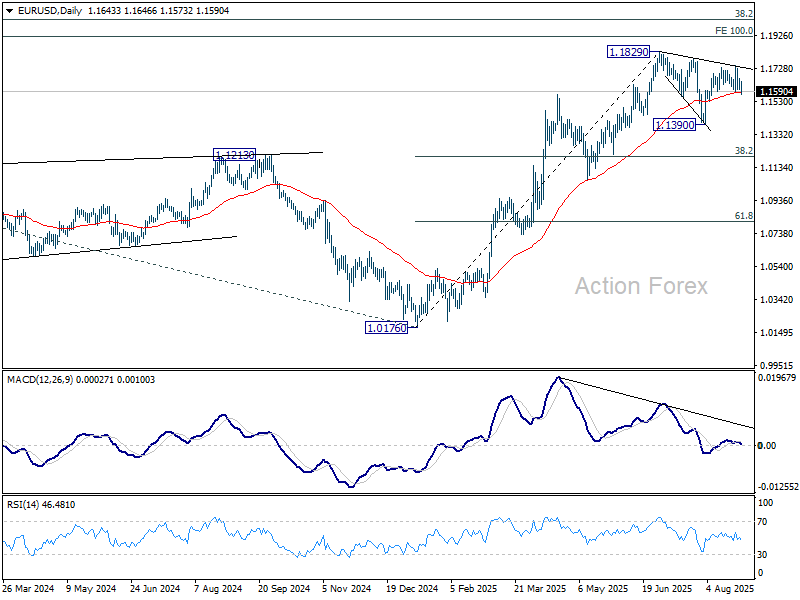
EUR/USD breached 1.1582 support briefly but cannot sustain below the level yet. Intraday bias stays neutral first. On the upside, above 1.1741 will resume the rally from 1.1390 to retest 1.1829 high. Firm break there will extend larger up trend. However, decisive break of 1.1582 will extend the corrective pattern from 1.1829 with another downleg, and target 1.1390.
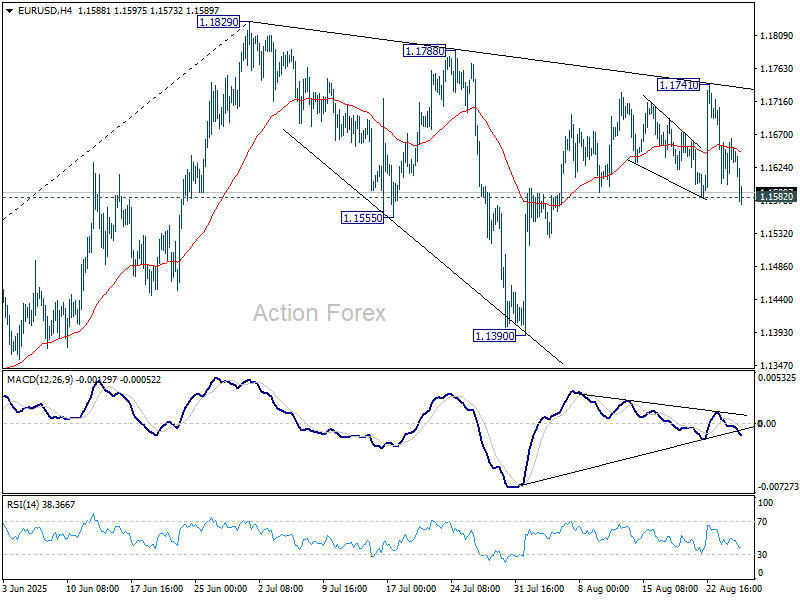
In the bigger picture, rise from 0.9534 long term bottom could be correcting the multi-decade downtrend or the start of a long term up trend. In either case, further rise should be seen to 100% projection of 0.9534 to 1.1274 from 1.0176 at 1.1916. This will remain the favored case as long as 1.1604 support holds.
Dollar Holds Firm in Quiet Trade, EU Moves to Accelerate Tariff Cuts
Dollar firmed again today in what remains a subdued week for markets, with no top-tier European economic data releases so far and little central bank commentary on the docket. The summer lull has left trading ranges tight, and with nothing scheduled during the US session, conditions are expected to remain muted.
For the week so far, Dollar continues to hold the top spot in FX performance, followed by Loonie and Aussie. At the other end, the Euro has been the weakest, trailed by Yen and Kiwi, while the Swiss Franc and Sterling sit in the middle of the pack.
Attention in Europe turned to trade developments. According to Bloomberg, the European Union is preparing to fast-track legislation to remove tariffs on U.S. industrial goods. The move comes after Washington insisted that lower duties on EU autos and parts would only take effect once Brussels acted to eliminate industrial tariffs more broadly.
Currently, European cars and auto parts face a steep 27.5% U.S. tariff. While the U.S. and EU agreed last month on a framework that would lower tariffs on nearly all EU exports to 15%, US President Donald Trump stressed that autos were excluded until the EU presented legislative changes. If Brussels delivers by month-end, the tariff rate on cars would be retroactively reduced to 15% effective August.
Still, the German Chambers of Industry and Commerce, DIHK, urged caution. In its August survey, firms stressed the need for a consistent strategy from EU policymakers, arguing that the bloc must not compromise its “economic sovereignty” for short-term trade concessions.
Negotiations between Washington and Brussels remain ongoing. While the July framework and subsequent joint statement offered progress, significant uncertainty persists over tariff treatment for metals and cars, leaving exporters wary. DIHK added that the EU should be ready to use countermeasures if needed, while continuing to push for the eventual abolition of tariffs deemed inconsistent with WTO rules.
In Europe, at the time of writing, FTSE is flat. DAX Is down -0.08%. CAC is up 0.44%. UK 10-year yield is down -0.024 at 4.721. Germany 10-year yield is down -0.018 at 2.712. Earlier in Asia, Nikkei rose 0.30%. Hong Kong HSI fell -1.27%. China Shanghai SSE fell -1.76%. Singapore Strait Times rose 0.04%. Japan 10-year JGB yield rose 0.001 to 1.627.
German Gfk consumer confidence falls to -23.6 on job fears
Germany’s GfK Consumer Sentiment index for September dropped to -23.6 from -21.7, falling short of expectations at -21.2. It was the third consecutive monthly decline, with NIM’s Rolf Bürkl describing sentiment as “definitely in the summer slump.”
The key driver was a sharp fall in income expectations as worries about job security intensified. Registered unemployment remained just below three million in July, but analysts expect that mark to be breached in August. Consumers’ expectations of rising unemployment have reached their highest level of the year.
Australia CPI jumps to 2.8%, highest in a year, rules out September RBA cut
Australia’s monthly CPI spiked to 2.8% yoy in July, well above expectations of 2.3% yoy and up sharply from 1.9% yoy in June. It was the highest annual inflation rate since July 2024, breaking several months of easing price pressures. Core measures also firmed, with CPI excluding volatile items rising from 2.5% yoy to 3.2% yoy and trimmed mean jumping back from 2.1% yoy to 2.7% yoy, a pace last seen three months ago.
The result adds to concern that inflation is proving sticky, though July’s data, as the first month of the quarter, is skewed toward goods and offers less insight into services inflation than subsequent months.
For the RBA, the print is a warning sign but not a trigger for panic. Policymakers will want to wait for the full quarterly inflation update before adjusting course. Today’s data nonetheless rules out a September cut.
Barring a significant deterioration in the labor market or other downside shocks, the more realistic timeline for the next rate move remains November.
EUR/USD Mid-Day Outlook
Daily Pivots: (S1) 1.1607; (P) 1.1636; (R1) 1.1670; More...
EUR/USD breached 1.1582 support briefly but cannot sustain below the level yet. Intraday bias stays neutral first. On the upside, above 1.1741 will resume the rally from 1.1390 to retest 1.1829 high. Firm break there will extend larger up trend. However, decisive break of 1.1582 will extend the corrective pattern from 1.1829 with another downleg, and target 1.1390.
In the bigger picture, rise from 0.9534 long term bottom could be correcting the multi-decade downtrend or the start of a long term up trend. In either case, further rise should be seen to 100% projection of 0.9534 to 1.1274 from 1.0176 at 1.1916. This will remain the favored case as long as 1.1604 support holds.
Leading Altcoins Once Again Attempting to Pull Crypto Market Upwards
Market Overview
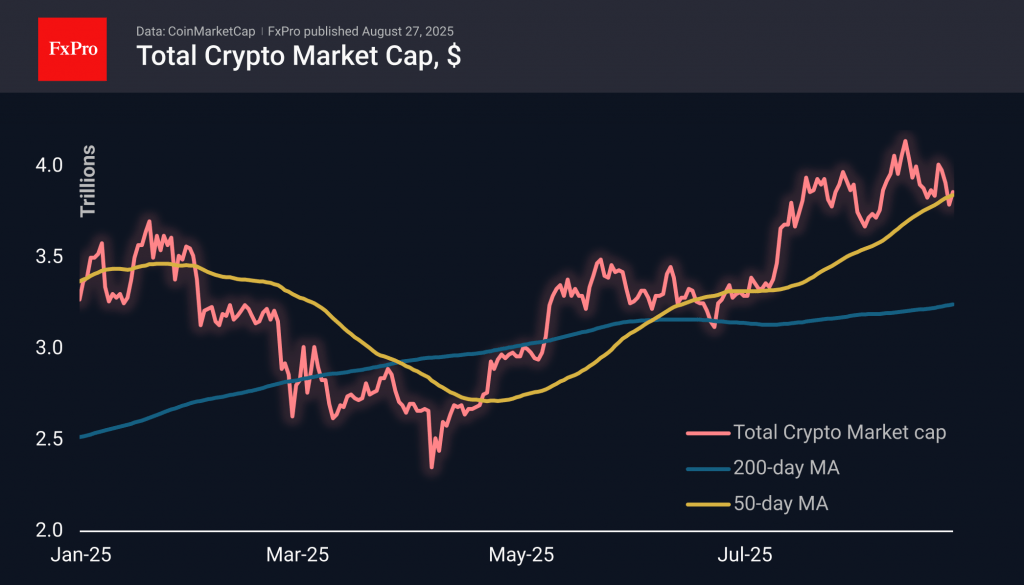
The crypto market capitalisation has increased by almost 2% to $3.86 trillion over the past 24 hours due to the traction of major altcoins such as Ethereum (+4%), XRP (+3%), Solana (+7.8%), and Dogecoin (+4.9%). Crypto enthusiasts were expecting a different altcoin season, but it is still worth noting their outperformance relative to the first cryptocurrency.
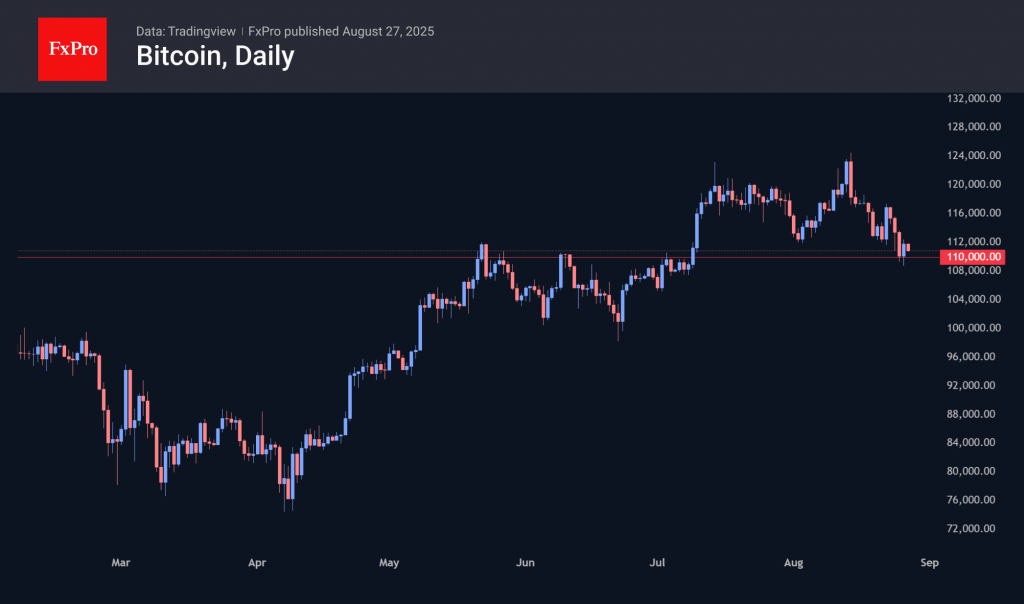
Bitcoin gained 1% to $111K during the day after spending most of Tuesday forming the basis for a rebound on dips below $110K. This is an important indicator of interest in buying on dips, which probably encouraged more risk-tolerant altcoin buyers. The former is also lagging the stock market, where the S&P500 is on the verge of historic highs, and the Nasdaq100 is 1.8% below its historic high.
News Background
The Bitcoin derivatives market points to pessimistic sentiment, as market participants are actively buying put options.
New investors are selling Bitcoin at a loss. In this way, the market is getting rid of ‘weak hands’ and preparing a support base for future growth, notes analyst Crazzyblockk.
GLJ Research head Gordon Johnson said that BTC is at risk of a 65% collapse due to a reduction in dollar liquidity in the US financial system for the first time since 2022. Only the Fed’s abandonment of quantitative tightening (QT) and a return to new quantitative easing (QE) can remedy the situation.
According to Bitfinex, the altcoin season will not start until new cryptocurrency ETFs are approved. It is only expected to begin at the end of the year. The SEC is currently reviewing more than 70 applications to launch altcoin-based ETFs.
Citi warns that paying interest on stablecoin deposits could cause a massive outflow of deposits from the banking system. A similar situation was observed during the money market fund boom in the United States in the 1980s.
The CRO token, associated with Crypto.com’s Cronos blockchain project, jumped 25% on Tuesday after the announcement of a major partnership with Trump Media. The parties will create Trump Media Group CRO Strategy, a digital asset management company focused on acquiring CRO.
Australian Inflation Surges, Aussie Dips
The Australian dollar is in negative territory on Wednesday. In the European session, AUD/USD is trading at 0.6468, down 0.40% on the day.
Australian CPI jumps to 2.8%
Australia's CPI for July surprised on the upside, jumping to 2.8% y/y. This followed a 1.9% gain in June and was above the market estimate of 2.3%. The spike in inflation, the highest level since July 2024, was driven by a sharp increase in electricity prices due to the end of government electricity rebates for many households. The trimmed mean, a key gauge of core CPI, rose to 2.7% in July from 2.1% in June.
The surprise jump in inflation has dampened expectations for a September rate cut. The money markets have reduced the probability of a rate cut to 22%, down from 30% before the inflation release.
Despite the hot inflation report, the Reserve Bank is expected to continue its easing cycle, with a 61% probability of a cut in November. The central bank remains very concerned about inflation but is also focused on employment, with the labor market showing signs of weakening.
The minutes of the RBA's August meeting said that upcoming rate decisions would depend on the data. The RBA meets next on September 19 and there are three key releases in September prior to the meeting - inflation, GDP and employment. The RBA has surprised the markets before and if these upcoming releases show a drop in economic activity or inflation, the RBA could respond with a rate cut next month.
Trump says he has fired Fed Governor
The nasty feud between the Federal Reserve and Donald Trump has taken another twist, as the President said he had removed Fed Governor Lisa Cook due over charges that she made false statements on mortgage applications. The Fed says that Trump does not have authority to fire Cook. This latest spat further undermines the credibility of the US and could hurt the US dollar.
AUD/USD Technical
- AUD/USD has dropped below support at 0.6486 and is testing 0.6476. Below, there is support at at 0.6460
- There is resistance at 0.6502 and 0.6512

AUD/USD 4-Hour Chart, August 27, 2025
Gold Surges Amid Mounting Global Risks
The price of gold reached 3,383 USD per ounce on Wednesday, trading near a two-week high. The rally is being driven by strong demand for safe-haven assets, fuelled by growing concerns over the independence of the US Federal Reserve.
US President Donald Trump has signalled a potential legal battle following the resignation of Federal Reserve Board member Lisa Cook, whom he had accused of misconduct. Her departure has reignited debates about the central bank's autonomy and the issue of political pressure. Cook's exit could accelerate the timing of interest rate cuts, aligning with Trump's public calls for a more accommodative monetary policy. Market pricing currently indicates an approximately 80% probability of a 25-basis-point rate cut by the Fed in September.
Trade tensions have further contributed to market unease. US authorities stated that a trade agreement with India before a key deadline is unlikely, which could result in tariffs on Indian goods doubling to 50%. Conversely, Indonesia has secured an exemption from tariffs on a range of raw materials. Simultaneously, Trump has threatened to impose severe tariffs on Chinese exports of rare earth metals, significantly escalating tensions between the two economic superpowers.
Political risks are also intensifying in Europe. The French Prime Minister continues to promote an austerity plan ahead of a crucial confidence vote, creating additional political uncertainty in the region.
Technical Analysis: XAU/USD
H4 Chart:
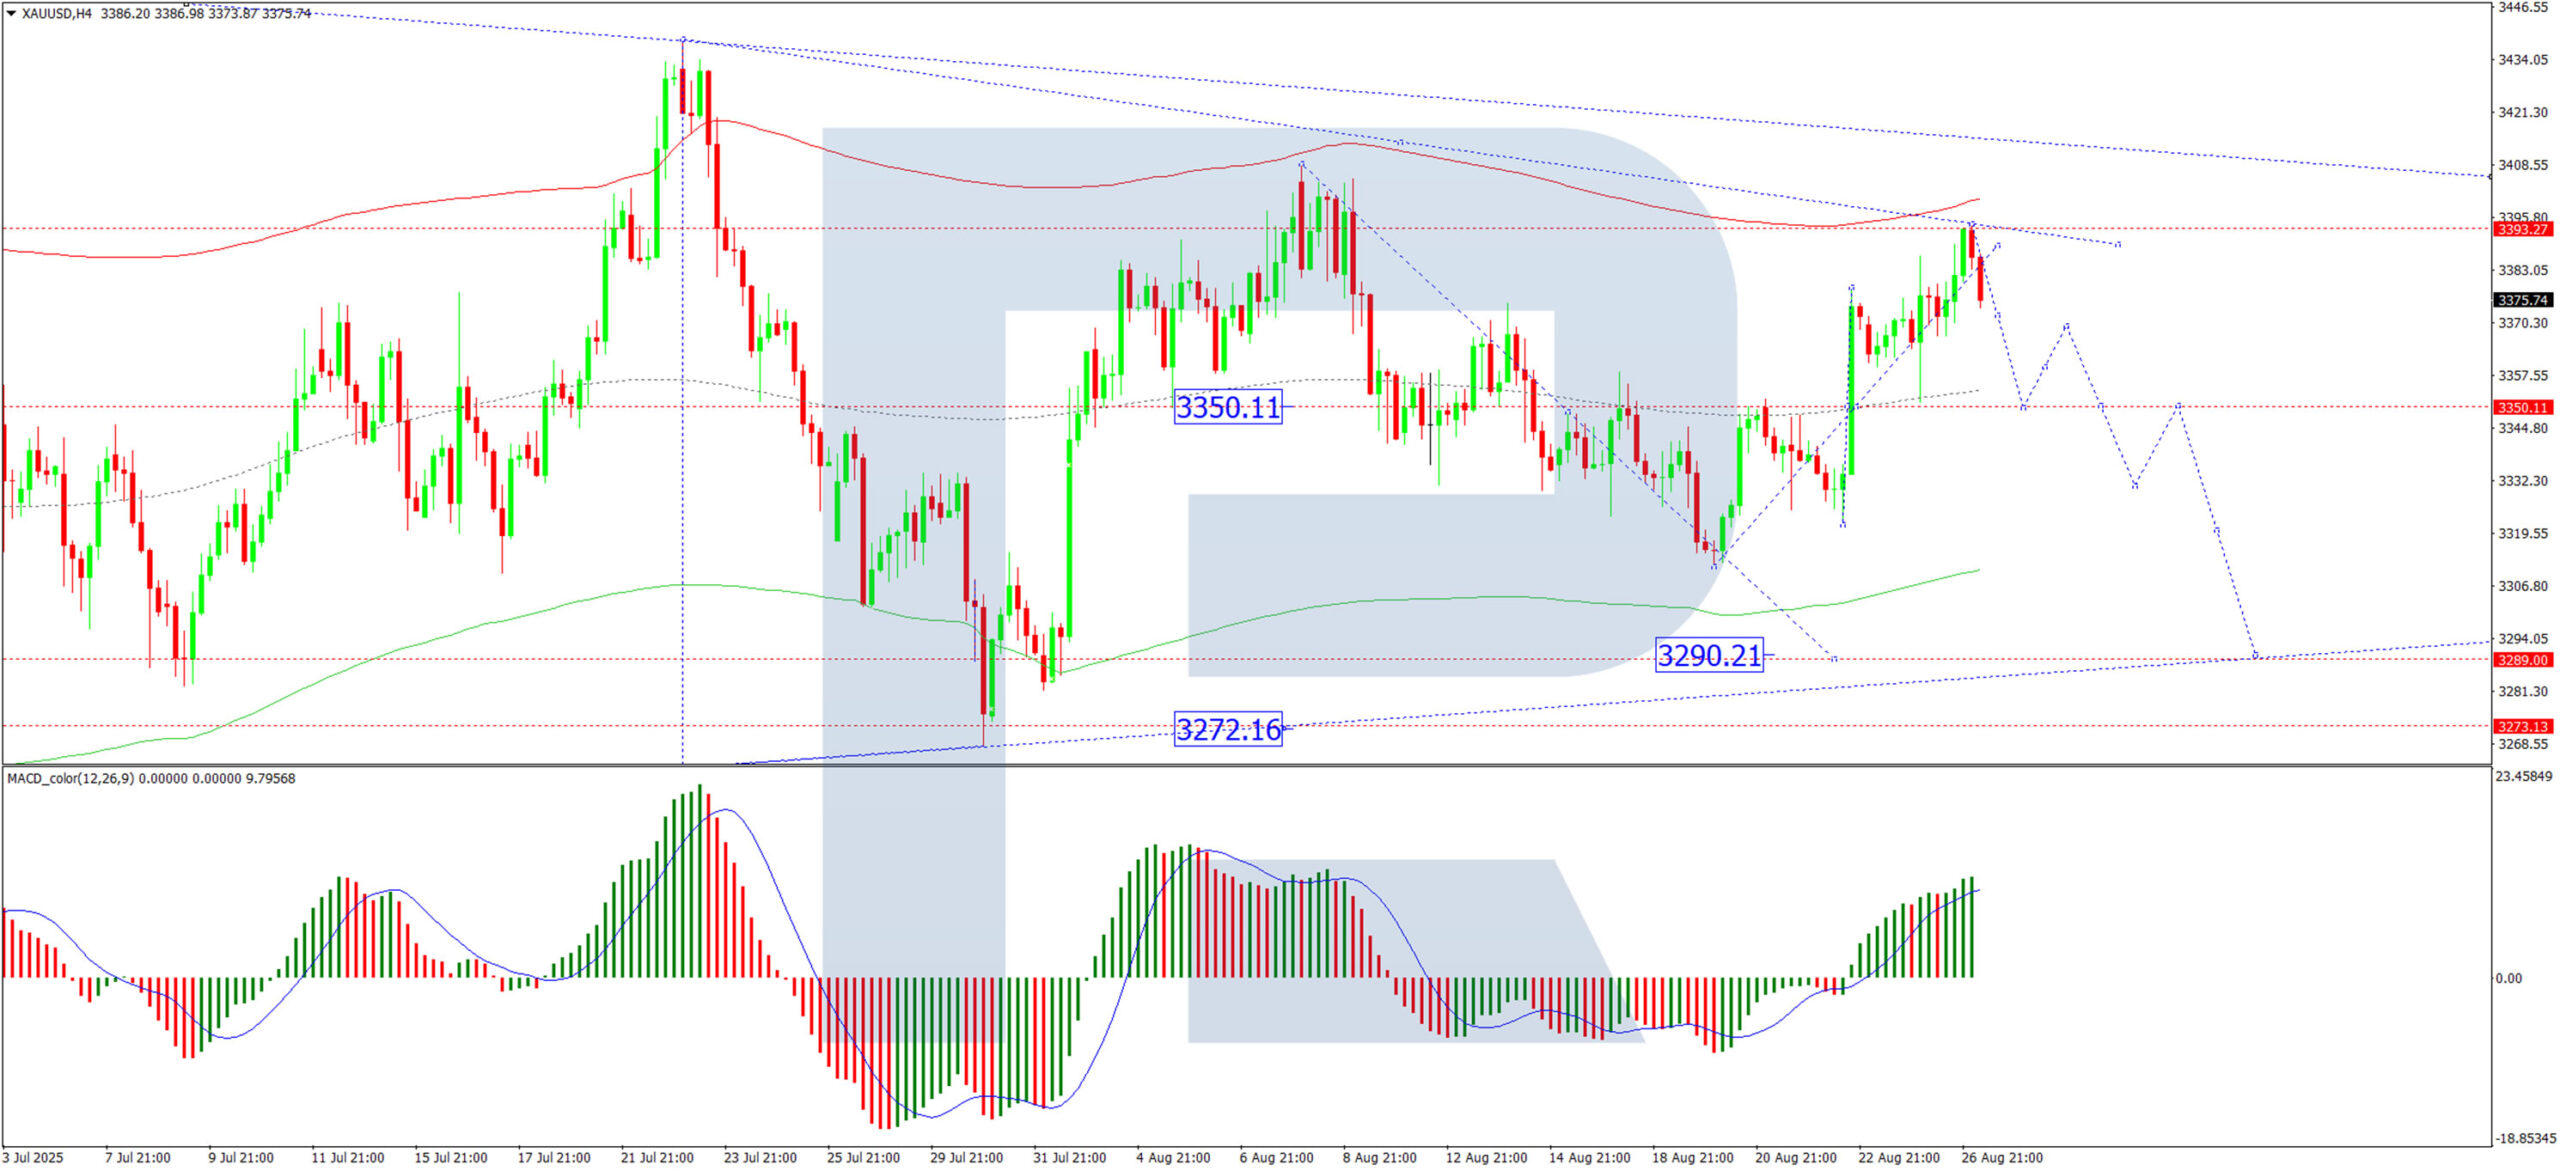
The XAU/USD pair on the H4 chart completed an upward wave towards the 3,393 USD level. The focus now shifts to the potential for a decline to the 3,350 USD support level. The market appears to be consolidating within a broad range around this point. A decisive break below this range would open the potential for a further downward wave towards 3,290 USD.
This bearish scenario is supported by the MACD indicator. Its signal line is above zero at recent highs but has diverged from the histogram, which suggests weakening momentum and a potential move towards new lows.
H1 Chart:
On the H1 chart, the market has also completed a wave structure up to 3,393 USD, with a corrective wave down to 3,350 USD underway. Upon reaching this level, we anticipate the formation of a tight consolidation range. A subsequent breakout below this range could extend the decline to 3,330 USD, with the broader trend potentially targeting 3,290 USD.
This outlook is corroborated by the Stochastic oscillator. Its signal line is currently below the 50 level and is pointing sharply downwards towards 20, indicating strengthening downward momentum.
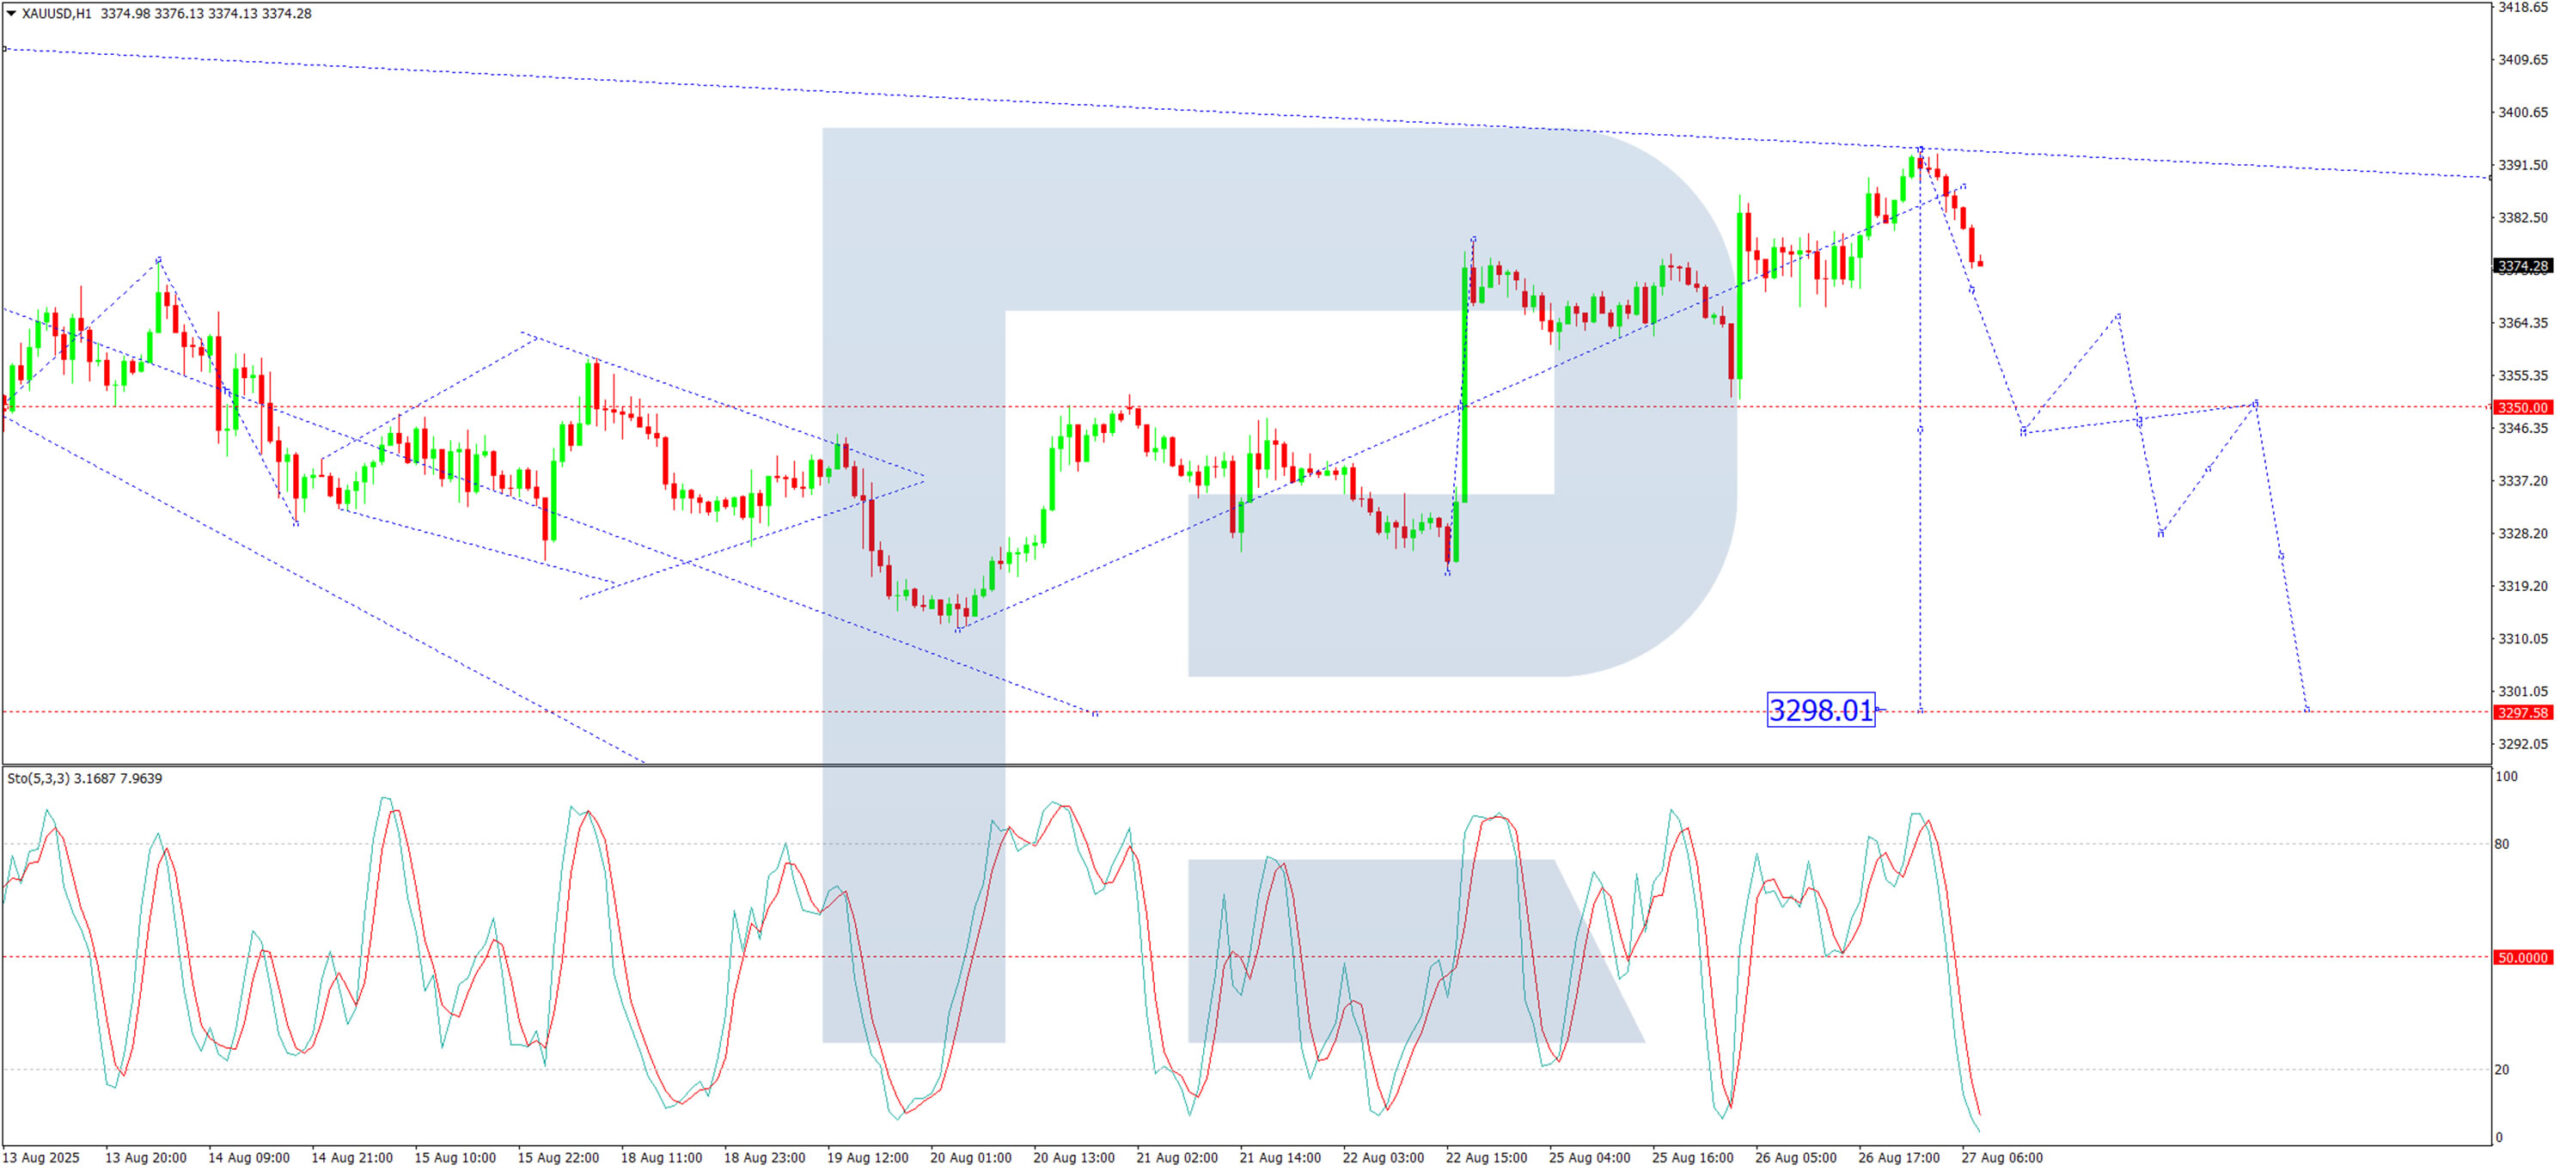
Conclusion
The fundamental landscape, marked by political and trade uncertainties, is bolstering gold's appeal as a safe-haven asset. Technically, after a period of consolidation, the indicators suggest a heightened potential for a downward move if key support levels are breached.
Gold Prices Climb Again While WTI Crude Oil Faces Hurdles
Gold price climbed again and traded above $3,350. Crude oil is showing bearish signs and might decline below $62.80.
Important Takeaways for Gold and WTI Crude Oil Price Analysis Today
- Gold price started a steady increase from $3,310 against the US Dollar.
- A key bullish trend line is forming with support at $3,378 on the hourly chart of gold at FXOpen.
- Crude oil prices failed to clear the $65.00 region and started a fresh decline.
- There was a break below a major bullish trend line with support at $64.00 on the hourly chart of XTI/USD at FXOpen.
Gold Price Technical Analysis
On the hourly chart of Gold at FXOpen, the price found support near $3,310. The price remained in a bullish zone and started a strong increase above $3,330.
There was a decent move above the 50-hour simple moving average and $3,350. The bulls pushed the price above the $3,365 and $3,378 resistance levels. Finally, the price climbed as high as $3,395 before there was a pullback.
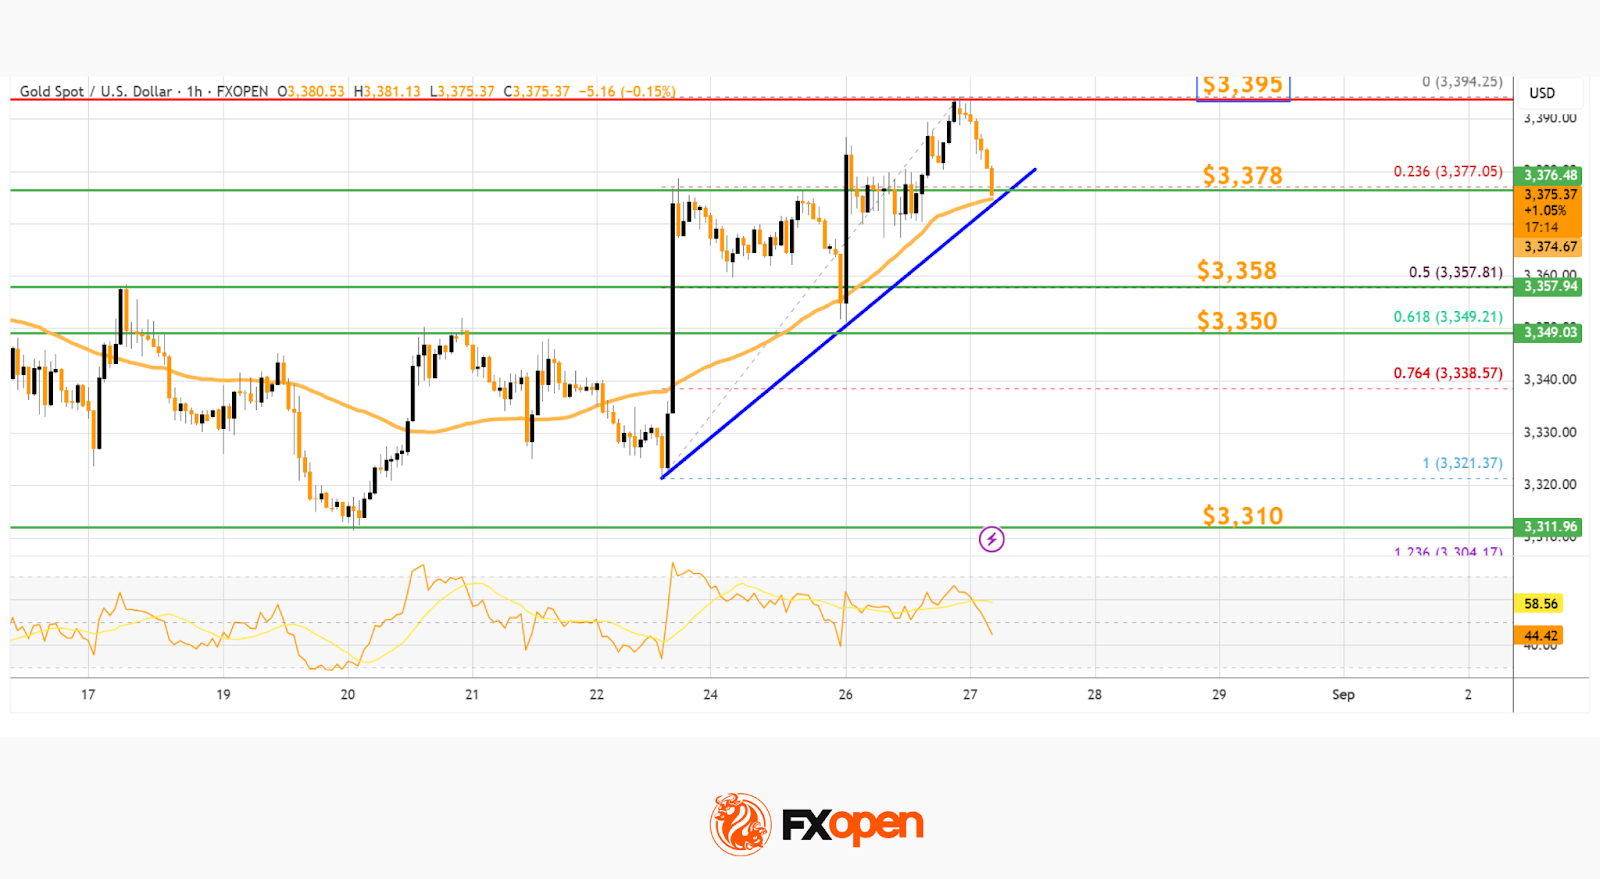
The price tested the 23.6% Fib retracement level of the upward move from the $3,321 swing low to the $3,395 high, and the RSI declined below 50. Initial support on the downside is near $3,378 and the 50-hour simple moving average.
The first major support is near the 50% Fib retracement at $3,358. If there is a downside break below $3,358, the price might decline further. In the stated case, the price might drop toward $3,350. Any more losses might push the price toward $3,310.
Immediate resistance is near the $3,395 level. The next major hurdle for the bulls is $3,400. An upside break above $3,400 could send Gold price toward $3,420. Any more gains may perhaps set the pace for an increase toward $3,450.
WTI Crude Oil Price Technical Analysis
On the hourly chart of WTI Crude Oil at FXOpen, the price struggled to clear the $65.00 level and started a fresh decline below $64.50.
There was a break below a major bullish trend line at $64.00, opening the doors for more losses. The price dipped below the 50% Fib retracement level of the upward move from the $61.56 swing low to the $64.85 high.
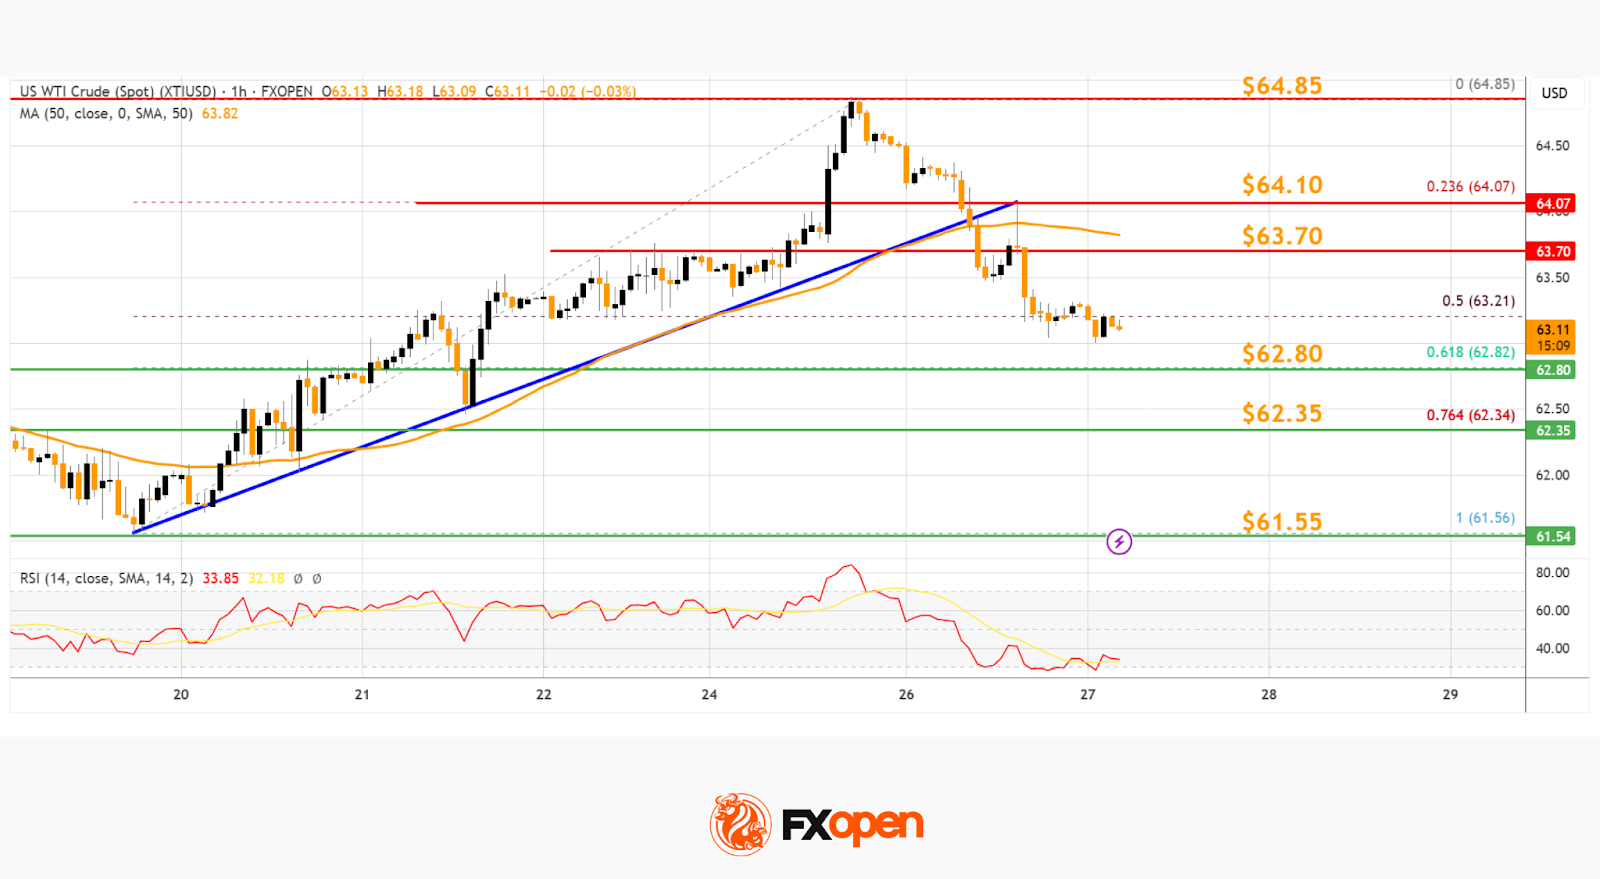
XTI/USD even dipped below $63.50 level and the 50-hour simple moving average. The bulls are now active near $63.00. If there is a fresh increase, it could face a barrier near $63.70.
The first major resistance is near $64.10. Any more gains might send the price toward $64.85 and call for a test of $65.50. Conversely, the price might continue to move down and revisit the $62.80 support and the 61.8% Fib retracement.
The next major support on the WTI crude oil chart is $62.35. If there is a downside break, the price might decline toward $61.55. Any more losses may perhaps open the doors for a move toward $60.50.