
Sample Category Title
USD/JPY Daily Outlook
Daily Pivots: (S1) 146.97; (P) 147.45; (R1) 147.92; More...
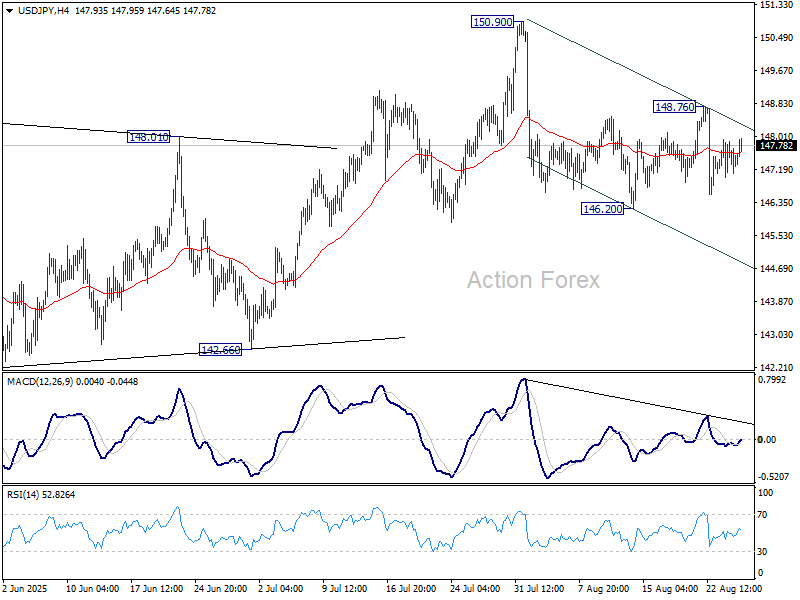
USD/JPY recovers mildly today but stays inside range of 146.20/148.76. Intraday bias remains neutral. On the downside, firm break of 146.20 will resume the fall from 150.90. Also, that would argue that rebound from 139.87 has completed as a corrective move to 150.90. Deeper fall should be seen to 142.667 support for confirmation. On the upside, above 148.76 will bring another rise to retest 150.90 instead.
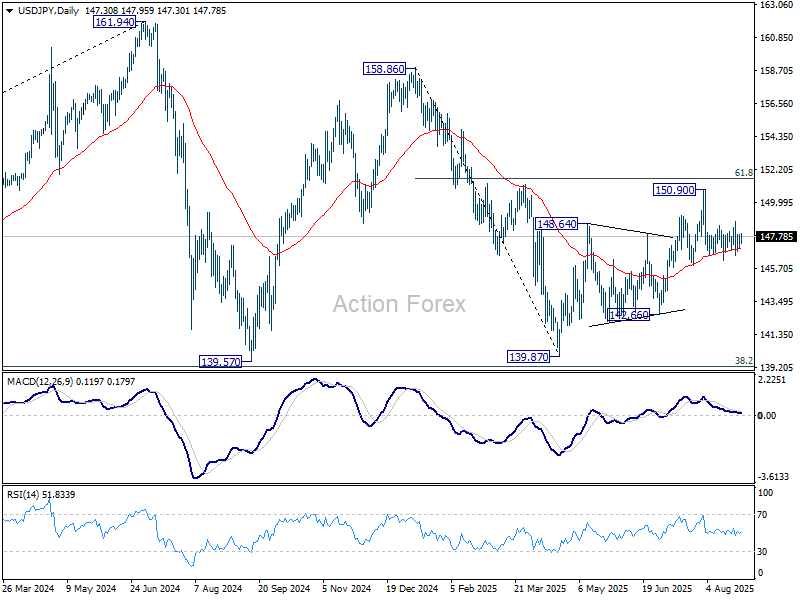
In the bigger picture, price actions from 161.94 (2024 high) are seen as a corrective pattern to rise from 102.58 (2021 low). Decisive break of 61.8% retracement of 158.86 to 139.87 at 151.22 will argue that it has already completed with three waves at 139.87. Larger up trend might then be ready to resume through 161.94 high. In case the corrective pattern extends with another fall, strong support is expected from 38.2% retracement of 102.58 to 161.94 at 139.26 to bring rebound.
Fed’s Cook Prepares Lawsuit, India Tariffs Kick in, Markets Quiet
Currency markets were largely subdued in Asian session, with majors holding tight ranges despite some volatility in equities. U.S. stocks attempted a rebound overnight but momentum was weak, while Asian bourses traded softer. The absence of major economic data left political and policy headlines to set the tone.
At the center of focus remains the ongoing drama surrounding the Fed. Governor Lisa Cook is preparing to file a lawsuit to challenge U.S. President Donald Trump’s attempt to remove her from the Board. Cook’s lawyer described the action as illegal and lacking any factual or legal basis, pledging to fight it in court.
The Fed issued a statement reinforcing its institutional independence, stressing that governors serve 14-year terms and cannot be dismissed easily. The structure, it said, exists to ensure monetary policy is made in the “long-term interests of the American people.”
Trump, however, insisted he has a replacement in mind for Cook, saying he expects to secure a majority on the Fed Board “very shortly.” The comments have only intensified concerns about political influence over monetary policy, casting a cloud over the Fed as it heads into its September 16–17 meeting.
On the trade front, Trump’s doubling of tariffs on Indian imports took effect as scheduled. Duties on a wide range of goods — from garments and footwear to gems, furniture and chemicals — now reach as high as 50%, among the steepest levies imposed by Washington. The move reflects penalties tied to India’s continued purchase of Russian oil.
India’s Commerce Ministry has yet to issue a formal response. But a ministry official said exporters affected by the tariffs would receive financial assistance and be encouraged to diversify into other markets including China, Latin America, and the Middle East.
Against this backdrop, Dollar is currently the strongest performer. Aussie is the second best, underpinned by stronger-than-expected inflation data, while Loonie followed. On the downside, Euro lagged, trailed by Yen and Swiss Franc, while Sterling and Kiwi traded in the middle of the pack.
In Asia, Nikkei rose 0.30%. Hong Kong HSI is down -1.17%. China Shanghai SSE is down -1.13%. Singapore Strait Times is down -0.10%. Japan 10-year JGB yield rose 0.008 to 1.633. Overnight, DOW rose 0.30%. S&P 500 rose 0.41%. NASDAQ rose 0.44%. 10-year yield fell -0.017 to 4.258.
German Gfk consumer confidence falls to -23.6 on job fears
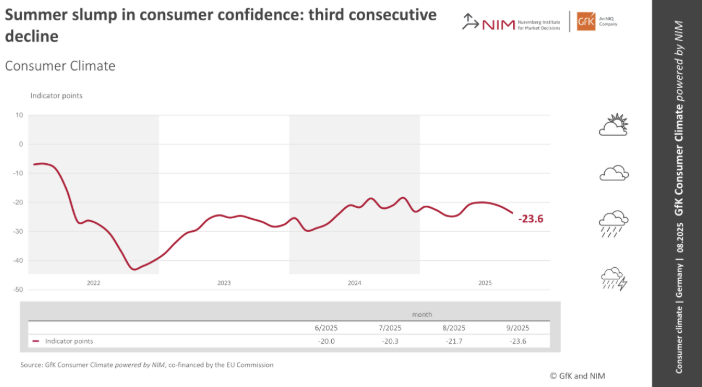
Germany’s GfK Consumer Sentiment index for September dropped to -23.6 from -21.7, falling short of expectations at -21.2. It was the third consecutive monthly decline, with NIM’s Rolf Bürkl describing sentiment as “definitely in the summer slump.”
The key driver was a sharp fall in income expectations as worries about job security intensified. Registered unemployment remained just below three million in July, but analysts expect that mark to be breached in August. Consumers’ expectations of rising unemployment have reached their highest level of the year.
Australia CPI jumps to 2.8%, highest in a year, rules out September RBA cut
Australia’s monthly CPI spiked to 2.8% yoy in July, well above expectations of 2.3% yoy and up sharply from 1.9% yoy in June. It was the highest annual inflation rate since July 2024, breaking several months of easing price pressures. Core measures also firmed, with CPI excluding volatile items rising from 2.5% yoy to 3.2% yoy and trimmed mean jumping back from 2.1% yoy to 2.7% yoy, a pace last seen three months ago.
The result adds to concern that inflation is proving sticky, though July’s data, as the first month of the quarter, is skewed toward goods and offers less insight into services inflation than subsequent months.
For the RBA, the print is a warning sign but not a trigger for panic. Policymakers will want to wait for the full quarterly inflation update before adjusting course. Today’s data nonetheless rules out a September cut.
Barring a significant deterioration in the labor market or other downside shocks, the more realistic timeline for the next rate move remains November.
EUR/AUD and GBP/AUD extend declines, deeper losses in view
Aussie firmed notably after July’s CPI data came in much stronger than expected. The print reinforces the case for the RBA to maintain its gradual easing pace, removing any immediate scope for a faster round of rate cuts. Aussie’s gains were evident against the Euro and Sterling, with both crosses under renewed downside pressure.
EUR/AUD's fall from 1.8155 short term top extends lower. Intraday bias remains on the downside for 38.2% retracement of 1.7245 to 1.8155 at 1.7807. That is close to channel support (now at 1.7816), and 55 D EMA (now at 1.7841).
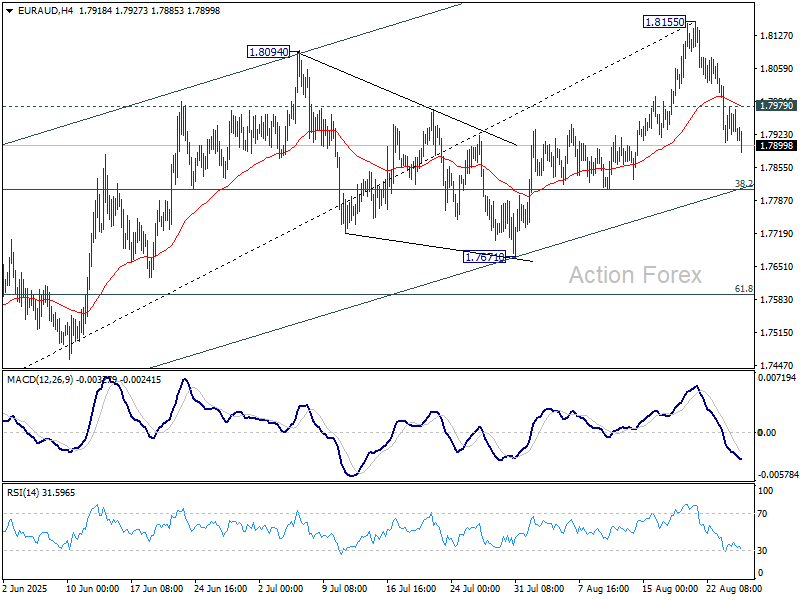
Sustained break of this cluster support zone should confirm that whole rise from 1.7245 has completed. Corrective pattern from 1.8554 should then be in its third leg. In this case, bring deeper fall to 61.8% retracement at 1.7593.

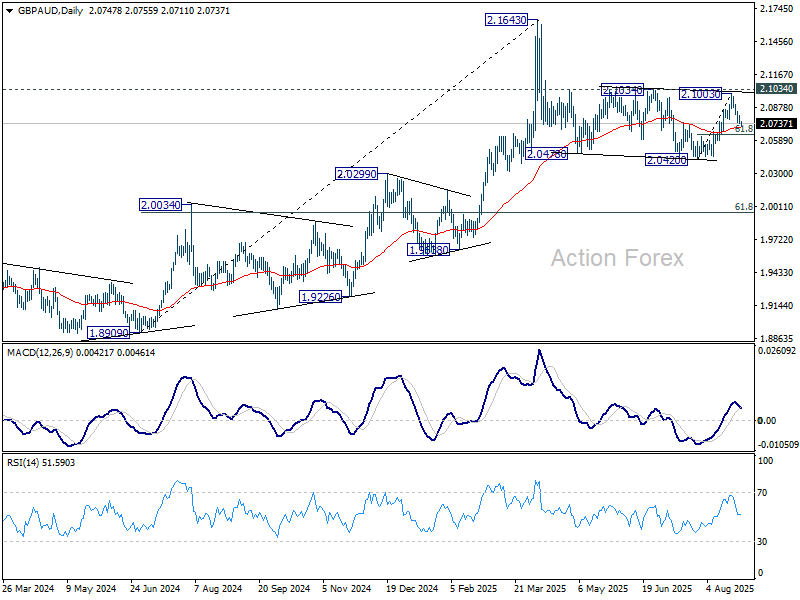
GBP/AUD's extended fall indicates short term topping at 2.1003 after rejection by 2.1034 resistance. The development suggests that corrective pattern from 2.1643 is still extending.
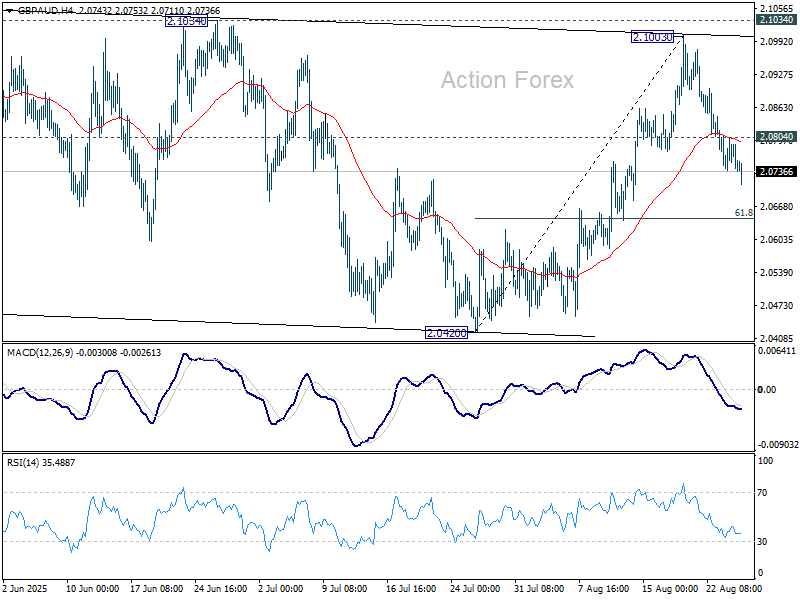
Deeper decline should be seen to 61.8% retracement of 2.0420 to 2.1003 at 2.0643 in the near term. Firm break there will target 2.0420 support and possible below.
USD/JPY Daily Outlook
Daily Pivots: (S1) 146.97; (P) 147.45; (R1) 147.92; More...
USD/JPY recovers mildly today but stays inside range of 146.20/148.76. Intraday bias remains neutral. On the downside, firm break of 146.20 will resume the fall from 150.90. Also, that would argue that rebound from 139.87 has completed as a corrective move to 150.90. Deeper fall should be seen to 142.667 support for confirmation. On the upside, above 148.76 will bring another rise to retest 150.90 instead.
In the bigger picture, price actions from 161.94 (2024 high) are seen as a corrective pattern to rise from 102.58 (2021 low). Decisive break of 61.8% retracement of 158.86 to 139.87 at 151.22 will argue that it has already completed with three waves at 139.87. Larger up trend might then be ready to resume through 161.94 high. In case the corrective pattern extends with another fall, strong support is expected from 38.2% retracement of 102.58 to 161.94 at 139.26 to bring rebound.
German Gfk consumer confidence falls to -23.6 on job fears
Germany’s GfK Consumer Sentiment index for September dropped to -23.6 from -21.7, falling short of expectations at -21.2. It was the third consecutive monthly decline, with NIM’s Rolf Bürkl describing sentiment as “definitely in the summer slump.”
The key driver was a sharp fall in income expectations as worries about job security intensified. Registered unemployment remained just below three million in July, but analysts expect that mark to be breached in August. Consumers’ expectations of rising unemployment have reached their highest level of the year.
RBA Might Hold to a Pace of Gradual Policy Normalization
Markets
US President Trump’s unprecedented attack against the US Federal Reserve is heading for court. On Monday, he removed Fed governor Cook effective immediate for cause (related to mortgage fraud insinuations). Governor Cook refused, but if court rules that the President gets to define “cause”, it nullifies all protection for the independent US central bank. Trump is trying to stack the Washington board with his own nominees, just they way he flipped the US supreme court during his previous tenure. On social media, he already bragged about nearly achieving a majority. Fed Waller and Bowman – the two dissenters in favour of a July rate cut – were nominated during his first term. Fed Miran, known for advocating a weaker dollar and reciprocal tariffs and for criticizing Fed chair Powell, was nominated earlier this month to replace Fed Kugler who resigned unexpectedly. Now Trump’s after Fed Cook while next year Powell’s spot is due. The Fed board has authority over regional Fed governors (5 out of 12 votes within FOMC) creating room for legal force as well. Financial markets currently keep a blind eye for the huge tail risk of a politically-driven US central bank. If Trump succeeds, the very long end of the US yield curve will become even more vulnerable. The harder he pushes for lower (short term) rates, the bigger the potential sell-off at the very long end of the curve with inflation expectations adding to already rising term premia. In such scenario, the greenback is at risk of being dealt another significant blow.
In Europe, French tail risk lingers with PM Bayrou expected to lose a confidence vote on September 8. It prevents the euro from exploiting USD-weakness (EUR/USD 1.1620) with European stock markets yesterday losing up to 1% (CAC 40 down 1.4%). US eco data were slightly better than expected yesterday (US durable goods orders, Richmond Fed manufacturing index, consumer confidence) but without impacting the market. Details from the Conference Board consumer survey showed rising worries about jobs and income offset more optimistic views of current and future business conditions. Consumers’ average 12-month inflation expectations picked up after three consecutive months of easing and reached 6.2% in August - up from 5.7% in July but still below the April peak of 7.0%. The US Treasury’s end-of-month refinancing operation started with a strong $69bn 2-yr Note auction with Powell’s dovish pivot in Jackson Hole supporting demand. Today’s eco calendar is empty apart from a $70bn 5-yr Note sale suggesting political event risk (US, France) and Nvidia earnings (after close) to set the tone for risk sentiment/trading.
News & Views
Australian inflation rose from 1.9% in June to 2.8% In July. Underlying measures also accelerated substantially. The rimmed mean measure increased from 2.1% to 2.7%. CPI excluding volatile items and holiday travel rose 3.5% Y/Y , up from 2.5% in June. A monthly rise in electricity price of 13% M/M was a main driver for the jump in overall inflation as consumer in two states didn’t receive payments on an extended energy relief bill. However, also price rises due to the annual electricity prices review came into effect. On the other hand, rents rose 3.9% Y/Y, down from 4.9% in June and the lowest annual rise since November 2022. Monthly holiday travel and accommodation prices rose 4.7% M/M and 3.3% Y/Y in July after a 3.7% Y/Y decline in June. The rise in some volatile times suggests that some of it might be reversed in coming months. Even so, today’s data suggest that the RBA might hold to a pace of gradual policy normalization. The RBA cut its policy rate by 25 bps to 3.60% earlier this month and is only expected to make a next step in November. The 3-y government bond yield this morning rose 2.6 bps to 3.43%. AUD/USD hardly changed (0.6485).
Bank of Canada governor Macklem in a speech indicated that the central bank aims to maintain its inflation target at 2% (mid of the 1%-3% target range) when the monetary policy framework comes up for revision next year. In an uncertain and unpredictable world, it is not the time to question the target. However, the BOC is examining best ways to measure core inflation and also how to cope with housing cost when it sets monetary policy. In a context of supply shocks and greater volatility in inflation (amongst other due to US tariffs), the BoC will examine whether it is best to look at a broader rather than a narrow range of core inflation indicators.
US Consumer Confidence Eases With Inflation Back in Focus
In focus today
Today is relatively quiet in terms of significant economic data releases, though we note a few items.
In Denmark, retail sales figures for July will be released. Our Spending Monitor showed a 1.2% m/m increase in real retail spending in July, following a setback of -1.4% m/m in June. We expect the figures from Statistics Denmark to reflect the same trend, with an increase in July.
In Sweden, household lending is expected to grow at a similar rate as the previous month, likely around 2.5%. This release is expected to have minimal impact on Swedish markets.
In Norway, the monthly LFS-statistics is released. In recent months this release has shown an unusual labour force driven rise in the unemployment rate which is very unusual given the stage of the business cycle that Norway currently is in. The report will thus be scrutinized for details as to the true picture of the labour market with Friday's upcoming registered unemployment report also adding important information to policy makers.
Finally, Nvidia wraps up Big Tech earnings today, reporting Q2 results after the bell.
Economic and market news
What happened yesterday
In the US, the Conference Board's August consumer sentiment survey showed a slight weakening, with the index declining to 97.4 (cons: 96.2, prior: 98.7). A rising number of consumers perceive jobs as 'hard to get' and expect fewer jobs to be available over the next six months. Notably, inflation expectations have risen after declining from May to July. This shift mirrors a similar shift in the Michigan survey and could raise concerns for the Fed.
Also in the US, Fed Governor Cook announced plans to sue over President Trump's attempt to dismiss her - a move that has re-introduced the theme of Fed independence. Her lawyer deemed Trump's attempt baseless, while the Fed underscored that 14-year terms safeguard decisions for "the long-term interests of the American people." The Fed stated that Cook's status remains unchanged unless a court rules otherwise before the 16-17 September meeting. Markets responded with equities wavering, the yield curve steepening, and the dollar weakening, supporting our view of the USD's strategic downtrend.
In Sweden, we got the Riksbank's Minutes which indicated that while the Board is more vigilant regarding the recent inflation uptick, it still views this as likely temporary. The Minutes highlight a delicate balancing act: while the Swedish recovery could benefit from further monetary policy support, this must not come at the cost of undermining the Riksbank's inflation target credibility. In our view, the Minutes suggest that inflation remains too high for a rate cut in September unless August figures surprise significantly. However, the Board may consider cuts later if inflation trends lower in a more plausible manner. Read more in Riksbank Minutes - August 2025, 26 August.
In Hungary, the central bank (MNB) held its key rate steady at 6.50%, as expected, maintaining a joint-high with Romania for the highest policy rate in the EU. With MNB policymakers focused on re-anchoring the inflation expectations amid still elevated price pressures, most likely the policy rate will be kept at current 6.50% for the foreseeable future, barring any major surprises.
Equities: Equities were mixed on Tuesday. Europe was burdened by the selloff in French banks (Stoxx 600 -0.8% and CAC40 -1.6%). With French banks down more down in the ballpark of 4-7%, it may seem like an overreaction (and we believe it is) but it is not a rare reaction function in markets when things like this happen. As the credit risk increased as a result of the gridlock on fiscal policy, investors took a "better safe than sorry" approach, trying to be the first one out. This has less to do with actual earnings, but more about positioning and equity risk premium correcting, which tends to be more short-lived.
US markets rebounded mid-session, closing near session-highs (S&P 500 0.4%, Russell 2000 0.8%). This erased the drift lower on Monday, following Friday's big rally. Risk on in sector performance, with industrials and banks in the lead, outperforming defensive groups like consumer staples by almost 2p.p. Health care sector also solid, following positive trial results from Eli Lilly's weight loss pill. Asian markets are marching higher again this morning, with Shenzhen marching 1.3% higher (and 13% higher the last 30 days).
FI&FX: With an empty calendar in terms of macro releases, global yields drifted slightly lower during yesterday's session. The spread widening continued between France and Germany and French banks dropped, while broader EUR proved resilient. With a thin macro data calendar today, the focus will be on tonight's Nvidia earnings, which could influence the broader risk sentiment. In Norway, we see the case for some spread widening in the near term and we recommend to pay 2Y NOK vs both GBP and SEK covered bonds as tactical trades.
Nvidia Day
The week started badly for French assets, as the French PM called for a confidence vote that opposition parties immediately responded to with a ‘no confidence.’ The EURUSD consolidated below its 50-DMA despite a broadly pressured US dollar, which feels the pinch of a growing dispute between Federal Reserve (Fed) Governor Lisa Cook and US President Donald Trump, who attempted to fire her without necessarily having the authority to do so.
Donald Trump continues to accumulate actions unprecedented for a US president: firing officials, replacing them with loyalists, imposing tariffs on trade partners, seeking payments from companies on their private revenues, and openly telling businesses what they can or cannot do. The American story is becoming a one-man show — and not everyone finds it amusing.
The short end of the US yield curve is rallying on the softening Fed outlook. Markets fear that if Trump succeeds in ousting Cook — and he has often tested limits successfully — he could tilt decision-making at the Fed in his favour, indirectly influencing policy.
The long end of the curve, however, remains under pressure. Inappropriate rate cuts could fuel inflation and push long-term yields higher, especially against the backdrop of soaring US debt. The US 30-year yield continues to flirt with the 5% mark. The steepening of the curve, combined with rising sovereign yields in other DM bonds, adds to concerns that investors could rotate into bonds to lock in attractive returns at lower risk. For reference: the UK 30-year gilt now yields 5.60%, Australian 30-year paper sits above 5%, a European gauge of 30-year paper yields 3.80%, and the Japanese 30-year JGB is at 3.21%. Meanwhile, the S&P500’s earnings yield is around 3–4% due to rich valuations — suggesting that, rationally, equities should reprice lower relative to bonds.
As summer winds down, the bullish sentiment that carried stocks higher on trade deals, resilient earnings, and softer Fed bets could give way to risk-off positioning. Concerns are rising about Fed independence and about internal and external US policies — some of which are unprecedented for a democracy.
Nvidia closes the earnings dance; the company will report earnings after the bell. Nvidia now accounts for ~8% of the S&P500 and is the flagship of the AI theme, so its results — or the market’s reaction to them — could be market-moving, even trend-reversing. The company is expected to deliver around $46bn in revenue, largely driven by AI spending from giants like Microsoft and Meta, which account for about 40% of sales. Margins could benefit from recent export ban exemptions granted by the Trump administration. But the China story remains uncertain: Beijing is now pressuring domestic firms to buy local chips, which could erode Nvidia’s Chinese revenue share (currently about 13%). The Middle East, however, has emerged as a new growth region. With Nvidia trading on a lofty PE of ~58, strong growth is essential to justify valuations. Options pricing implies a 6% move in Nvidia shares, which could translate into a ~0.8% swing in the S&P500.
Even if Nvidia beats expectations, investors might use strength as an opportunity to take profits, which could accelerate a correction. Hedging strategies are therefore worth considering. Put options and other structures can trim downside risk but come at a cost. VIX futures are cheap but require precise timing. Diversification remains the most effective buffer: across geographies (Chinese, Asian tech), sectors (defensives like staples and healthcare, European and UK markets vs. Expensive US tech) or typical asset classes including gold, Treasuries and investment grade bonds set to benefit from upcoming rate cuts.
Bitcoin Correction Worsens, Is a Bigger Drop Now on Horizon?
Key Highlights
- Bitcoin corrected gains and traded below the $112,000 support.
- BTC/USD now faces resistance near a bearish trend line at $115,500 on the 4-hour chart.
- Ethereum is consolidating gains above the $4,250 support.
- XRP price is showing a few bearish signs below $3.00.
Bitcoin Price Technical Analysis
Bitcoin price started a downside correction below $112,500 against the US Dollar. BTC even declined below $110,000 before the bulls appeared.
Looking at the 4-hour chart, the price tested the $108,650 zone and is currently consolidating losses. If there is a recovery wave, the price could face resistance near $112,000 and the 38.2% Fib retracement level of the downward move from the $117,407 swing high to the $108,637 low.
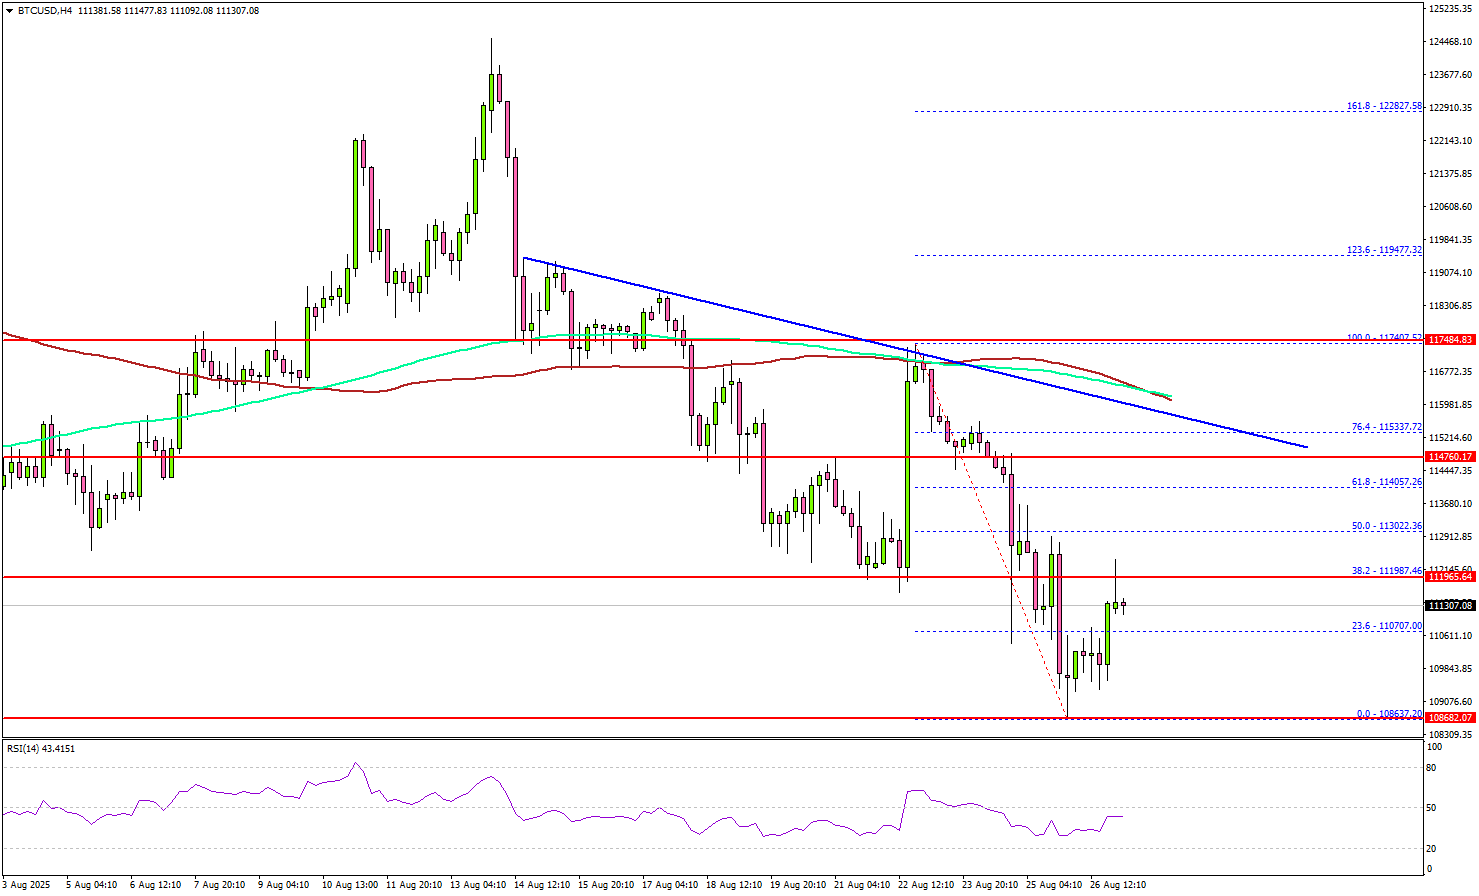
The next key resistance is $114,000 or the 61.8% Fib retracement. The main hurdle is now forming near a bearish trend line at $115,500 on the same chart. It coincides with the 100 simple moving average (red, 4-hour) and the 200 simple moving average (green, 4-hour).
A successful close above $115,500 might start another steady increase. In the stated case, the price may perhaps rise toward the $118,000 level. Any more gains might call for a test of $120,000.
Immediate support is $108,500. A downside break below $108,500 might send BTC toward the $106,500 support. Any more losses might send the price toward the $103,200 support zone.
Looking at Ethereum, the price traded to a new all-time high close to $5,000, and it is now consolidating gains above $4,250.
Today’s Key Economic Releases
- EIA Crude Oil Stocks Change.
- MBA Mortgage Applications.
EUR/AUD and GBP/AUD extend declines, deeper losses in view
Aussie firmed notably after July’s CPI data came in much stronger than expected. The print reinforces the case for the RBA to maintain its gradual easing pace, removing any immediate scope for a faster round of rate cuts. Aussie’s gains were evident against the Euro and Sterling, with both crosses under renewed downside pressure.
EUR/AUD's fall from 1.8155 short term top extends lower. Intraday bias remains on the downside for 38.2% retracement of 1.7245 to 1.8155 at 1.7807. That is close to channel support (now at 1.7816), and 55 D EMA (now at 1.7841).
Sustained break of this cluster support zone should confirm that whole rise from 1.7245 has completed. Corrective pattern from 1.8554 should then be in its third leg. In this case, bring deeper fall to 61.8% retracement at 1.7593.
GBP/AUD's extended fall indicates short term topping at 2.1003 after rejection by 2.1034 resistance. The development suggests that corrective pattern from 2.1643 is still extending.
Deeper decline should be seen to 61.8% retracement of 2.0420 to 2.1003 at 2.0643 in the near term. Firm break there will target 2.0420 support and possible below.
Australia CPI jumps to 2.8%, highest in a year, rules out September RBA cut
Australia’s monthly CPI spiked to 2.8% yoy in July, well above expectations of 2.3% yoy and up sharply from 1.9% yoy in June. It was the highest annual inflation rate since July 2024, breaking several months of easing price pressures. Core measures also firmed, with CPI excluding volatile items rising from 2.5% yoy to 3.2% yoy and trimmed mean jumping back from 2.1% yoy to 2.7% yoy, a pace last seen three months ago.
The result adds to concern that inflation is proving sticky, though July’s data, as the first month of the quarter, is skewed toward goods and offers less insight into services inflation than subsequent months.
For the RBA, the print is a warning sign but not a trigger for panic. Policymakers will want to wait for the full quarterly inflation update before adjusting course. Today’s data nonetheless rules out a September cut.
Barring a significant deterioration in the labor market or other downside shocks, the more realistic timeline for the next rate move remains November.

Comparing Economic Conditions in New Zealand and Australia
GDP growth in NZ is on course to outpace Australia over the next few years. Even so, economic and labour market conditions in Australia look set to remain firmer than in NZ for some time yet.
Trading places.
When we last peeked over the Tasman in late 2024, the Australian economy was enjoying more robust economic conditions than New Zealand, with firmer GDP growth and a stronger labour market.
Jump forward a year and we are now moving into a new phase of the economic cycle, with economic growth in New Zealand set to outpace Australia over the next few years.
These diverging economic trends in New Zealand and Australia in large part reflect differences in monetary policy. The Reserve Bank of New Zealand’s earlier aggressive tightening of policy meant that we experienced a sharper downturn in growth in recent years. However, now that inflation has dropped back, the RBNZ has also been able to cut rates faster, with a 250bp reduction in the Official Cash Rate to date and a likely 50bps more to come before the end of 2025. Over time, that will help to boost both domestic demand and employment.
In contrast, the Reserve Bank of Australia took a more gradual approach to tightening policy which helped to support growth and the labour market in previous years. However, its easing cycle has also been more gradual—with Australia’s cash rate having only been cut by 75bps since the start of this year, interest rates across the Tasman remain at mildly restrictive levels.
But despite the slower pace of monetary easing and cooling economic growth, Australia’s economy and labour market have remained firmer than in New Zealand, and that’s set to continue for some time yet.