Sample Category Title
Gold (XAU/USD) Technical: Push up Towards Medium-Term Range Resistance Zone as Fed’s Independence Erodes
The recent price actions of Gold (XAU/USD) have started to trade firmer since last Friday, 22 August, with a gain of 1%, on increased hopes that the US Federal Reserve is likely to enact its first interest rate cut of 2025 in the next month's FOMC meeting.
Fed Chair Powell’s Jackson Hole Symposium dovish speech has led traders in the Fed Funds futures market to firm up bets that the Fed is likely to cut twice in 2025 (25 basis points each), with a probability of 81% that the Fed Funds rate will be at 3.75%-4.00% on 10 December 2025 FOMC meeting at the time of writing from the current range of 4.25%-4.50%.
Lower interest rates reduce the opportunity cost of holding gold, an asset that yields no interest, thereby boosting its appeal and increasing demand, which in turn puts upward pressure on prices.
Safe haven bids extend gains for Gold over fears of Fed’s independence
In today’s early Asia session, Gold (XAU/USD) shot up by 0.6% to print a current intraday high of US$3,387, a two-week high before paring gains to 0.3% intraday at the time of writing due to safe haven demand as the independence of the US Federal Reserve gets eroded over the firing of Federal Reserve Governor Lisa Cook by US President Trump.
Let’s decipher the latest technical developments on Gold (XAU/USD)
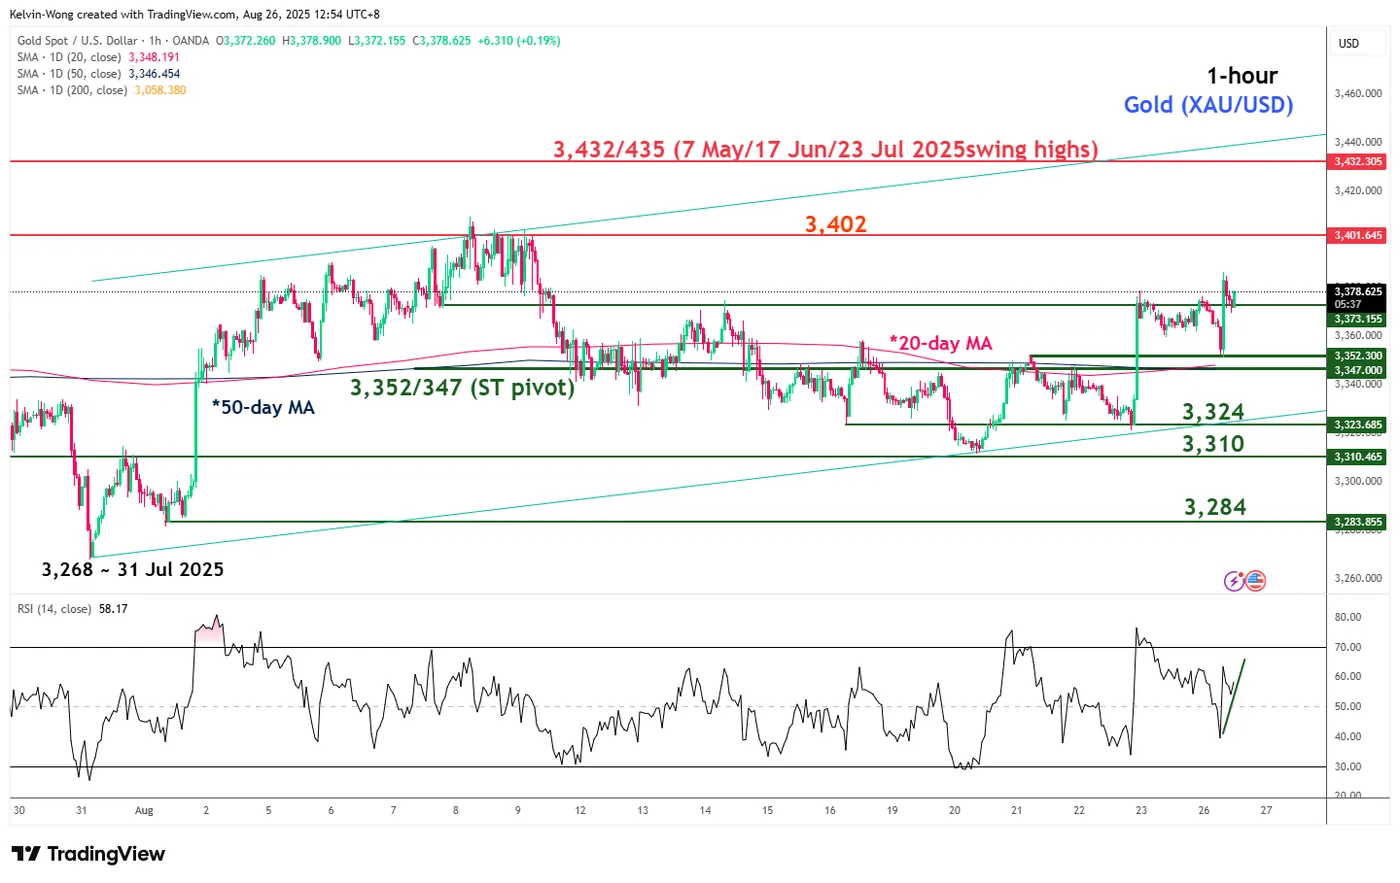
Fig. 1: Gold (XAU/USD) minor trend as of 26 Aug 2025 (Source: TradingView)
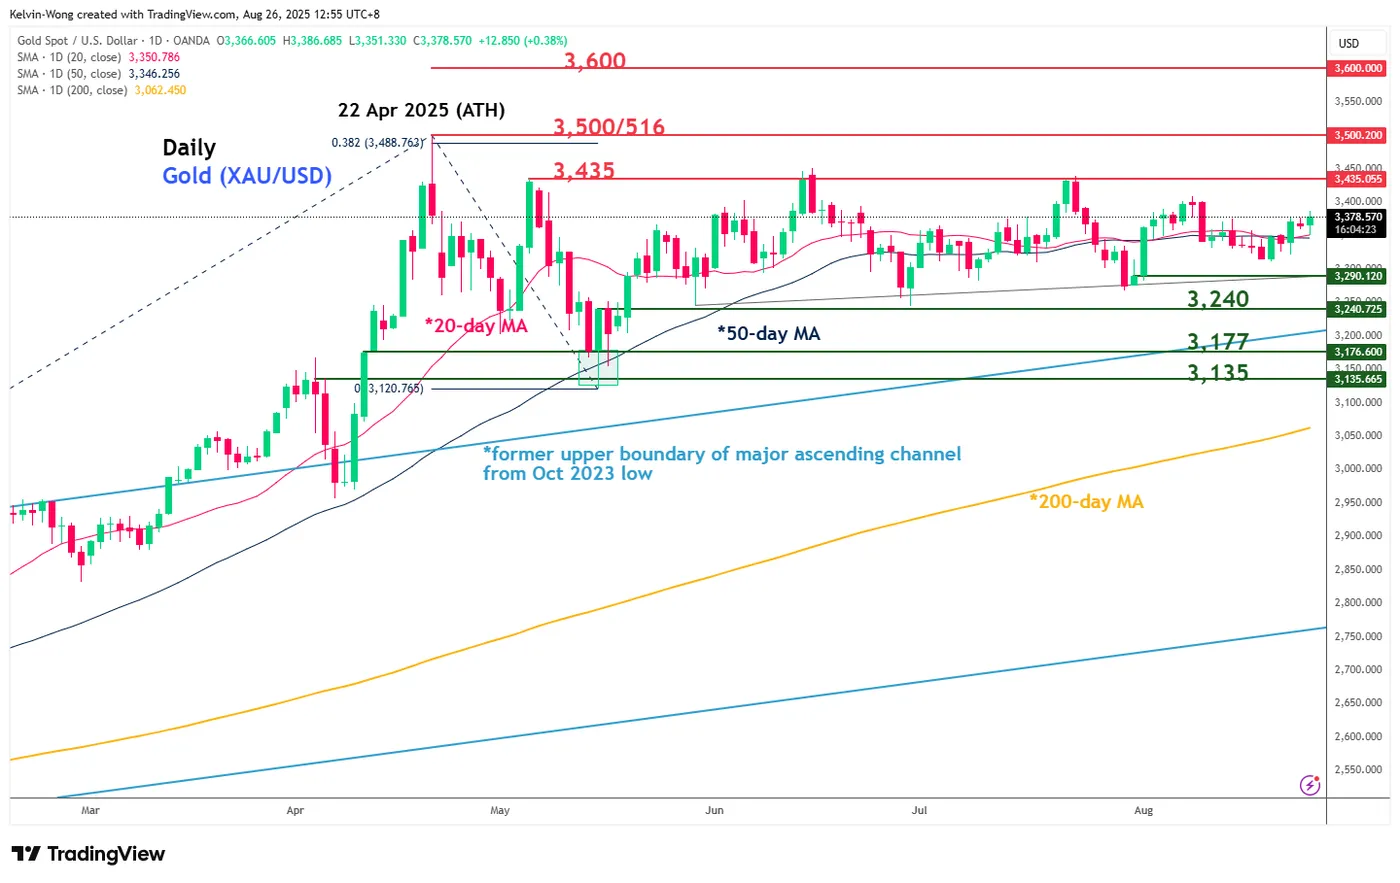
Fig. 2: Gold (XAU/USD) medium-term trend as of 26 Aug 2025 (Source: TradingView)
Preferred trend bias (1-3 days)
Bullish bias within a medium-term sideways range configuration with key short-term pivotal support at US$3,352/347, with next intermediate resistances coming in at US$3,402 and US$3,432/3,435 (see Fig. 1).
Key elements
- Since the current all-time high of US$3,500 printed on 22 April 2025, the price actions of Gold (XAU/USD) have evolved into a medium-term sideways range configuration (see Fig. 2).
- The current prices of Gold (XAU/USD) have traded back above the 20-day and 50-day moving averages since last Friday, August 22, and oscillated within a minor ascending channel in place since the 31 July 2025 low of US$3,268.
- The hourly RSI momentum indicator has displayed a “higher low” right above the 50 level and has not reached its overbought region (above the 70 level). These observations suggest a potential short-term bullish momentum condition for Gold (XAU/USD).
Alternative trend bias (1 to 3 days)
A break below US$3,347 on Gold (XAU/USD) invalidates the bullish bias for another round of choppy decline towards the lower limit of the medium-term sideways range configuration, exposing the next intermediate supports at US$3,324 and US$3,310 in the first step.
EUR/USD Exchange Rate Shows Increased Volatility
Powell’s speech on Friday had a distinctly dovish tone. Expectations of an interest rate cut strengthened, which led to a sharp weakening of the dollar — on the EUR/USD chart, a bullish impulse A→B was formed.
On Monday, as often happens after an initial emotional reaction to major news, the price corrected as market participants reassessed prospects in light of the Fed Chair’s softened rhetoric.
What is particularly notable is that the correction was most evident on the EUR/USD chart, where the decline B→C almost completely offset Friday’s surge. This could point to underlying weakness in the euro, which seems justified when considering that the euro index EXY (the euro’s performance against a basket of currencies) has risen by roughly 13% since the beginning of the year.
The EUR/USD rate reacted less strongly to the news that President Trump had decided to dismiss Lisa Cook, a member of the Federal Reserve’s Board of Governors. While the media debates whether the President has the authority to remove her, traders may instead assess how EUR/USD could fluctuate following the A→B→C volatility swing.
Technical Analysis of the EUR/USD Chart
Recently, we outlined a descending channel using the sequence of lower highs and lows observed this summer. The upper boundary clearly acted as resistance for EUR/USD’s rise on Friday.

From the bears’ perspective:
→ the price has broken downward through an ascending trajectory (shown in purple), and the lower purple line has already changed its role from support to resistance (as indicated by the arrow);
→ today’s rebound from the 1.1600 support level appears weak, as highlighted by the long upper shadow on the candlestick;
→ if this rebound is merely an interim recovery following the bearish B→C impulse, it fails to reach the 50% Fibonacci retracement level.
In addition, the B peak only slightly exceeded the previous August high (which resembles a bull trap).
Taking all this into account, we could assume that in the near term we may see bears attempt to break the 1.1600 support level and push EUR/USD towards the median line of the primary descending channel.
Trade over 50 forex markets 24 hours a day with FXOpen. Take advantage of low commissions, deep liquidity, and spreads from 0.0 pips. Open your FXOpen account now or learn more about trading forex with FXOpen.
This article represents the opinion of the Companies operating under the FXOpen brand only. It is not to be construed as an offer, solicitation, or recommendation with respect to products and services provided by the Companies operating under the FXOpen brand, nor is it to be considered financial advice.
USD/JPY Under Pressure as Yen Pares Losses
The USD/JPY pair declined on Tuesday, touching 147.70. The move marks a partial recovery for the yen, enabling it to recoup some of its recent losses. Selling pressure on the US Dollar intensified after US President Donald Trump announced the removal of Federal Reserve Governor Lisa Cook over allegations of mortgage fraud. The decision has sparked fresh concerns regarding the central bank's independence and its ability to formulate policy without political interference.
On the domestic front, Bank of Japan Governor Kazuo Ueda stated that wage growth in Japan is expected to persist, supported by a tight labour market. He suggested that these conditions are laying the groundwork for a further interest rate hike. Although the central bank held its policy rate steady in July, it upgraded its inflation forecasts and delivered a more optimistic assessment of the economic outlook.
This week, investors are also awaiting the release of key Japanese economic data, including industrial production, retail sales, and consumer confidence.
Overall, sentiment towards the yen remains mixed, with the USD/JPY pair likely to remain range-bound in the near term.
Technical Analysis: USD/JPY
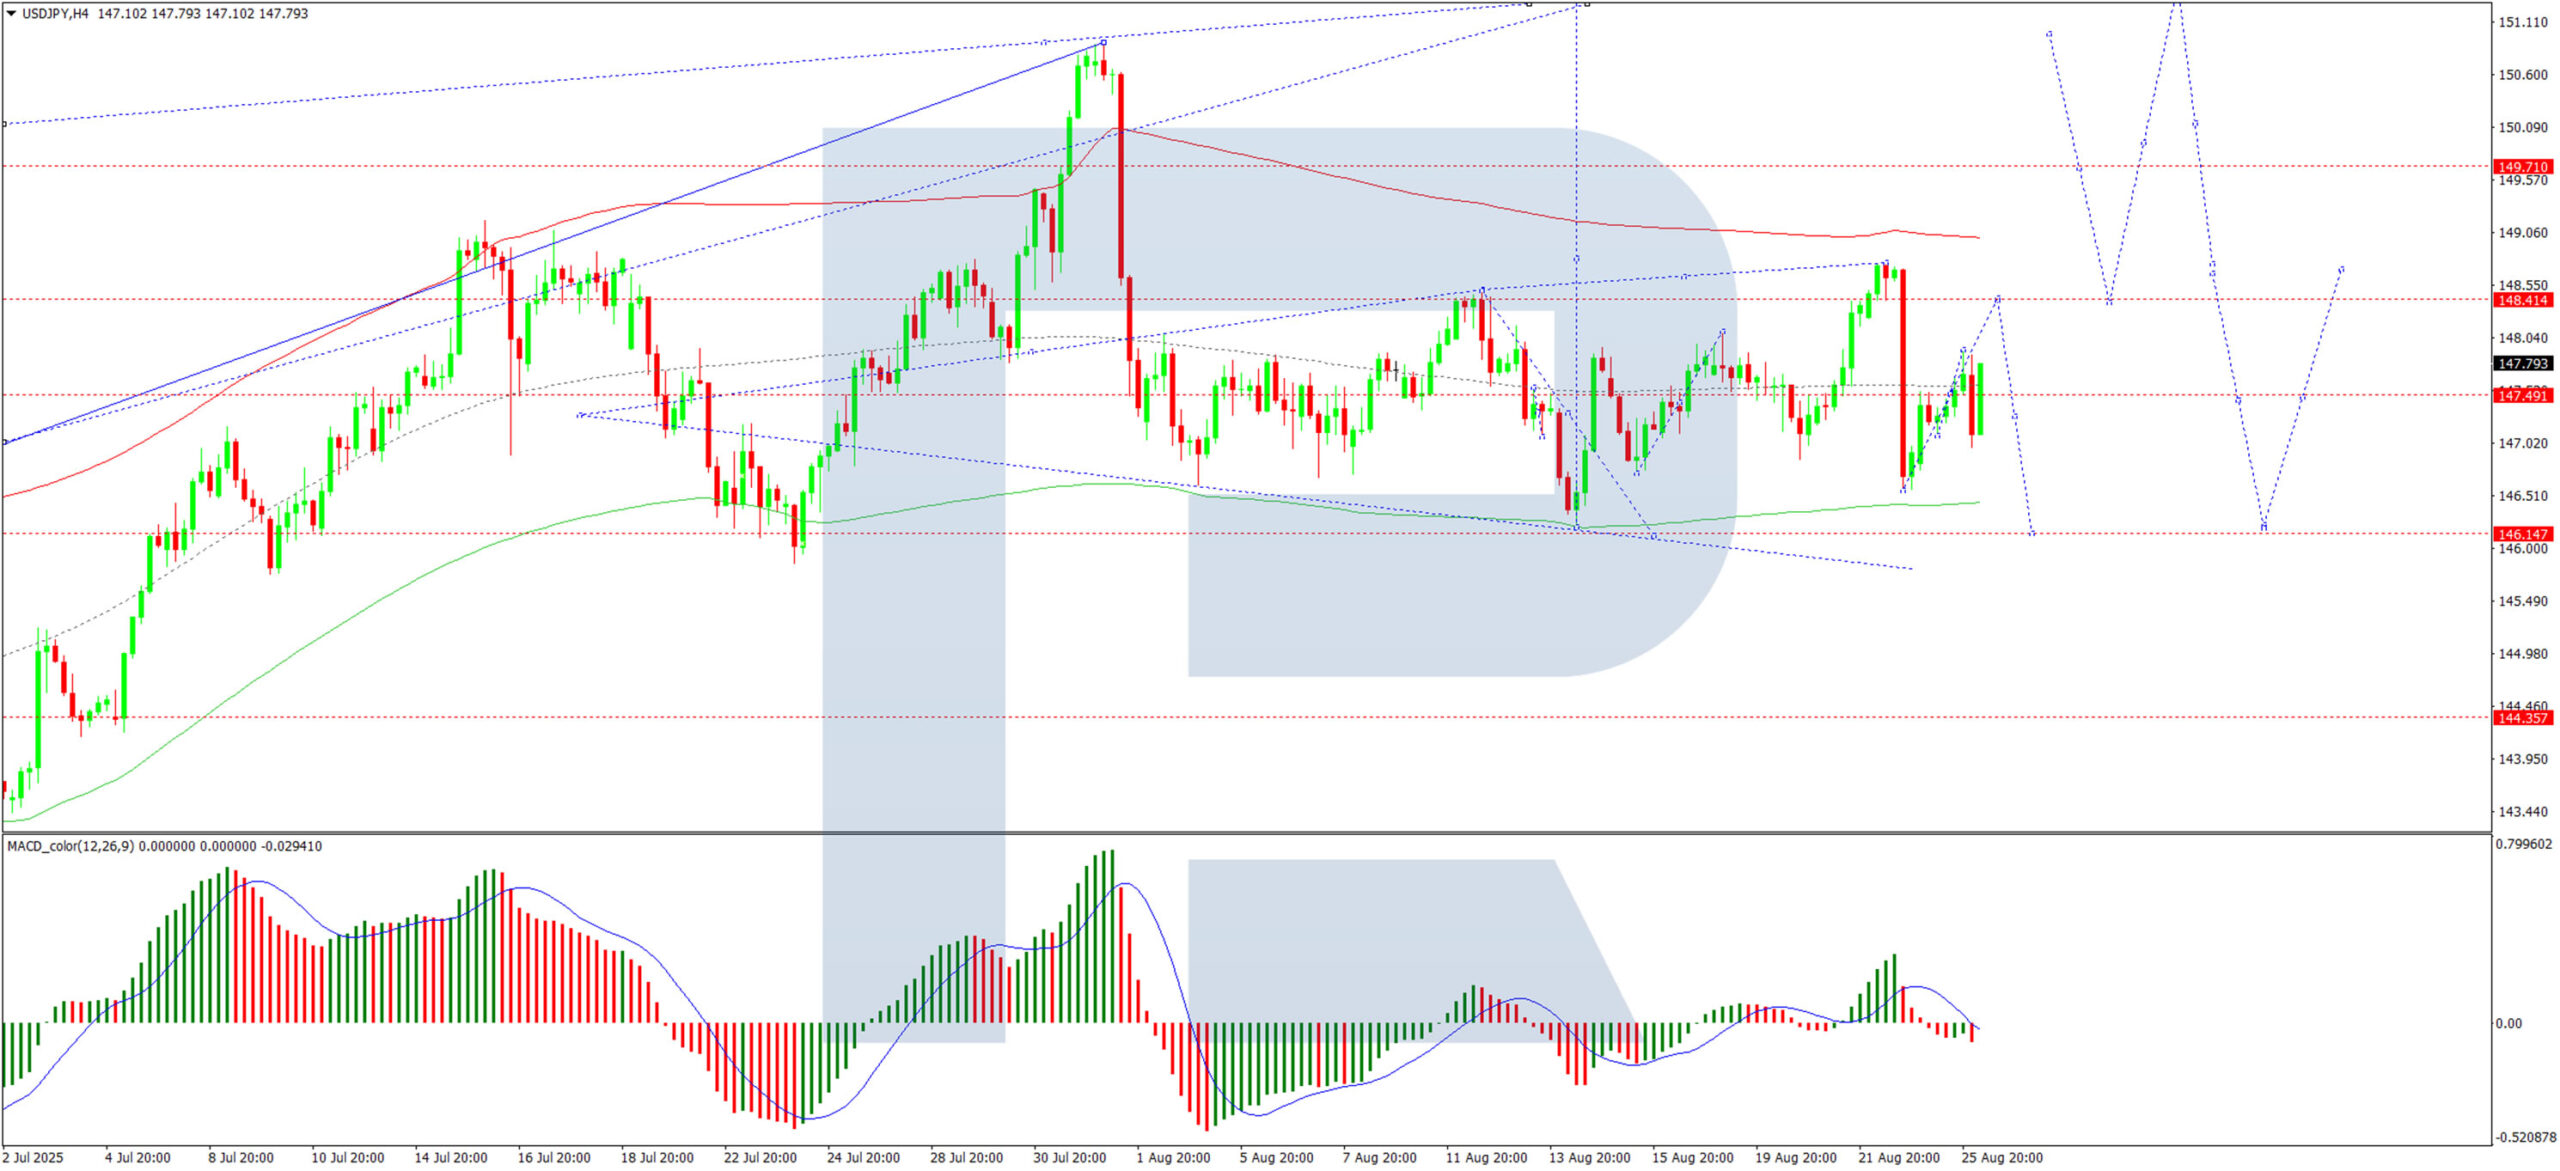
H4 Chart:
The pair continues to trade within a consolidation range around 147.33. The current range extends between 146.55 and 148.76. A further decline towards the 146.14 support level is plausible. If reached, a new upward wave targeting 151.47 would be possible. This outlook is supported by the MACD indicator, with its signal line below zero and pointing sharply lower.
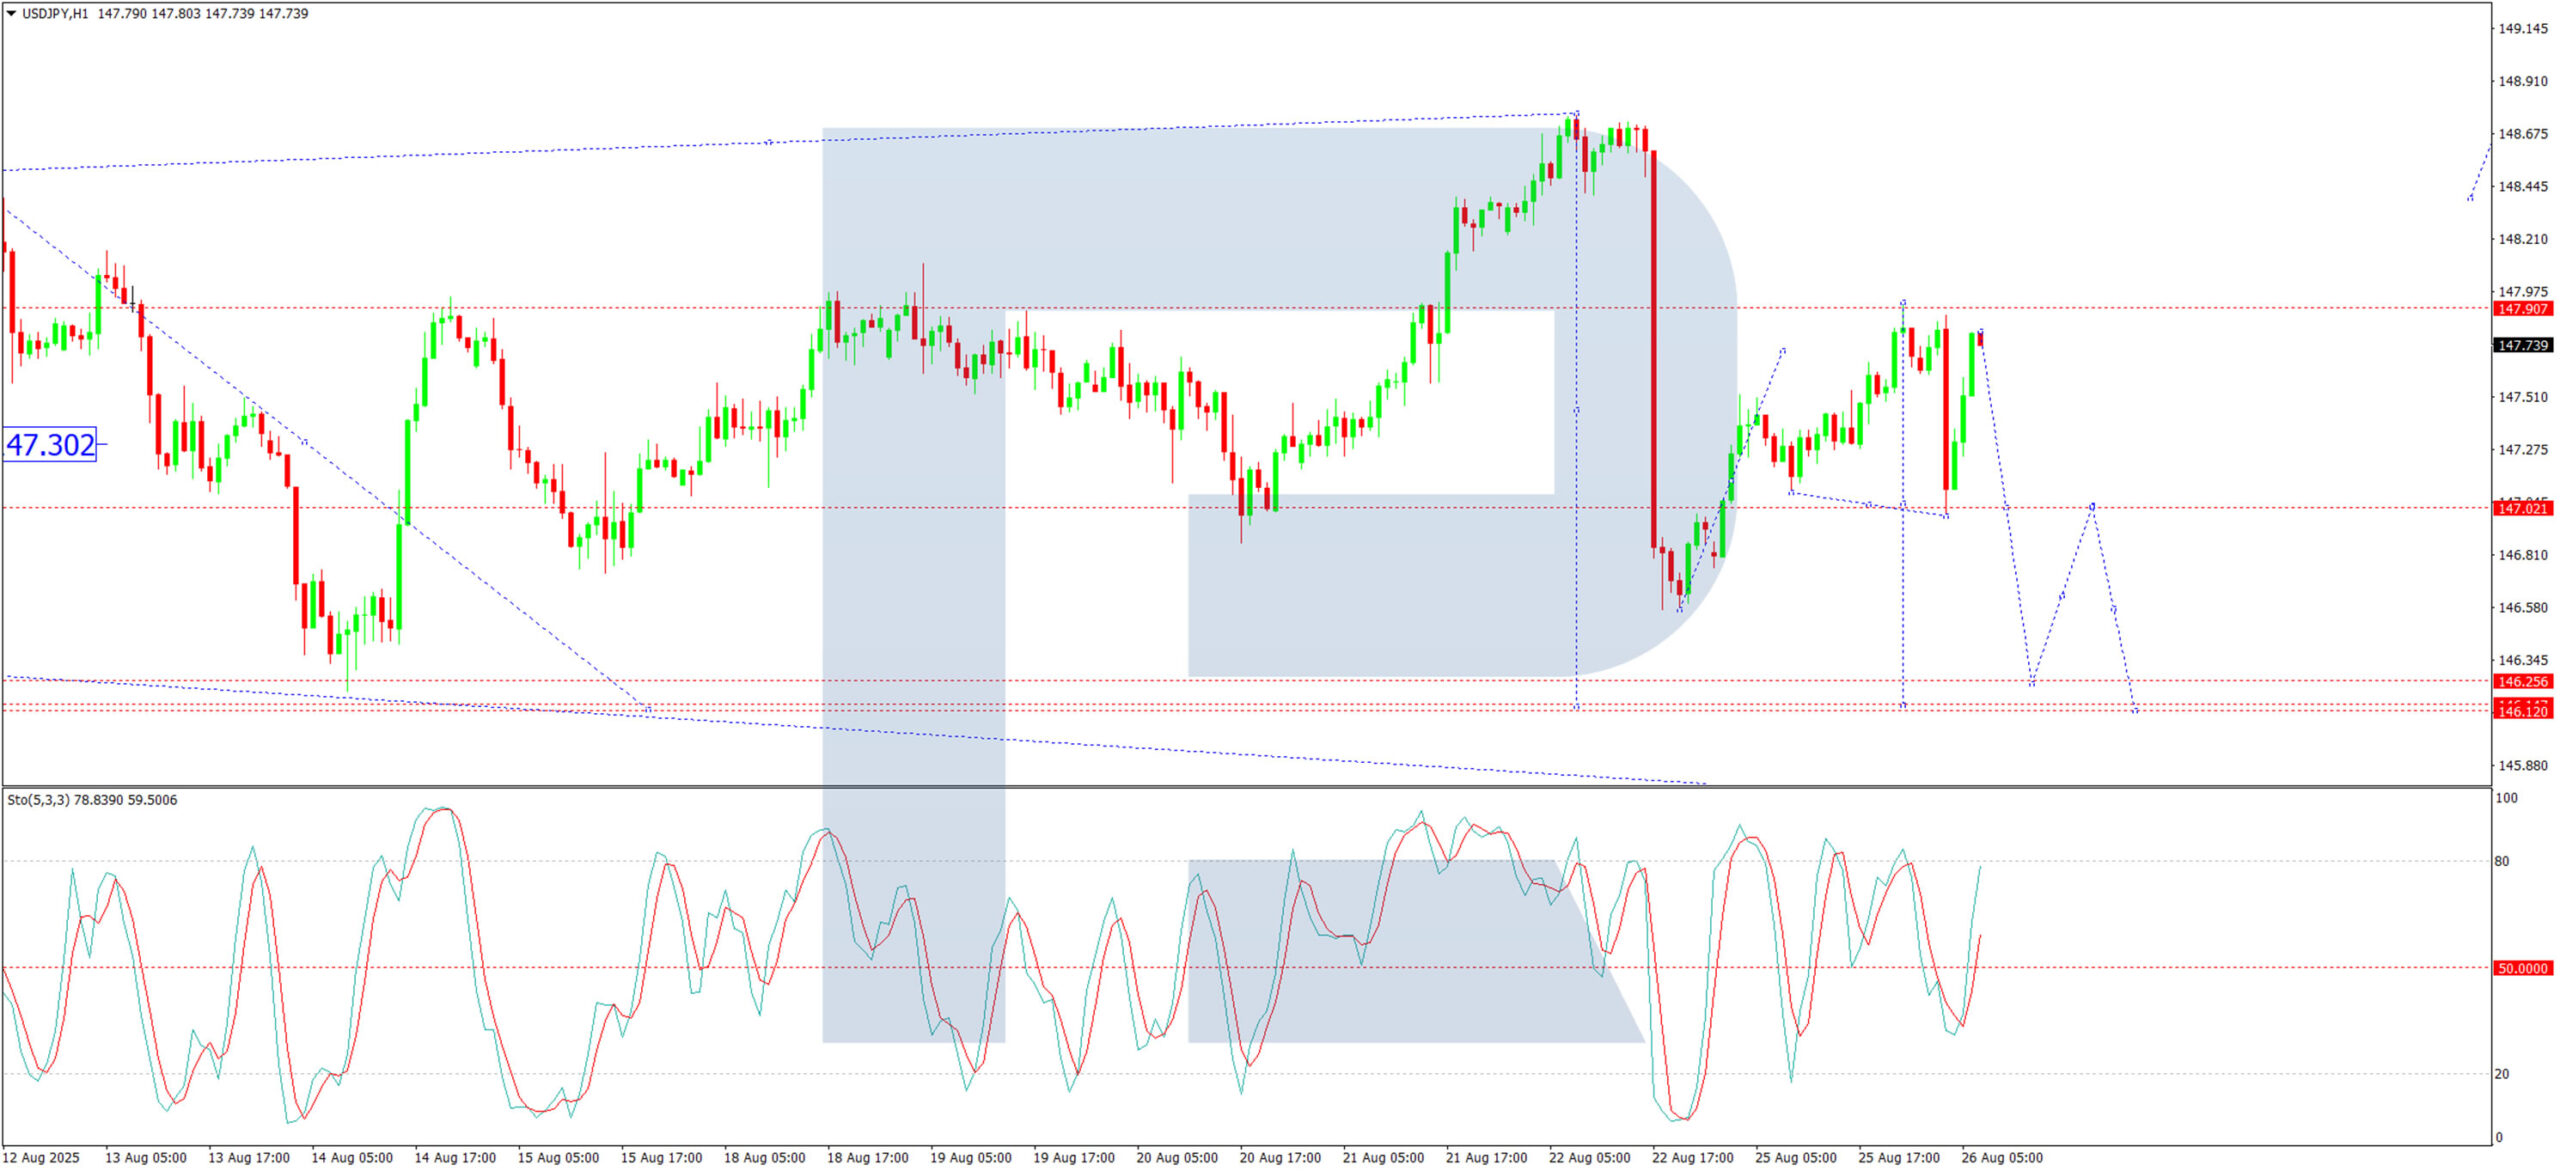
H1 Chart:
The market has completed an upward wave structure to 147.92, followed by a downward leg to 147.00, effectively setting the boundaries of the current consolidation range. A breakout to the upside could see the pair extend its gains towards 148.40. Conversely, a break below support could open the way for a decline towards 146.14. This scenario is corroborated by the Stochastic oscillator, with its signal line below 50 and trending lower towards 20.
Conclusion
The pair is currently caught between fundamental pressures on the dollar and a cautiously hawkish, but data-dependent Bank of Japan. The technical picture suggests a key decision point is approaching, with a breakout of the current consolidation range likely to set the direction for the next significant move.
GBP/JPY Daily Outlook
Daily Pivots: (S1) 198.40; (P) 198.85; (R1) 199.22; More...
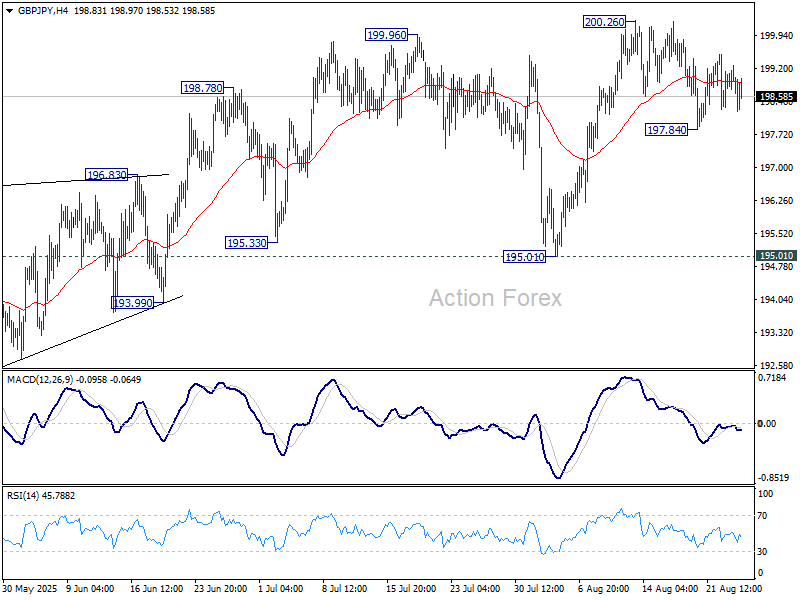
Outlook in GBP/JPY is unchanged as range trading continues, and intraday bias remains neutral. While another fall cannot be ruled out, near term outlook will stay bullish as long as 195.01 support holds. On the upside, firm break of 2002.6 will resume the whole rise from 184.35 to 100% projection of 180.00 to 199.79 from 184.35 at 204.14.
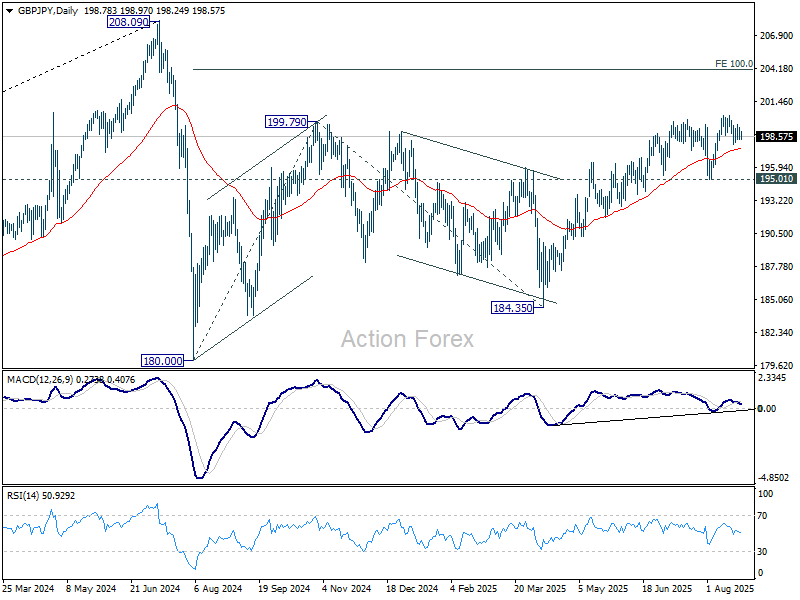
In the bigger picture, price actions from 208.09 (2024 high) are seen as a correction to rally from 123.94 (2020 low). The pattern might still extend with another falling leg. But in that case, strong support should be seen from 38.2% retracement of 123.94 to 208.09 at 175.94 to contain downside. Meanwhile, decisive break of 208.09 will confirm long term up trend resumption.
EUR/JPY Daily Outlook
Daily Pivots: (S1) 171.26; (P) 171.96; (R1) 172.35; More...
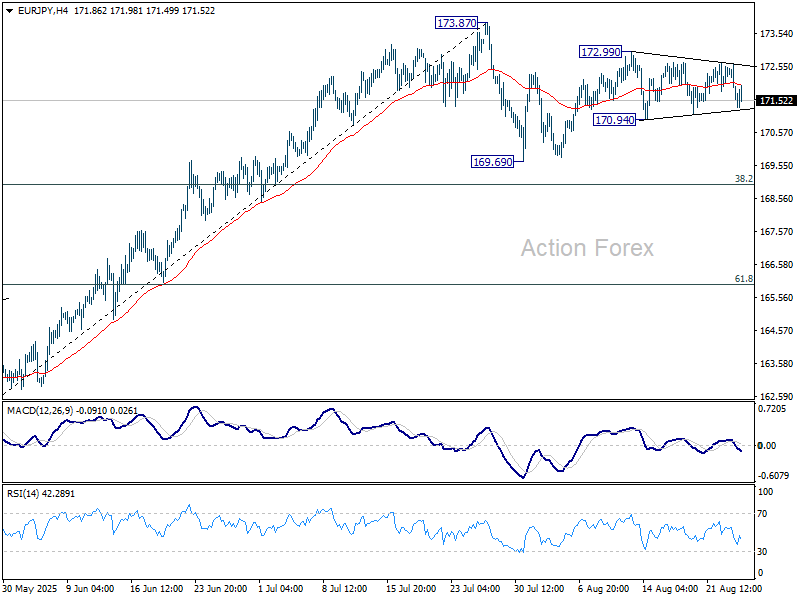
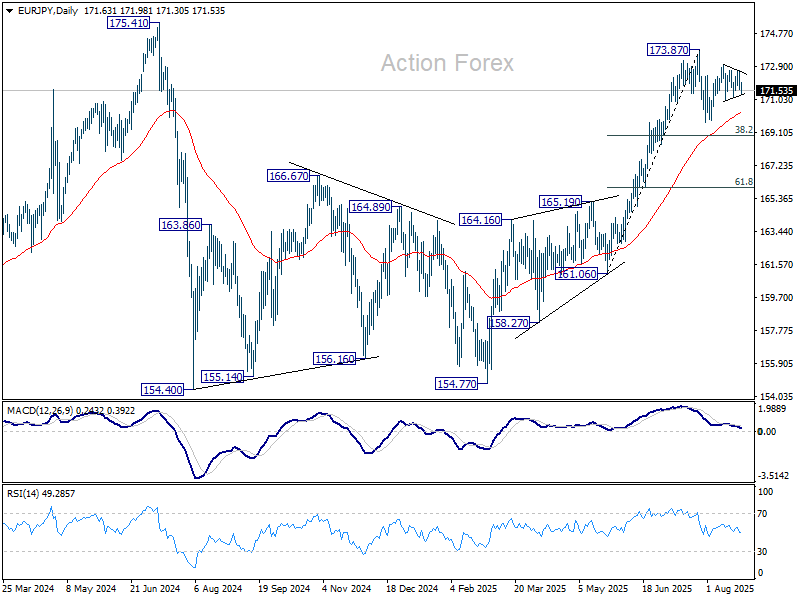
Intraday bias in EUR/JPY stays neutral as range trading continues. Overall price actions from 173.87 are seen as a corrective pattern. On the downside, below 170.94 support will bring deeper fall to 169.69 and possibly below. But downside should be contained by 38.2% retracement of 161.06 to 173.87 at 168.97 to bring rebound. On the upside, above 172.99 will bring retest of 173.87.
In the bigger picture, considering current strong momentum as seen in the rally from 154.77, corrective pattern from 175.41 could have already completed. Decisive break of 154.77 will confirm long term up trend resumption. Next target is 61.8% projection of 124.37 to 175.41 from 154.77 at 186.31. However, rejection by 175.41, followed by firm break of 55 D EMA (now at 170.23) will delay this bullish case.
EUR/GBP Daily Outlook
Daily Pivots: (S1) 0.8619; (P) 0.8647; (R1) 0.8666; More...
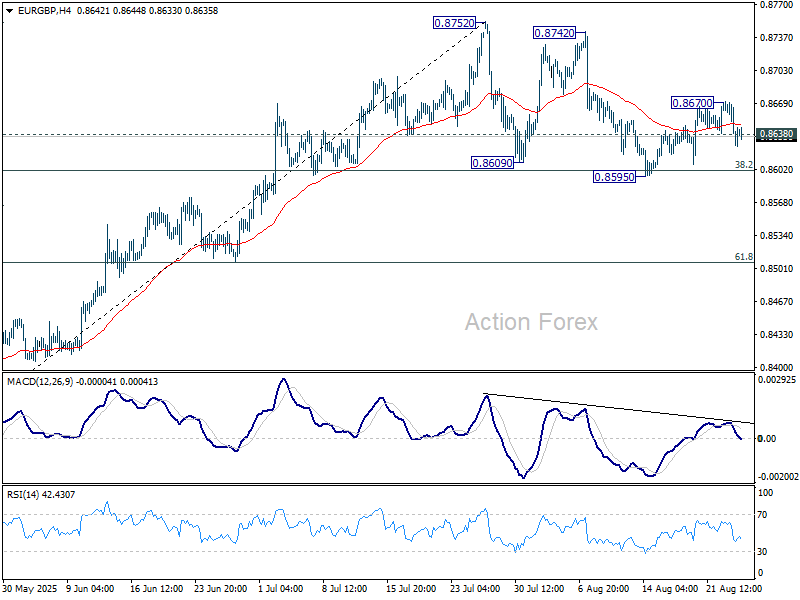
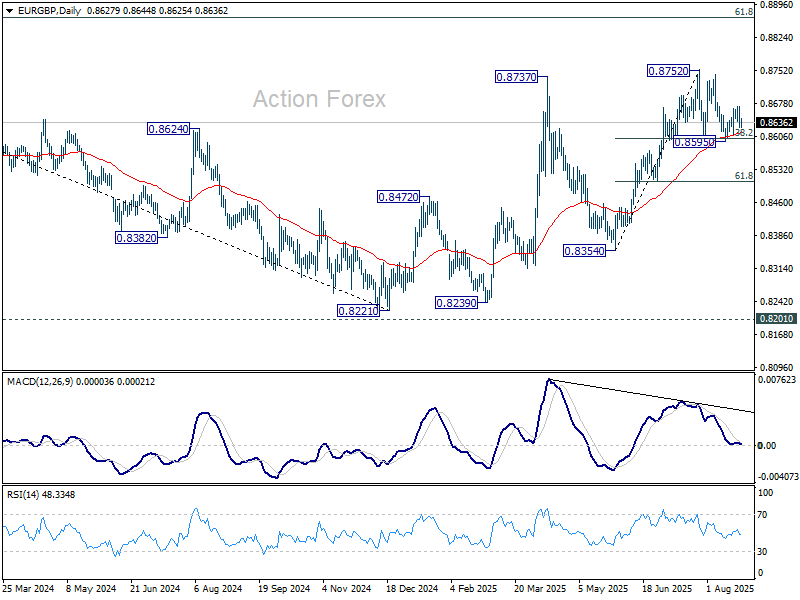
EUR/GBP's break of 0.8630 dampened the original bullish view and turn intraday bias neutral. On the downside, sustained trading below 38.2% retracement of 0.8354 to 0.8752 at 0.8600 will indicate near term bearish reversal and target 61.8% retracement at 0.8506. On the upside, above 0.8670 will resume the rebound from 0.8595 to retest 0.8752 high.
In the bigger picture, the structure from 0.8221 medium term bottom are not impulsive enough to suggest that it's reversing the down trend from 0.9267 (2022 high). But even if it's a correction, further rise is expected to 61.8% retracement of 0.9267 to 0.8221 at 0.8867. This will remain the favored case as long as 55 W EMA (now at 0.8508) holds.
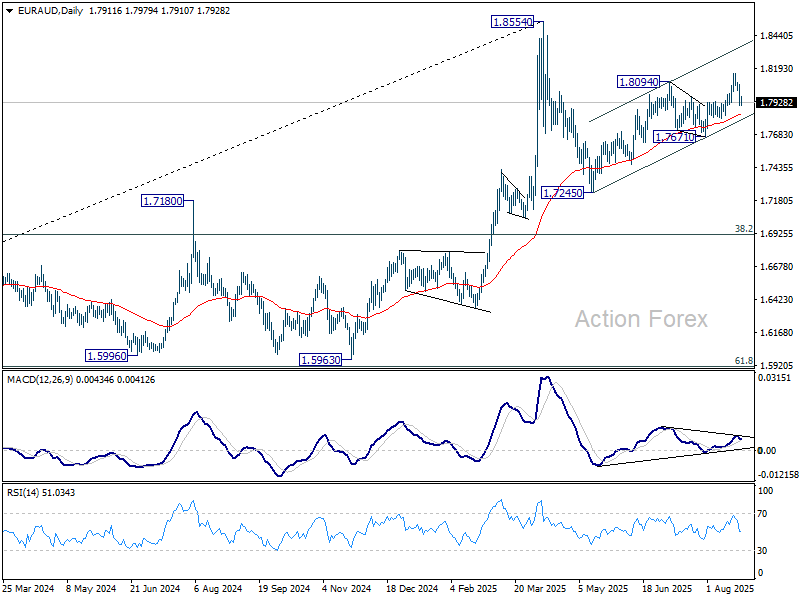
EUR/AUD Daily Outlook
Daily Pivots: (S1) 1.7866; (P) 1.7968; (R1) 1.8028; More...
EUR/AUD's fall from 1.8155 extended lower and the break of 1.79042 support turns intraday bias to the downside. Deeper fall would be seen back to 1.7671 support. Firm break there will suggest that whole rally from 1.7245 has completed. On the upside, above 1.8028 will turn intraday bias neutral again first.
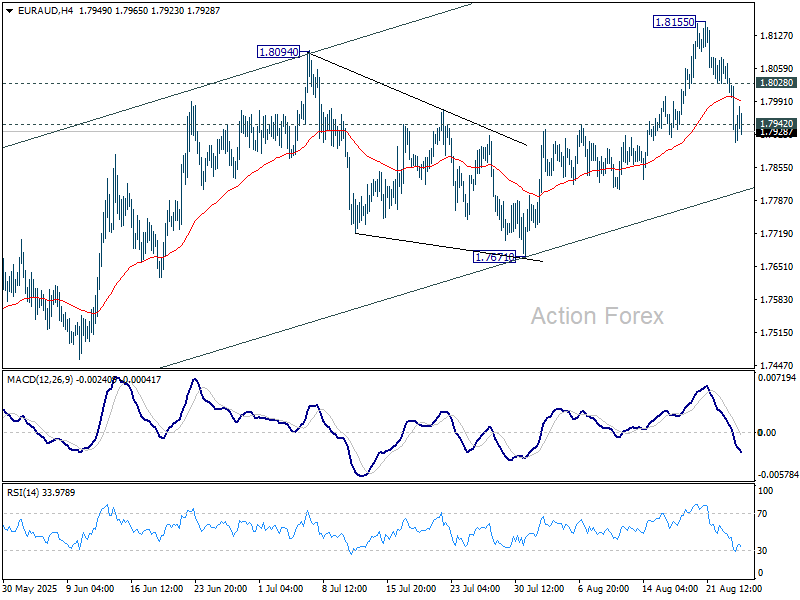
In the bigger picture, price actions from 1.8554 medium term top are seen as a corrective pattern. Such pattern could extend further with another falling leg. But even in that case, downside should be contained by 38.2% retracement of 1.4281 (2022 low) to 1.8554 at 1.6922 to bring rebound. Uptrend from 1.4281 is expected to resume at a later stage.
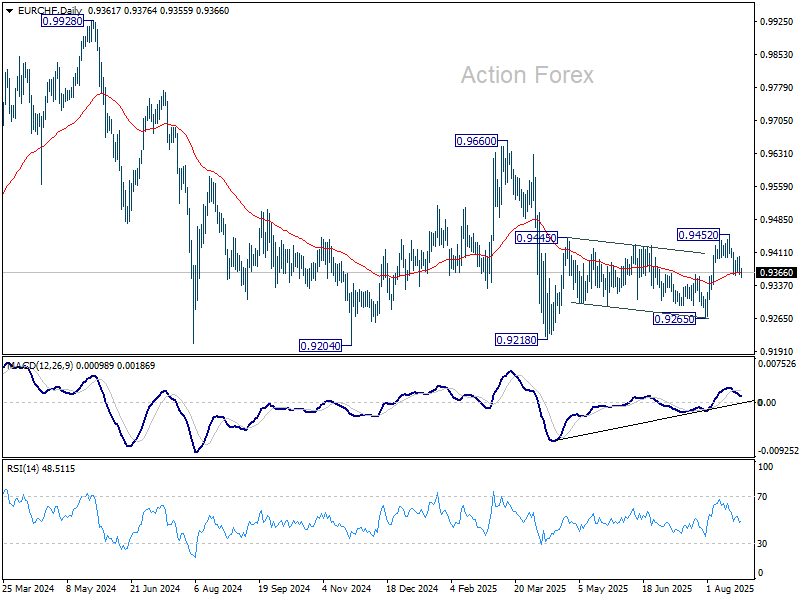
EUR/CHF Daily Outlook
Daily Pivots: (S1) 0.9350; (P) 0.9377; (R1) 0.9392; More....
Intraday bias in EUR/CHF is mildly on the downside with breach of 0.9359 temporary low. Sustained trading below 55 D EMA (now at 0.9366) will argue that the rebound from 0.9128 has completed as a corrective move. Deeper fall would then be seen to 0.9265 support for confirmation. On the upside, above 0.9403 resistance will bring stronger rise to retest 0.9452 instead.
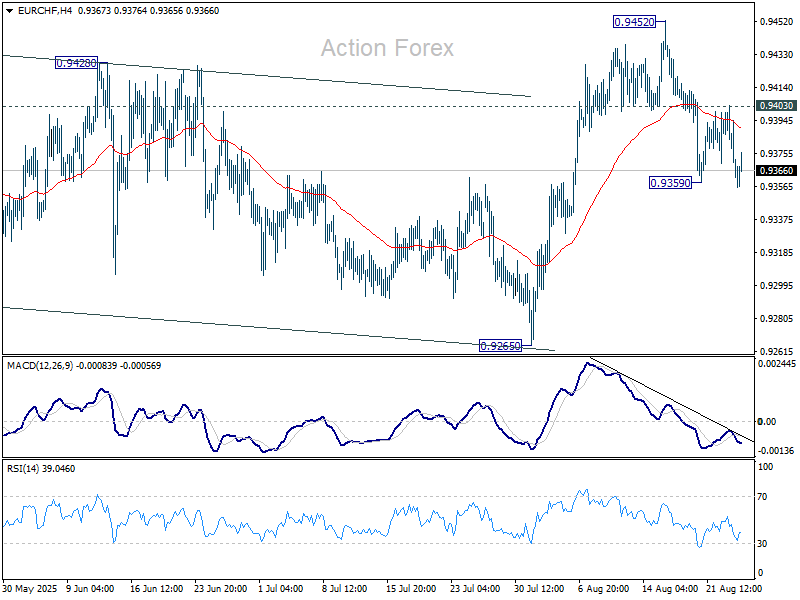
In the bigger picture, the down trend from 0.9204 (2018 high) might still be in progress considering that EUR/CHF is staying well inside the long term falling channel. However, with bullish convergence condition in W MACD, downside potential should be limited in case of another fall. Instead, firm break of 0.9660 resistance will be an important sign of medium term bullish trend reversal.
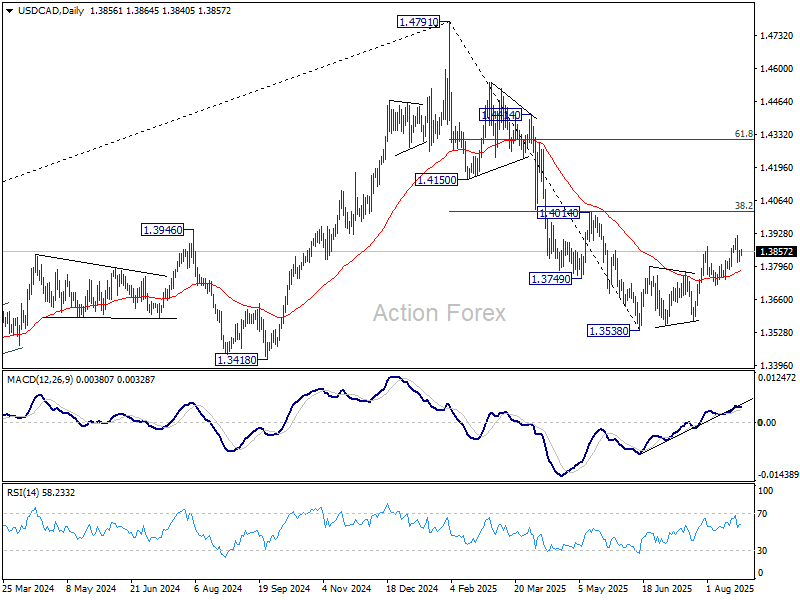
USD/CAD Daily Outlook
Daily Pivots: (S1) 1.3830; (P) 1.3847; (R1) 1.3877; More...
No change in USD/CAD's outlook and intraday bias stays neutral. . Price actions from 1.3538 are seen as a corrective pattern. As long as 1.3720 support holds, another rise could still be seen. However, upside should be limited by 1.4014 cluster resistance (38.2% retracement of 1.4791 to 1.3538 at 1.4017). Meanwhile, firm break of 1.3720 will argue that the corrective bounce has already completed, and bring retest of 1.3538 low.
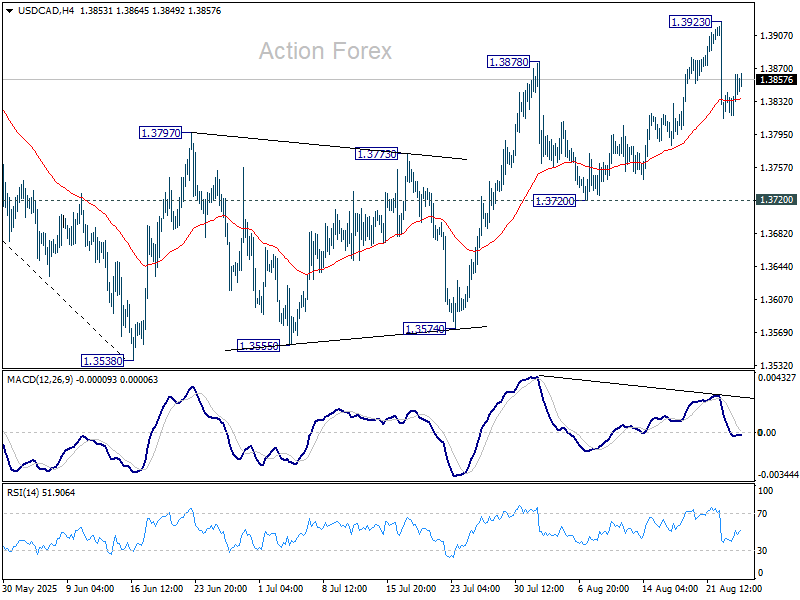
In the bigger picture, price actions from 1.4791 medium term top could either be a correction to rise from 1.2005 (2021 low), or trend reversal. In either case, further decline is expected as long as 1.4014 resistance holds. Next target is 61.8% retracement of 1.2005 (2021 low) to 1.4791 at 1.3069.
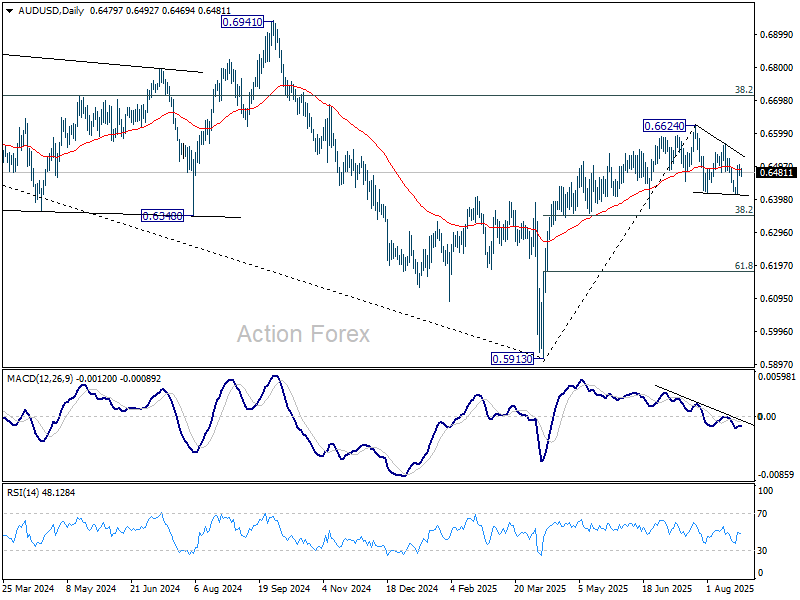
AUD/USD Daily Report
Daily Pivots: (S1) 0.6469; (P) 0.6487; (R1) 0.6502; More...
Intraday bias in AUD/USD remains neutral for the moment, and the corrective pattern from 0.6624 could extend further sideway. On the upside, firm break of 0.6567 will argue that the correction has completed and bring retest of 0.6624 high. However, break of 0.6413 will extend the correction lower towards 38.2% retracement of 0.5913 to 0.6624 at 0.6352.
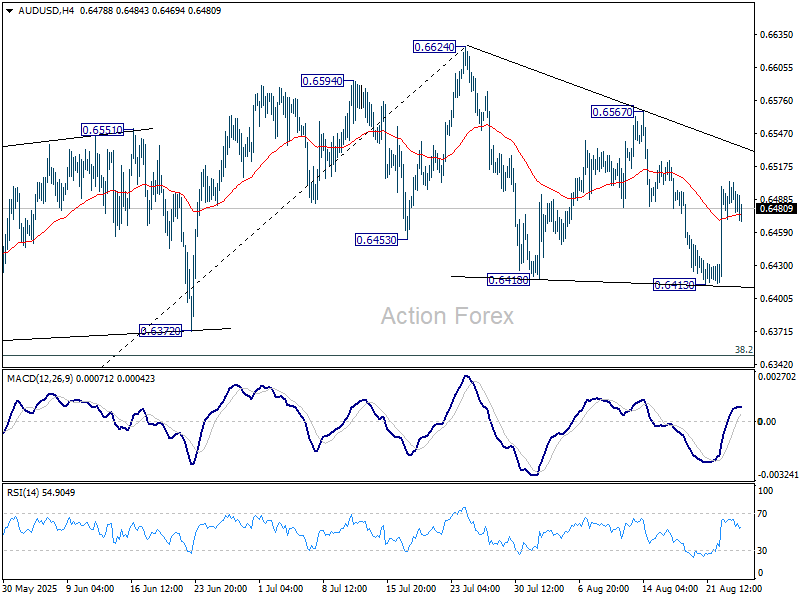
In the bigger picture, there is no clear sign that down trend from 0.8006 (2021 high) has completed. Rebound from 0.5913 is seen as a corrective move. While stronger rally cannot be ruled out, outlook will remain bearish as long as 38.2% retracement of 0.8006 to 0.5913 at 0.6713 holds. Nevertheless, considering bullish convergence condition in W MACD, even in case of another fall through 0.5913, downside should be contained above 0.5506 (2020 low).