Sample Category Title
RBA minutes: Not yet possible to decide pace of further easing
Minutes of RBA’s August 11–12 meeting showed policymakers unanimously backed the 25bps cut to 3.60%, citing stronger evidence that inflation is heading sustainably toward the midpoint of the 2–3% target range. The Board agreed that full employment can be preserved while inflation continues easing, though members noted risks remain in both directions.
The central bank noted that some further reduction in cash rate likely to be needed "in the coming year". But it also stressed that the pace of further reductions will be determined “meeting by meeting” as new data emerges. While some indicators still suggest a tight labor market and inflation projected to stay slightly above target in the medium term, private demand is recovering, supporting the case for a "gradual pace".
At the same time, the minutes noted conditions that could justify a"slightly faster" pace of easing. If the labor market is already "in balance", or if risks shift more clearly to the downside—whether through weaker global growth or slower employment handover—then a quicker reduction in the cash rate could be warranted to avoid undershooting inflation.
Overall, members concluded it is “not yet possible” to judge whether easing will be gradual or slightly faster. RBA left the door open for both paths, emphasizing that data will drive the speed of policy adjustments in the months ahead.
(RBA) Minutes of the Monetary Policy Meeting of the Reserve Bank Board
Sydney – 11 and 12 August 2025
Members present
Michele Bullock (Governor and Chair), Andrew Hauser (Deputy Governor and Deputy Chair), Marnie Baker AM, Renée Fry-McKibbin, Ian Harper AO, Carolyn Hewson AO, Iain Ross AO, Alison Watkins AM, Jenny Wilkinson PSM
Others present
Sarah Hunter (Assistant Governor, Economic), Christopher Kent (Assistant Governor, Financial Markets)
Anthony Dickman (Secretary), David Norman (Deputy Secretary)
Meredith Beechey Osterholm (Head, Monetary Policy Strategy), Sally Cray (Chief Communications Officer), David Jacobs (Head, Domestic Markets Department), Michael Plumb (Head, Economic Analysis Department), Penelope Smith (Head, International Department)
Brad Jones (Assistant Governor, Financial System), Andrea Brischetto (Head, Financial Stability Department) and James Bishop (Senior Manager, Financial Stability Department), for discussion of the item on macroprudential policy advice
Financial conditions
Members commenced their discussion of international financial conditions with the observation that prices of risky financial assets had remained buoyant, despite continued elevated uncertainty over future tariff policies and the global economic outlook. Equity prices had reached new highs, and equity risk premia and corporate bond spreads remained low, including in Australia. Members noted that it was possible these developments could be justified by fundamentals, including: company earnings reports having generally been positive; fiscal policy settings being broadly supportive of economic activity (particularly in the United States); retaliation against US tariffs having been somewhat lower than initially feared; and a recognition that global monetary policy could provide further support to economic activity if needed. However, an alternative view was that financial markets were too sanguine about risks. If so, sufficiently material or persistent news that contradicted the benign outlook currently priced in by financial markets could trigger heightened risk aversion and a sharp correction in asset prices.
Members noted that market participants expected further monetary policy easing in several developed economies, including the United States, the United Kingdom and Australia. In the United States, inflation had remained stable and unemployment was still close to historical lows despite a recent slowing in employment growth. However, tariff and immigration policies and fiscal settings were creating various risks to US inflation and unemployment, at least in the near term. Meanwhile, the Bank of England had reduced its policy rate in August and signalled a gradual and careful approach to further easing, amid upward revisions to its inflation and near-term unemployment forecasts. By contrast, central banks in the euro area, Canada and New Zealand had already reduced interest rates significantly and markets were pricing in only limited further easing by these central banks.
In sovereign bond markets in advanced economies, 10-year bond yields had remained broadly unchanged over the previous 12 months, despite some shorter term volatility. However, 30-year bond yields had gradually trended higher in several economies – including the United States, Germany, the United Kingdom and Japan. This was consistent with term premia rising in response to prospects for large deficits adding to already-high levels of public debt in some of these economies.
The RBA’s commodity price index had been little changed overall since the July meeting, despite some movements in the index’s components, including in response to shifting tariff policies. Gold prices had increased further and remained at very high levels. Iron ore prices had declined slightly, following earlier supply disruptions in Australia and Brazil, but remained higher than at the start of April. Oil and base metals prices had risen modestly. Members noted that base metals prices historically had been a useful guide to the near-term outlook for global industrial production.
The Australian dollar exchange rate had been little changed on a trade-weighted basis since the May meeting and was broadly in line with its typical relationship with interest rate differentials and commodity prices. Members acknowledged that there were many influences on the exchange rate and that there was no reason to believe the contribution from lower interest rates in Australia differed from what is typically the case.
Members noted that the easing of monetary policy in Australia had also been affecting other determinants of domestic financial conditions as expected. The decline in the cash rate had been passed through to interest rates for households and businesses. As a result, households’ scheduled mortgage payments (as a share of disposable income) had declined from their earlier peak and would decline further into next year if the cash rate were to follow market expectations. Members noted that scheduled mortgage payments were nevertheless projected to remain somewhat higher than in the past, reflecting both a higher level of debt relative to household incomes and a market path for the cash rate that remained well above historical lows. Households’ extra payments into their offset and redraw accounts had also declined a little as a share of household disposable income, consistent with the easing in interest rates.
Growth in household credit had picked up further, alongside a lift in housing market activity. Household credit was now growing at a similar pace to household disposable income, having risen more slowly than household incomes over the prior two or three years, when monetary policy was more restrictive. Commitments for new housing loans had risen since the cash rate was first reduced in February, but were not yet at a level that historically would have signalled a significant further rise in credit growth. Growth in business credit had continued to outpace growth in GDP.
Members discussed conditions facing smaller businesses, drawing on private surveys and insights from the RBA’s 33rd annual Small Business Finance Advisory Panel in July, which were due to be published in an upcoming Bulletin article. Increased lending competition among both banks and non-banks had improved the availability of financing. However, surveyed business conditions for small businesses remained weaker than those for large businesses, and panellists noted that profit margins had been squeezed by strong growth in labour and other costs in recent years.
Market expectations for the path of the cash rate were slightly below their level ahead of the May meeting, but a little higher than had been the case prior to the July meeting. Market participants were anticipating a 25-basis point cut at the current meeting, with two further cuts by early 2026.
International economic conditions
Turning to international economic conditions, members noted that trade policy uncertainty had declined somewhat over preceding months but remained significant. While the most recently announced US tariff rates were higher than had been assumed in the May Statement on Monetary Policy, retaliation by other jurisdictions had been limited and the United States had announced that it had reached tariff agreements with some of its largest trading partners. Global GDP growth had so far proved resilient to trade policy developments over the first half of the year, and global trade flows – most prominently with China – had been redirected quite rapidly. Reflecting these developments, members assessed that the risks to the global growth outlook from higher US tariffs were still tilted to the downside, but the more extreme downside scenarios were now seen as less likely to materialise.
GDP growth in Australia’s major trading partners was still expected to slow over the second half of 2025 and into 2026 as higher tariffs and broader policy uncertainty weigh on global activity. This central outlook was largely unchanged from the May baseline forecast. The impact of US tariffs on economic growth was expected to be concentrated largely in the United States. Members discussed the extent to which US trade and other policy changes could also weigh on longer run growth in US potential output. By contrast, medium-term growth in Australia’s other trading partners was expected to slow to a lesser extent, supported by adjustments in trade flows, stimulatory fiscal policy in some economies and less-restrictive monetary policy. Members discussed whether it was plausible to assume that the effects of sharply higher US tariffs might be mostly contained to North American economies. A change of this nature historically would also have had major implications for east Asian economies. However, there was not yet evidence that a material share of the cost of US tariffs was being paid by Asian exporters, and there were reasons to believe that the region may be capable of sustaining economic growth in the face of weaker US growth.
Near-term output growth in China was expected to remain relatively resilient. Fiscal stimulus was already supporting growth, and the staff assessed that the Chinese authorities would expand stimulus further if required to mitigate adverse effects from higher tariffs or ongoing weakness in the Chinese property sector.
Domestic economic conditions
Members noted that recent international developments had thus far had little discernible adverse effects on domestic economic conditions. Forward-looking indicators from consumer and business surveys had been resilient, in contrast to the sharp falls observed initially in other developed economies. Given the typical lags, any effects of increased trade policy uncertainty on spending were expected to become evident only from late 2025 and, even then, were expected to be modest. Members noted the staff’s assessment that global trade policy developments were likely to have a modest disinflationary effect on Australian import prices.
Taken together, data on economic activity and inflation since the May Statement on Monetary Policy had been broadly in line with the staff’s expectations. The updated forecasts suggested that supply and demand in the labour market – and the economy more broadly – were expected to be close to balance over the forecast period, and that inflation was expected to return to around the midpoint of the 2–3 per cent target range.
The gradual recovery in year-ended GDP growth observed in the March quarter was expected to continue, driven by an ongoing lift in private demand and supported by growth in public demand. The pick-up in GDP growth over the remainder of 2025 was, however, expected to be more gradual than previously forecast, given an expectation that most of the weaker-than-expected outcomes for public demand earlier in the year would not be recouped. Consistent with market pricing, the forecasts assumed a cumulative 80 basis points of further easing in the cash rate over the coming year, including an expected reduction at this meeting. Members considered how the past and expected easing in monetary policy might be affecting housing market conditions. They concluded that increases in housing prices were so far within the expected range based on previous easing cycles. Dwelling investment was showing clear signs of strengthening.
The staff’s forecasts for GDP growth in the medium term had been reduced a little because of a lower assumed rate of productivity growth to which the economy would return by the end of the forecast period. This downgrade, described in detail in a dedicated chapter of the August Statement on Monetary Policy, reflected the staff’s assessment that some of the headwinds that had lowered productivity growth over the preceding decade or two were likely to persist over the coming two years. Members discussed the implications of the changed productivity growth assumption for other components of the forecasts. It implied that the economy’s supply capacity was expected to be commensurately lower over the forecast period; the forecasts for growth in wages and incomes had also been revised down in line with historical relationships with productivity growth. Members noted the staff’s judgement that, because lower productivity growth was associated with lower growth in both potential supply and aggregate demand, this did not change their assessment of current or future spare capacity, nor of domestic inflationary pressures.
Turning to the labour market, members noted that conditions had eased a little over preceding months, in line with the staff forecasts. The unemployment rate had increased to 4.3 per cent in June and was expected to stay around that level over the forecast period. Employment growth had been subdued in May and June. Members discussed how much signal to take from this, and how likely it was that the expected slower growth of non-market sector employment over the forecast period would be absorbed by faster market sector employment growth and less rapid growth in labour supply. They observed that other indicators had been more resilient. The participation rate and employment-to-population ratio remained around historical highs. And leading indicators such as job advertisements and vacancies had also been little changed in preceding months and pointed to stable labour market conditions in the near term.
Members discussed the assessment that some tightness in labour market conditions remained, noting the associated uncertainty. A range of indicators supported that judgement, namely: the ratio of job vacancies to unemployed workers was still somewhat high; firms continued to report some difficulty finding labour; the underemployment rate and hours-based measure of labour underutilisation had been little changed at low levels; and growth in unit labour costs remained high. Members noted that some other indicators were consistent with more balanced conditions in the labour market. For instance, there had been a small increase in the unemployment rate in June – including an increase in the rates of youth unemployment and medium-term unemployment – and the rate of job-switching had been subdued for some time. Wages growth had also been trending down in year-ended terms, though recent quarterly outcomes had been relatively stable at rates slightly above what the staff assessed to be consistent with balance in the labour market. The staff expected only a slight easing in quarterly wages growth over the forecast period. The forecasts suggested the economy would be close to full employment over much of the forecast period on the assumption that the cash rate followed the market path. However, members noted that, as the economy approaches balance, it was becoming more challenging to determine if there was spare capacity in the labour market.
Members noted that underlying inflation had continued to ease as expected in the May Statement on Monetary Policy. In year-ended terms, trimmed mean inflation had declined from 2.9 per cent in the March quarter to 2.7 per cent in the June quarter. In quarterly terms, trimmed mean inflation had eased from 0.7 per cent to 0.6 per cent. Headline inflation had been 2.1 per cent over the year to the June quarter, also as expected in May. The easing in inflation over the preceding year had been broadly based across expenditure categories, though lower fuel prices and the effect of temporary electricity rebates had pushed headline inflation well below underlying inflation.
The outlook for inflation was little changed from the May forecast. Underlying inflation was expected to be around 2½ per cent over the forecast period, on the assumption that there was some further gradual easing in the cash rate consistent with the market path. Headline inflation was expected to increase temporarily over the second half of 2025 to around 3 per cent, before returning close to the midpoint of the target range over the latter part of the forecast period. This volatility reflected the legislated unwinding of electricity rebates, which would boost headline inflation over 2025 and 2026.
Members noted that there were risks to the forecasts for domestic activity and inflation in both directions. They agreed that the most material risks related to uncertainty around the assessment of spare capacity, the strength of the recovery in domestic demand, and the extent to which global trade and other policy developments would affect output growth and inflation.
Considerations for monetary policy
Turning to considerations for the monetary policy decision, members noted that data received since the previous meeting had been broadly as expected. Inflation was forecast to return sustainably to the midpoint of the 2–3 per cent target range over the forecast period, and conditions in the labour market were expected to be close to balance over that time. Members noted that the downward revision to the assumption for medium-term productivity growth was judged not to have implications for the degree of inflationary pressure, and hence for the stance of monetary policy.
Members noted that output growth in Australia was still subdued but was showing signs of picking up. Uncertainty about the outlook for the global economy remained significant but had declined somewhat over prior months as the prospect of retaliation against US tariffs had abated. Members agreed that financial conditions had eased since the start of the year as the cash rate had been reduced and risk premia in financial markets had fallen, but that the current stance of monetary policy was still somewhat restrictive. Members noted that the response of the economy at this stage to the easing in financial conditions was broadly consistent with historical experience.
Members agreed that the information received since the previous meeting had provided the further support that they had been seeking for the judgement that inflation was heading sustainably towards the midpoint of the target range. Members observed that the staff forecasts were consistent with the Board achieving its inflation and full employment objectives over the medium term, conditional on reducing the cash rate at this meeting and somewhat further thereafter. However, there were plausible risks to these forecasts in both directions. Members unanimously agreed that these considerations formed a strong case for lowering the cash rate target by 25 basis points at this meeting.
Members agreed that monetary policy would be well positioned following this decision to respond to future data and shocks that may emerge. Against that backdrop, they discussed their views on the economic outlook and the policy strategy required to ensure that the economy was in balance over the medium term.
Members agreed that – based on what they knew at the time of the meeting – preserving full employment while bringing inflation sustainably back to the midpoint of the target range appeared likely to require some further reduction in the cash rate over the coming year. They also agreed that it was important for the pace of decline in the cash rate to be determined by the incoming data on a meeting-by-meeting basis.
In assessing the likely pace of reduction in the cash rate over the period ahead, members noted several considerations that may warrant a gradual pace being adopted. The first was that various indicators suggested that labour market conditions remained a little tight, and the forecast for inflation was for it to be marginally above the midpoint of the target range in the medium term. In addition, private demand was showing signs of recovering, with risks on both sides of the forecast. And uncertainty about the degree of spare capacity and the neutral interest rate could warrant a measured approach to assess what incoming information reveals about these and other uncertainties.
On the other hand, other considerations might warrant a slightly faster reduction in the cash rate over the coming year. Members noted that such an approach would be appropriate if the labour market turned out already to be in balance. In such circumstances, maintaining a slightly restrictive stance of monetary policy could result in inflation undershooting the midpoint of the target range as excess capacity emerged in the labour market. A slightly faster reduction would also be appropriate if the overall balance of risks to the forecasts became more clearly skewed to the downside, perhaps because of adverse developments in the global economy or the anticipated handover from non-market sector to market sector employment growth not proceeding smoothly.
Members agreed that it was not yet possible to judge between these alternative scenarios for the pace of future reduction in the cash rate, given the prevailing uncertainties. In light of this, they emphasised the need to be attentive to the data and to be guided by how they shape the evolving assessment of risks. The Board will remain focused on its mandate to deliver both price stability and full employment and will do what it considers necessary to achieve that outcome.
The decision
The Board decided unanimously to lower the cash rate target by 25 basis points to 3.6 per cent.
Assessing the RBA’s government bond holdings
Members returned to their April 2025 discussion on whether the RBA should increase the pace at which its holdings of government bonds were running down. At that time, the Board had determined that there were no clear monetary policy or financial stability reasons to vary the approach chosen by the Reserve Bank Board in December 2023, which was to hold to maturity the bonds that had been purchased during the COVID-19 pandemic. International market developments since then had strengthened that policy conclusion. Indeed, some other central banks had responded to recent market developments by slowing their pace of unwinding bond holdings.
The scale and maturity structure of the bond holdings did, however, have implications for the RBA’s portfolio risks and returns, and so members had sought the views of the Governance Board as to whether the pace of rundown should be guided by these considerations. The advice received from the Governance Board had been that, while increasing the pace of rundown through bond sales would result in a faster reduction in interest rate risk on the RBA’s balance sheet, the risk reduction would be moderate compared with the RBA’s overall financial risk and would be outweighed by an expected financial cost (given the level of prevailing bond prices) and a potential increase in non-financial risks. Given the absence of persuasive arguments from either a policy or a risk-reduction perspective, the Board determined that bond holdings should continue to run down as they mature and that this matter no longer warranted active consideration.
Financial stability advice to the CFR and APRA
Members discussed and approved financial stability advice that the staff had prepared for the RBA to provide to the Council of Financial Regulators (CFR) and the Australian Prudential Regulation Authority (APRA) at the next CFR meeting. This was in keeping with the commitments the RBA had made in the recently updated CFR Charter and Memorandum of Understanding between the RBA and APRA (and is consistent with recommendations in the RBA Review).
In the context of declining interest rates, members supported APRA’s recent position to keep macroprudential policy settings unchanged, given any loosening had the potential to amplify macro-financial vulnerabilities. Members also supported efforts by APRA, as the macroprudential policy authority, to work with industry to ensure that a range of macroprudential tools could be deployed in a timely manner if needed.
USDCHF in Focus as the Pair Oscillates Above 0.80 Mark
The US Dollar has been at the center of significant volatility over the past few weeks, navigating a softer NFP release at the beginning of the month, a notably stronger PPI report, and a Federal Reserve Chair Powell who was interpreted as dovish despite his measured tone.
This led to a drop in the Greenback last Friday, followed by a minor rebound in today's session.
On the other hand, the Swiss Franc hasn't pursued its strengthening trend against its major counterparts as the Swiss National Bank got caught in a massive disinflationary trend, forcing their dovish tone.
As a reminder, Switzerland has achieved one of the worst tariff deals with the US, with the Swiss products marked up 39% as they arrive in the US, hurting their export-oriented economy.
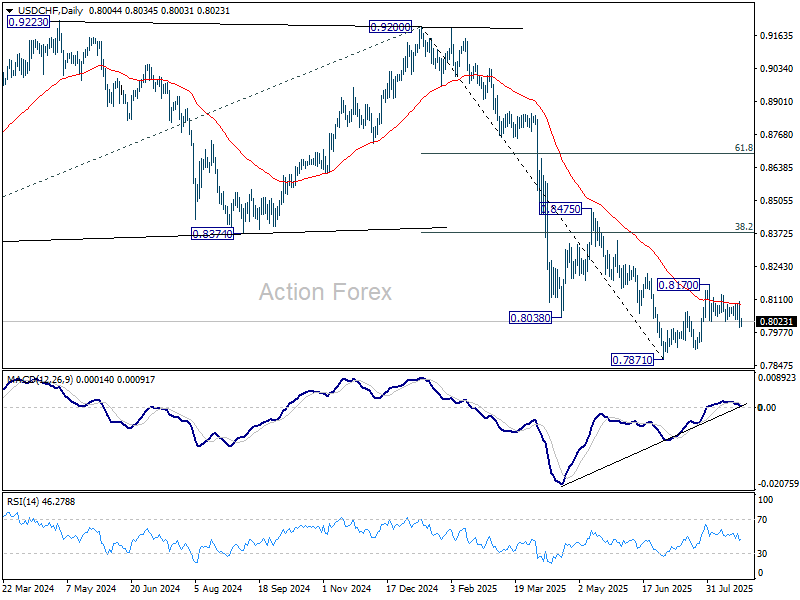
USD/CHF was one of the FX pairs that saw the most consistent decline throughout the start of 2025, dropping by as much as 14.77% from peak to trough.
The 2025 and 14-year lows sit at 0.7875.
However, since its lows were formed with a double bottom, the pair is now trading back above the key 0.80 psychological level.
Current price action is now reflecting indecision from a confluence of technical patterns.
We will examine how these patterns are influencing the current price action and identify potential breakout levels for upcoming trading.
USDCHF Multi-timeframe technical analysis
USDCHF Daily Chart
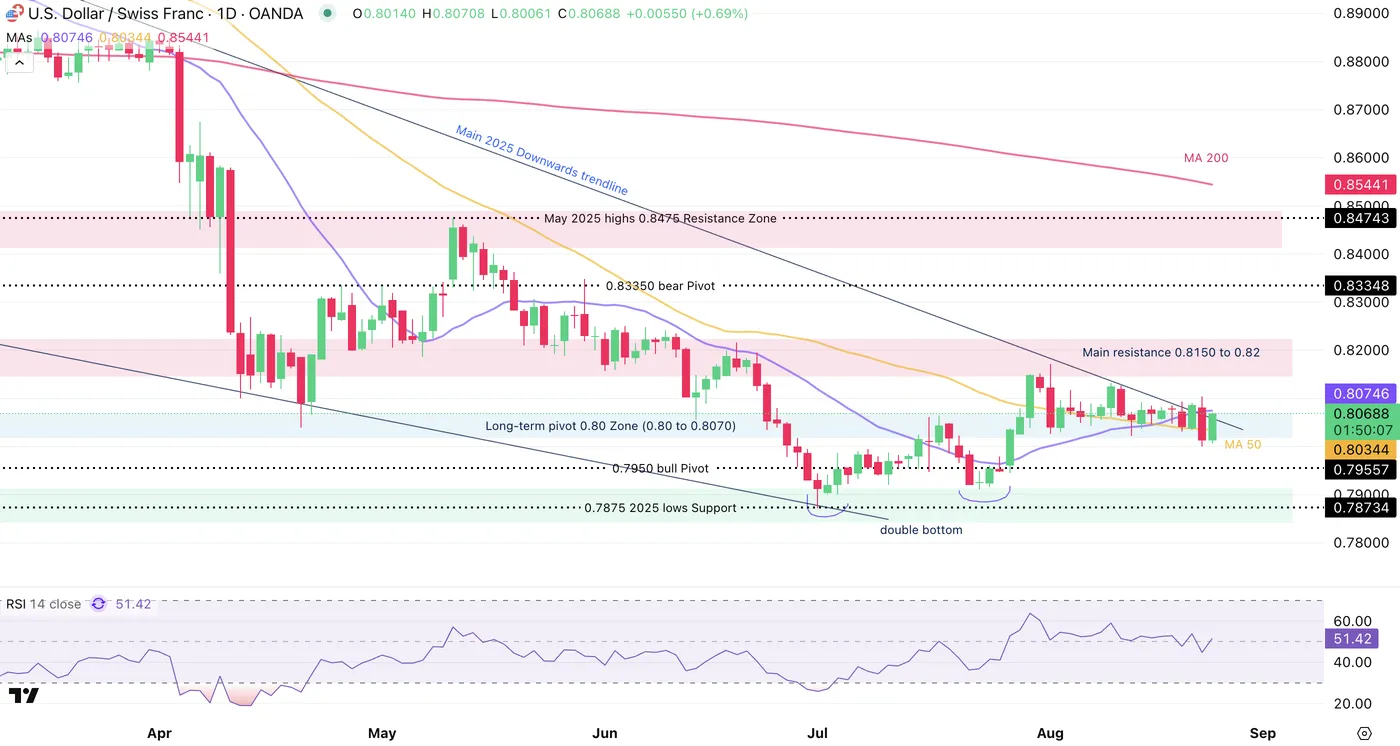
USDCHF Daily Chart, August 25, 2025 – Source: TradingView
Bulls have rebounded sharply from the Friday down-move in the pair, but looking at the past 9 days of price action hasn't led to much.
Prices are holding within the Daily pivot zone between 0.80 and 0.81 as the 50-Day MA flattens right in the middle, acting as a consolidation magnet.
Also, the 2025 downwards trendline should be acting as immediate resistance but it seems that the mix between current zig-zags in the US Dollars supplemented by a dovish SNB don't help to gain direction.
This is why the current Pivot limits should serve as good technical breakout points:
Either a break above or below, followed by a consolidation or a retest of the higher/lower bound should see continuation.
If buyers and sellers fail to step in, the price action promises to be rangebound even further.
Let's try to look closer to see if there's any element in shorter timeframes allowing to tilt the scales.
USDCHF 4H Chart
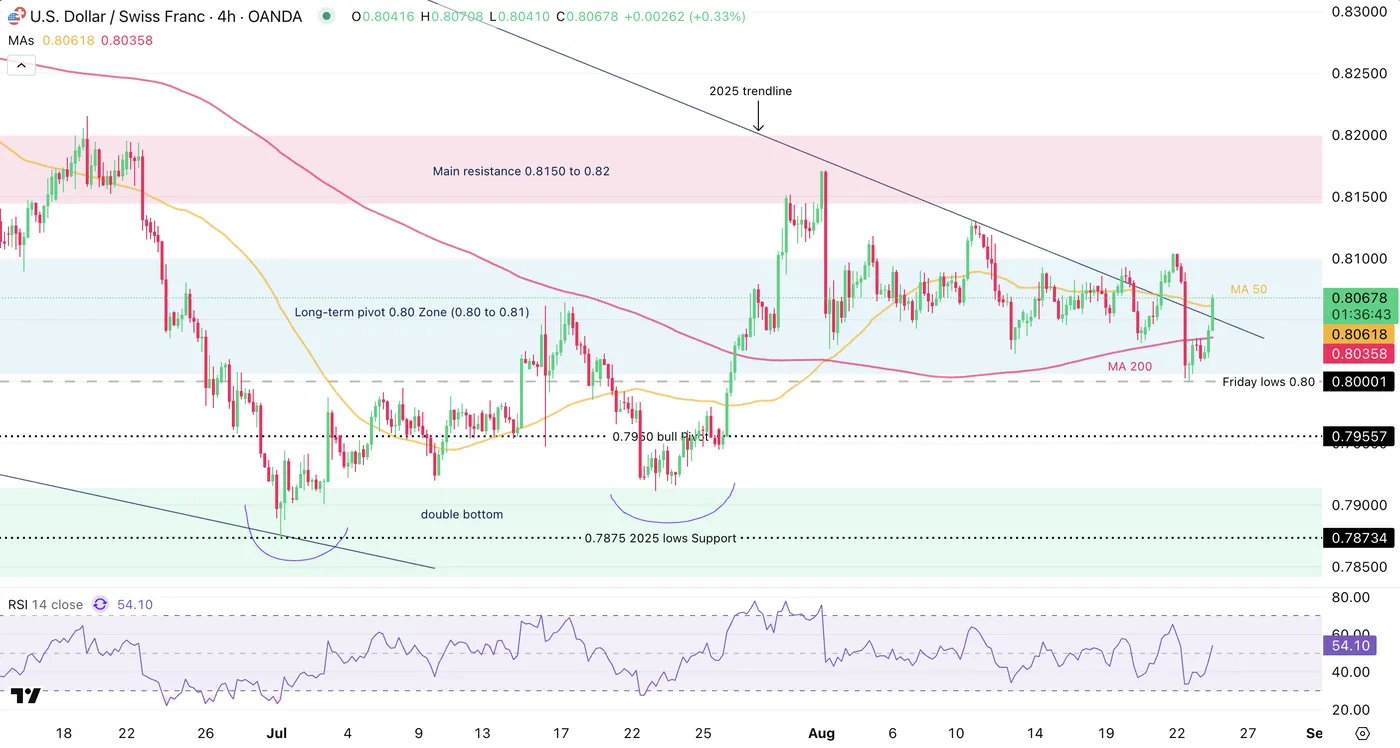
USDCHF 4H Chart, August 25, 2025 – Source: TradingView
The action from today's session may give the intermediate hand to the Bulls as bears have failed to push the action below the 0.80 psychological handle despite a strong selloff in the US Dollar amid a dovish interpretation of Powell's speech (you can access it right here).
However, bulls will have to break both the current 0.8070 highs as intermediate resistance (getting tested as we speak) and closing strongly above 0.81 if they want to regain early 2025 levels.
Levels of interest for USDCHF trading:
Support Levels:
- 0.80 Immediate Pivot
- 0.7950 bull Pivot
- 0.7875 to 0.79 Main Support
Resistance Levels:
- 0.8070 high volume zone within Pivot (getting tested)
- 0.81 Pivot highs
- Main resistance 0.8150 to 0.82 (0.8170 July 31st Highs)
USDCHF 1H Chart
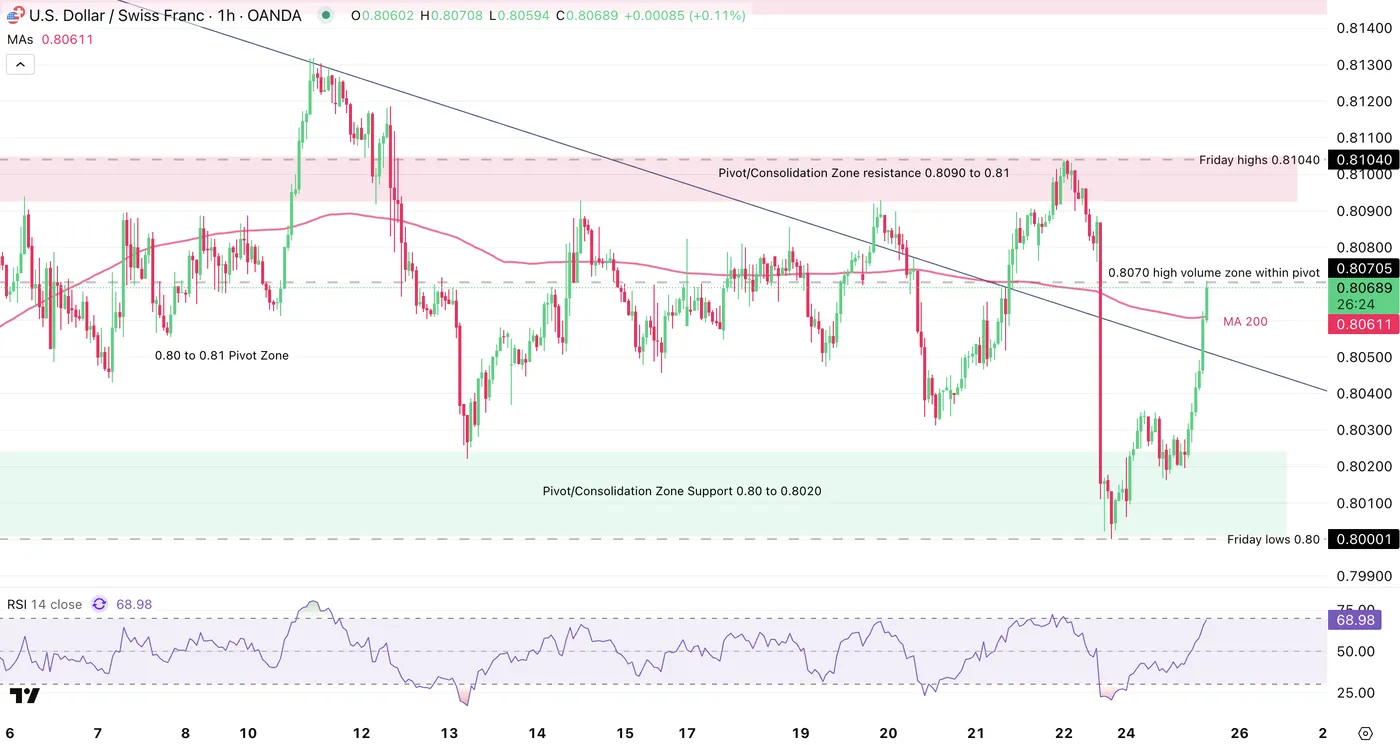
USDCHF 1H Chart, August 25, 2025 – Source: TradingView
Looking at the 1H timeframe allows us to spot further details within the ongoing consolidation pivot.
The lows of the consolidation pivot that preceded today's rebound are located between 0.80 to 0.8020 and the highs are between 0.8090 to 0.81.
Buyers have the immediate advantage but will have to face current short-timeframe overbought conditions within a range, tough times amid unchanging fundamentals.
Track any breakout to support analysis for upcoming trading. Failure to break concisely above or below the boundaries of the Pivot would reinforce the current range.
Safe Trades!
EURNZD Wave Analysis
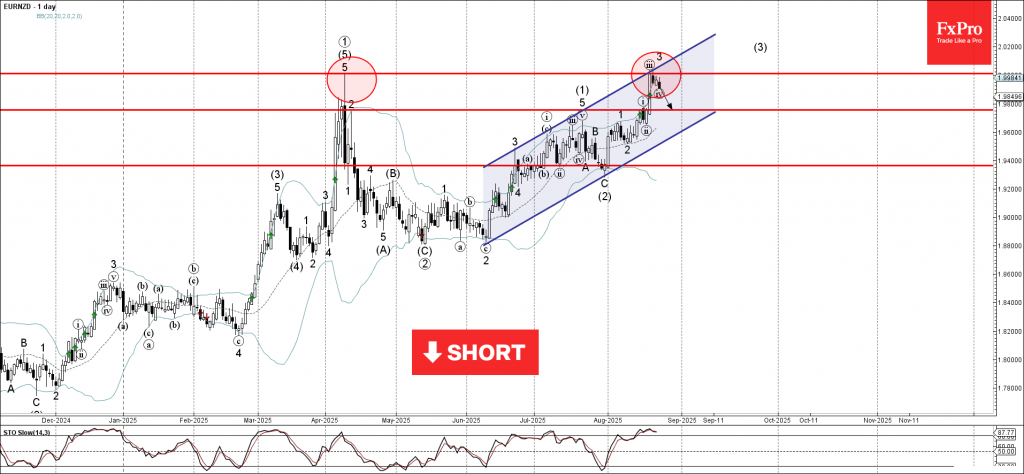
EURNZD: ⬇️ Sell
- EURNZD reversed from the round resistance level 2.0000
- Likely to fall to support level 1.9800
EURNZD currency pair recently reversed from the resistance area between the round resistance level 2.0000 (former multi-month high from April) and the upper daily Bollinger Band.
This resistance area was further strengthened by the upper resistance trendline of the daily up channel from the start of June.
Given the strength of the resistance level 2.0000 and the overbought daily Stochastic, EURNZD currency pair can be expected to fall to the next support level 1.9800.
BTCUSD: Bears Regain Full Control But Continue to Face Headwinds at Key Support Zone
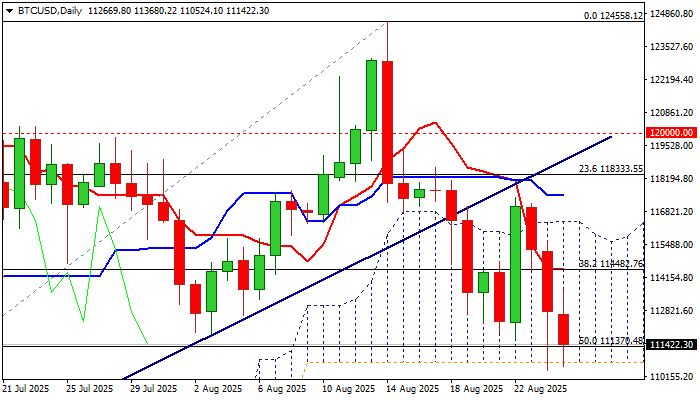
BTCUSD remains in red for the third straight day and pressures again key supports at 111370 (100DMA / 50% retracement of 98182/124558) and 110722 (daily Ichimoku cloud base) after fully retracing Friday’s post-Powell rally and dipping to the lowest since July 9.
Bitcoin rallied over 4% on Friday, inflated by unexpected Powell’s dovish shift (the biggest daily gain since Mar 2) but gains proved to be short-lived and mainly providing better selling levels (rally was capped by falling daily Tenkan-sen and just under broken bull trendline, reverted to resistance).
Huge sell-off over the weekend deflated bitcoin and generated initial signal of bearish continuation of pullback from new record high.
Daily studies are bearish (daily Tenkan/Kijun-sen are diverging after formation of bear-cross / negative momentum is strengthening) that opens prospects for further losses.
Firm break of 11370/110722 is needed to confirm bearish signal, with violation of nearby psychological 110K support, to add to bearish stance and expose next targets at 108258 (Fibo 61.8%) and early July higher base at 105K zone.
However, strong headwinds at key support zone (long tail of Sunday’s daily candle) warn that bears may lose traction here.
Consolidation above these support could be one of scenarios, with upticks to be capped under 114500 (daily Tenkan-sen) to keep near term bias with bears.
Res: 111870; 113680; 114500; 115620
Sup: 110722; 110388; 110000; 108258
Ethereum and Cryptocurrency Markets Send Worrying Signs Despite Last Friday’s Spike
Cryptos have all shined on Friday after Powell's speech that largely got interpreted as dovish – One of my thesis was that these moves may have been slightly over-extended compared to what was actually said.
Markets tend to act erratically with algorithmic movements and stops triggering leading to extreme moves that tend to be corrected after some proof-reading by some of the largest participants.
The US Equities market is still around its Friday highs with the Dow Jones futures above their previous highs (down small on the pre-open session) indicating no strong correction from the recent upside.
On the other hand, cryptos are looking a bit more skeptical – Ethereum broke a new record on Saturday ($4,956) before retracting lower, currently down 4% on the session.
Bitcoin also retested $117,000 and quickly reversed back to around the $111,000 handle, retesting its support zone that will have to hold to avoid a more bearish short-term outlook.
A look at the Cryptocurrency market cap
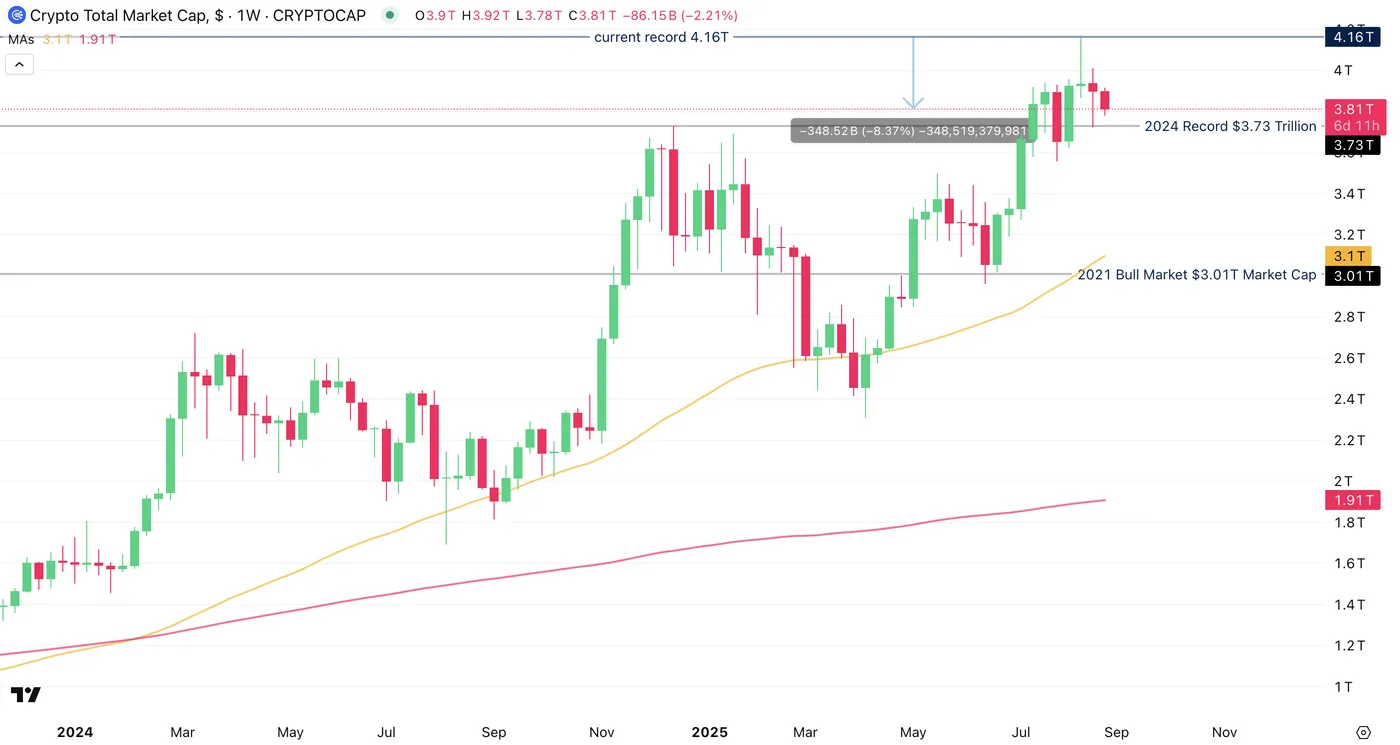
Crypto Market Cap, August 25, 2025 – TradingView
Despite the new record in ETH, the rest of the market hasn't followed through with the Market cap correcting around 8% since.
The chart is still far from bearish but this will have to be monitored to check if the bullish momentum inverts further.
Crypto Market reversed from Friday gains
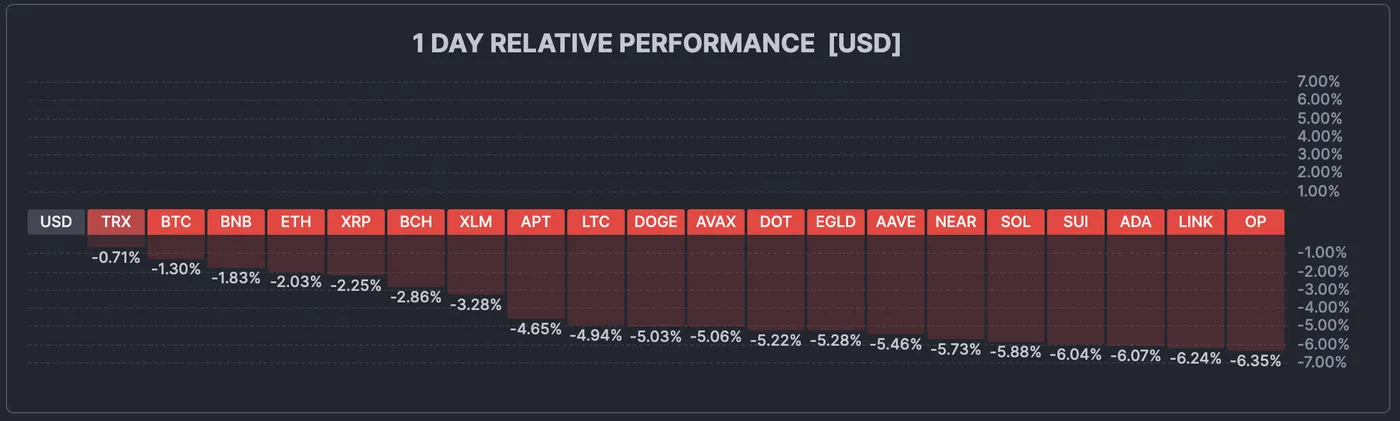
Crypto Market overview, August 25, 2025 – Source: Finviz
The picture is red, but most cryptos are still fairly close to their highs, I would suggest to look at risk-on/risk-off assets demand to assess if the mood gets better from here or not.
Ethereum Daily and intraday charts
Ethereum Daily Chart
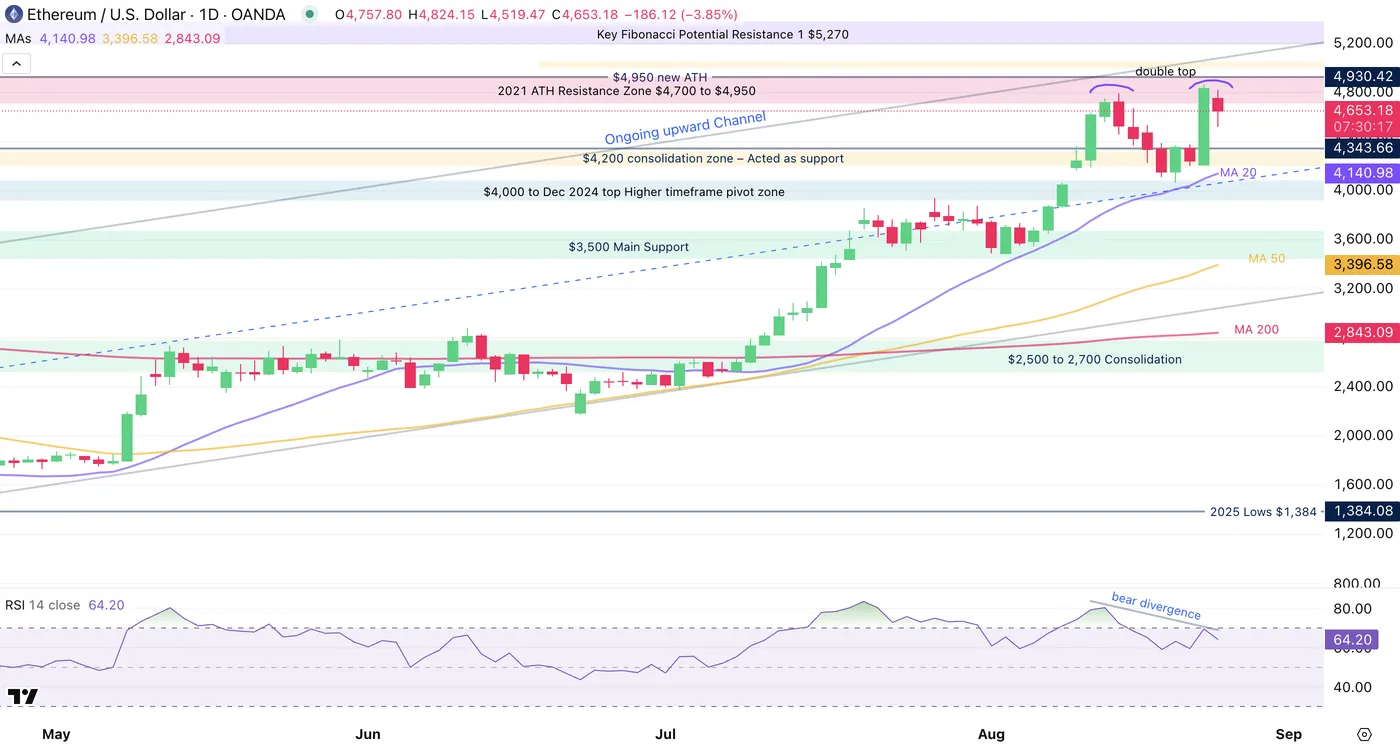
Ethereum Daily Chart, August 25, 2025 – Source: TradingView
If the current picture stays like this, a double top combined with a bearish divergence (new highs in price ≠ new highs in RSI) could bring some decent reasons for Participants to take profit around here.
Nonetheless, as always in Financial markets, if the price action was that bearish, prices would be much lower already.
But these signs are not to be taken lightly and have to be monitored closely for upcoming trading.
Ethereum 4H Chart
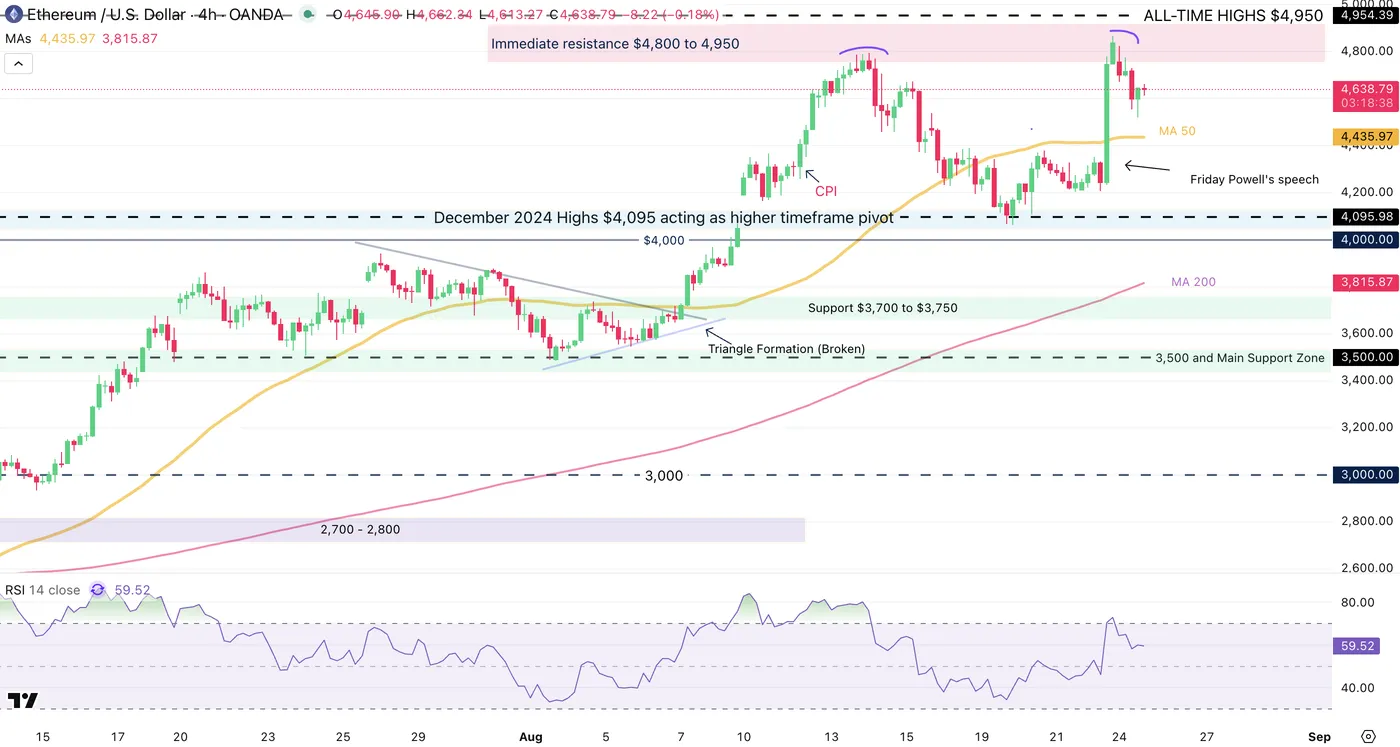
Ethereum 4H Chart, August 25, 2025 – Source: TradingView
Ethereum has retracted from its recent highs (ETH CFD not showing but actual coin traded to $4,956 highs, currently around $4,640) which allowed overbought momentum to cool down on shorter timeframes.
As long as prices hold above the $4,000 to $4,095 (Dec 2024) pivot zone, the price action remains more bullish than bearish – but do keep an eye on the potential double top mentioned on the daily timeframe.
Levels of interest for ETH trading:
Support Levels:
- $4,200 consolidation Zone (minor support)
- $4,000 to $4,095 Main Pivot
- $3,500 Main Support Zone
Resistance Levels:
- $4,950 Current new All-time highs
- $4,700 to $4,950 All-time high resistance zone
- Potential main resistance $5,230 Fibonacci extension.
Safe Trades!
Sunset Market Commentary
Markets
Core bond yields recovered several basis points from Fed chair Powell’s drop shot in his Jackson Hole appearance last Friday. The Fed’s ready to pivot back into rate cuts starting from September and that caused some bull steepening of the curve. US rates today found some support, adding around a little less than 3 bps across the curve. It’s interesting to see the front end (eg. the 2-year tenor) still trading higher than the post-payrolls trough despite Powell’s strongest hint at rate cuts this year so far. It shows that not everyone is convinced the US economy and labour market is in a state that requires near-term monetary support. Money markets price an 80%+ chance for a resumption of the easing cycle at the September 17 meeting. This week’s PCE deflators and next week’s ISMs and labour market report are among the final data points that’ll tip the scales. European/German bonds already underperformed Treasuries end last week and continue to do so at the start of the new one. German rates rise up to 5 bps with the belly of the curve underperforming the wings. The 2-yr yield is nearing the summer highs close to 2% along with money markets further pricing out an additional ECB rate cut. The market implied probability for an end-of-year finetuning move dropped to less than 25%. ECB president Lagarde in a Fox interview struck a relatively upbeat tone, saying the economy isn’t exactly thriving but it’s “increasingly back to potential”. Growth is on the way up, she said, with the fundamentals such as consumption and investment looking good at the moment. Her comments chime with last week’s message from the August PMIs. Lagarde also believes that enterprises are going to deal with the 10% tariff levy the US and EU agreed to a couple of weeks ago, provided the trade deal isn’t going to be challenged and renegotiated “a hundred times”.
Currency markets trade stoic and without a clear direction. The dollar’s attempt to claw back is a meagre one, at best. The trade-weighted index tested the 98 level, compared to Friday’s close of 97.71. EUR/USD inches lower in choppy trading. The pair is currently hovering near the 1.17 big figure. JPY is the laggard today, letting USD/JPY move higher towards 147.5 and EUR/JPY to 175.5. Sterling is going nowhere around the EUR/GBP 0.866 level. Liquidity is markedly lower with UK markets closed for the Summer Bank Holiday. Hungary’s forint is trailing Central European peers these last couple of days. HUF benefited more than the likes of CZK and PLN from rising hopes on progress in the conflict in Ukraine but faced a backlash in recent days. EUR/HUF rebounded from an 11-month low below 394 mid-August to 397.7 now.
News & Views
Czech economic sentiment measured in the monthly business cycle survey, rose from 99.7 to 101.1 in August, the highest level since May 2022. Details showed a divergence between deteriorating consumer confidence (104.1 to 99; lowest since April) and improving business confidence (98.8 to 101.5; best since June 2022). Compared to July, the share of consumers expecting a deterioration in the overall economic situation in the Czech Republic and in their financial situation over the next twelve months increased. In addition, the number of households that assess their current financial situation as worse than in the previous twelve months increased. The number of respondents who do not plan to make large purchases in the next twelve months remained almost unchanged. In the business confidence survey, only industry sentiment was status quo with selected service sectors, construction and trade all showing monthly gains.
The Belgian debt agency auctioned three OLO lines (€1.02bn OLO 97 3% Jun2033, €0.93bn €0.77bn OLO 100 2.85% Oct2034 and OLO 101 3.5% Jun2055). The combined amount sold was slightly above the maximum of the targeted €2.3-2.7bn range. The Belgian debt agency is well in time with this year’s funding plans. They’ve now secured €37.17bn in OLO funding compared with a €47bn OLO funding need. By sticking with benchmark sizes at the three remaining monthly auctions, they can have the job done by November.
EUR/USD Mid-Day Outlook
Daily Pivots: (S1) 1.1622; (P) 1.1683; (R1) 1.1782; More...
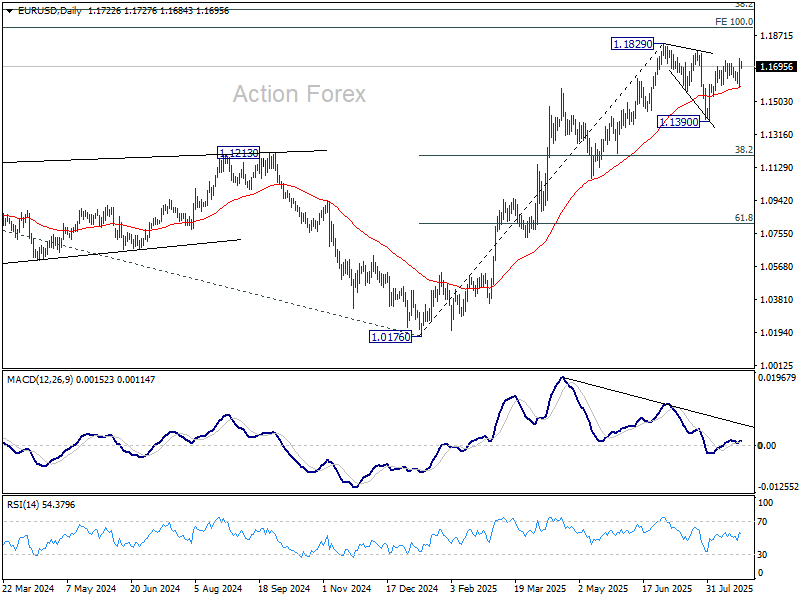
Outlook in EUR/USD is unchanged and intraday bias stays mildly on the upside. The corrective pattern from 1.1829 should have completed with three waves down to 1.1390. Further rally should be seen to retest 1.1829 high first. Firm break there will resume larger up trend. For now, risk will stay on the upside as long as 1.1582 support holds, in case of retreat.
In the bigger picture, rise from 0.9534 long term bottom could be correcting the multi-decade downtrend or the start of a long term up trend. In either case, further rise should be seen to 100% projection of 0.9534 to 1.1274 from 1.0176 at 1.1916. This will remain the favored case as long as 1.1604 support holds.
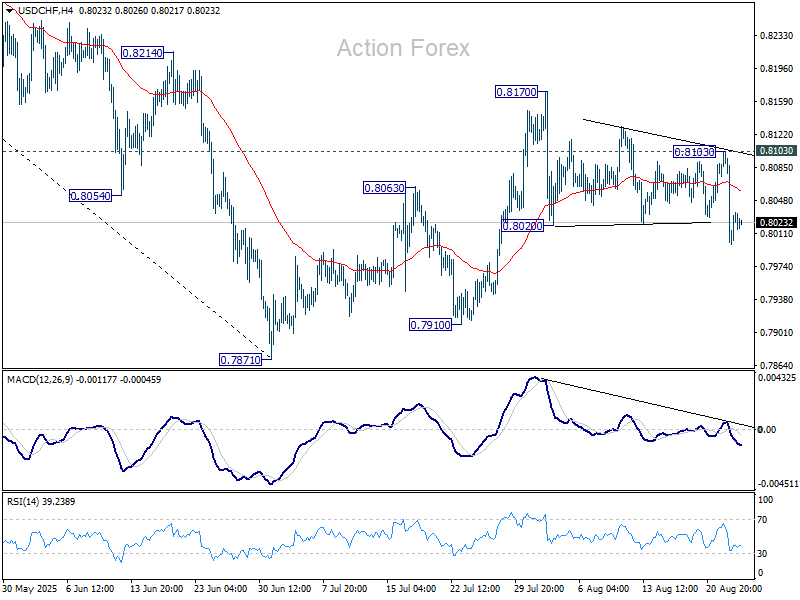
USD/CHF Mid-Day Outlook
Daily Pivots: (S1) 0.7976; (P) 0.8040; (R1) 0.8080; More….
No change in USD/CHF's outlook and intraday bias stays mildly on the downside. Corrective rebound from 0.7871 might have completed with three waves up to 0.8170 already. Deeper fall should be seen back to retest 0.7871 low. Meanwhile, risk will stay on the downside as long as 0.8103 resistance holds, in case of recovery.
In the bigger picture, long term down trend from 1.0342 (2017 high) is still in progress. Next target is 100% projection of 1.0146 (2022 high) to 0.8332 from 0.9200 at 0.7382. In any case, outlook will stay bearish as long as 0.8475 resistance holds.