Sample Category Title
AUD/NZD rally intact, busy week with RBA minutes, Aussie CPI and NZ confidence
AUD/NZD could see sharp moves this week as markets digest a run of significant releases from both economies. RBA minutes on Tuesday, Australia’s monthly July CPI on Wednesday, and New Zealand’s ANZ business confidence survey on Thursday are possible movers.
In New Zealand, Q2 retail sales offered an upside surprise today. Headline volumes rose 0.5% qoq, beating expectations of 0.2%, while ex-auto sales jumped 0.7% qoq, defying forecasts of contraction. However, the Kiwi failed to capitalize, remaining pressured after last week’s dovish RBNZ decision. Markets have since shifted toward expecting two more rate cuts before the easing cycle ends.
RBNZ Governor Christian Hawkesby reinforced that view by stressing that both remaining policy meetings this year are “live.” This leaves scope for either two consecutive cuts in 2025, or one this year and one early next year, depending on how upcoming economic data evolves.
Meanwhile, the RBA appears more deliberate. After cutting 25bps earlier this month, the new projections signaled that one additional cut this year and two in 2026 remain the likely path under current assumptions. November is seen as the more appropriate window for action, allowing time to absorb Q3 CPI data. This week’s minutes and July’s monthly CPI release will be important checks on whether that outlook holds.
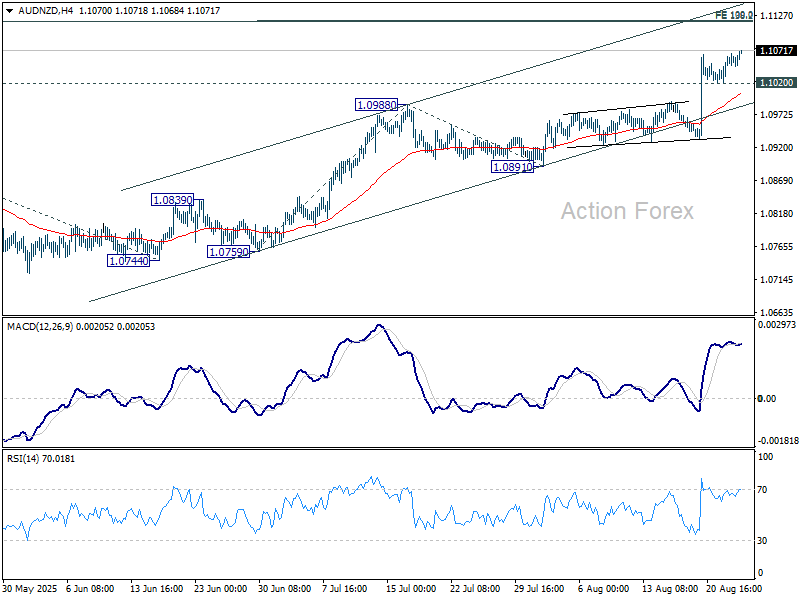
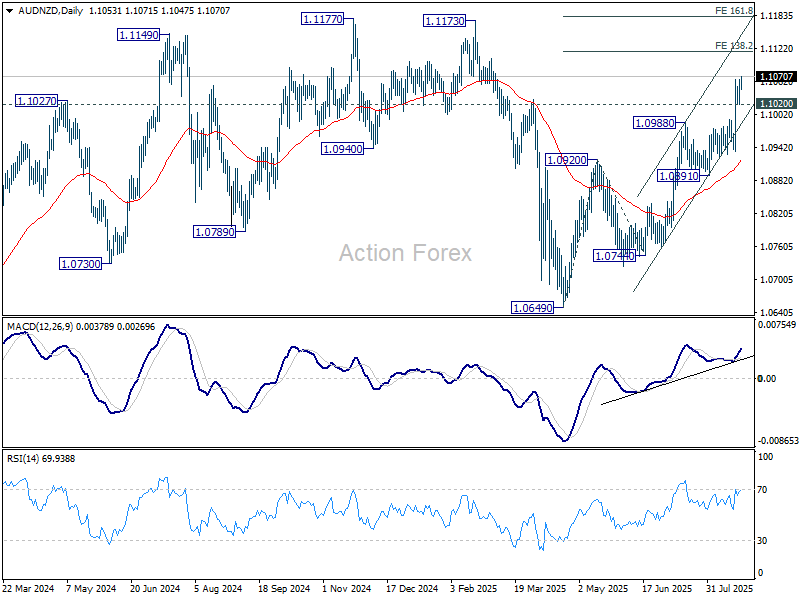
Technically, AUD/NZD’s near-term rally remains intact, supported by firm momentum on D MACD. As long as 1.1020 holds, further gains are likely, with scope toward the 138.2% projection of 1.0649 to 1.0920 from 1.0744 at 1.1119.
However, there is no clear sign of medium term range breakout yet. Hence, AUD/NZD would likely lose momentum above 1.119. Upside should be capped by 161.8% projection at 1.1182, which is slightly above key resistance of 1.1177 (2024 high).
Euro Rallies Against Dollar After Powell’s Cautious Jackson Hole Speech
The euro strengthened against the US dollar on Friday following a speech by Federal Reserve Chair Jerome Powell at the Jackson Hole Economic Symposium, closing the week on a positive note. While Powell acknowledged the potential for an interest rate cut as soon as September, he refrained from making any explicit commitments.
The EUR/USD pair rose to 1.1728, reaching its highest level since 28 July.
Market expectations for a rate cut at the Fed's September meeting (16–17) now stand at 85%. For the remainder of the year, market pricing points to a more dovish outlook, with an average of 54 basis points of easing anticipated, up from 48 basis points previously.
Investor attention is now shifting to labour market data. Powell noted that the market is in an unusual balance, with both demand for and supply of workers slowing. The trajectory of employment will be a key determinant for the Fed's future policy decisions.
An additional factor weighing on the dollar is the growing scrutiny surrounding the Fed's independence. Last week, US President Donald Trump called for the resignation of Federal Reserve Governor Lisa Cook and suggested she could be dismissed. This has further fuelled concerns about political pressure being exerted on the central bank.
Technical Analysis: EUR/USD
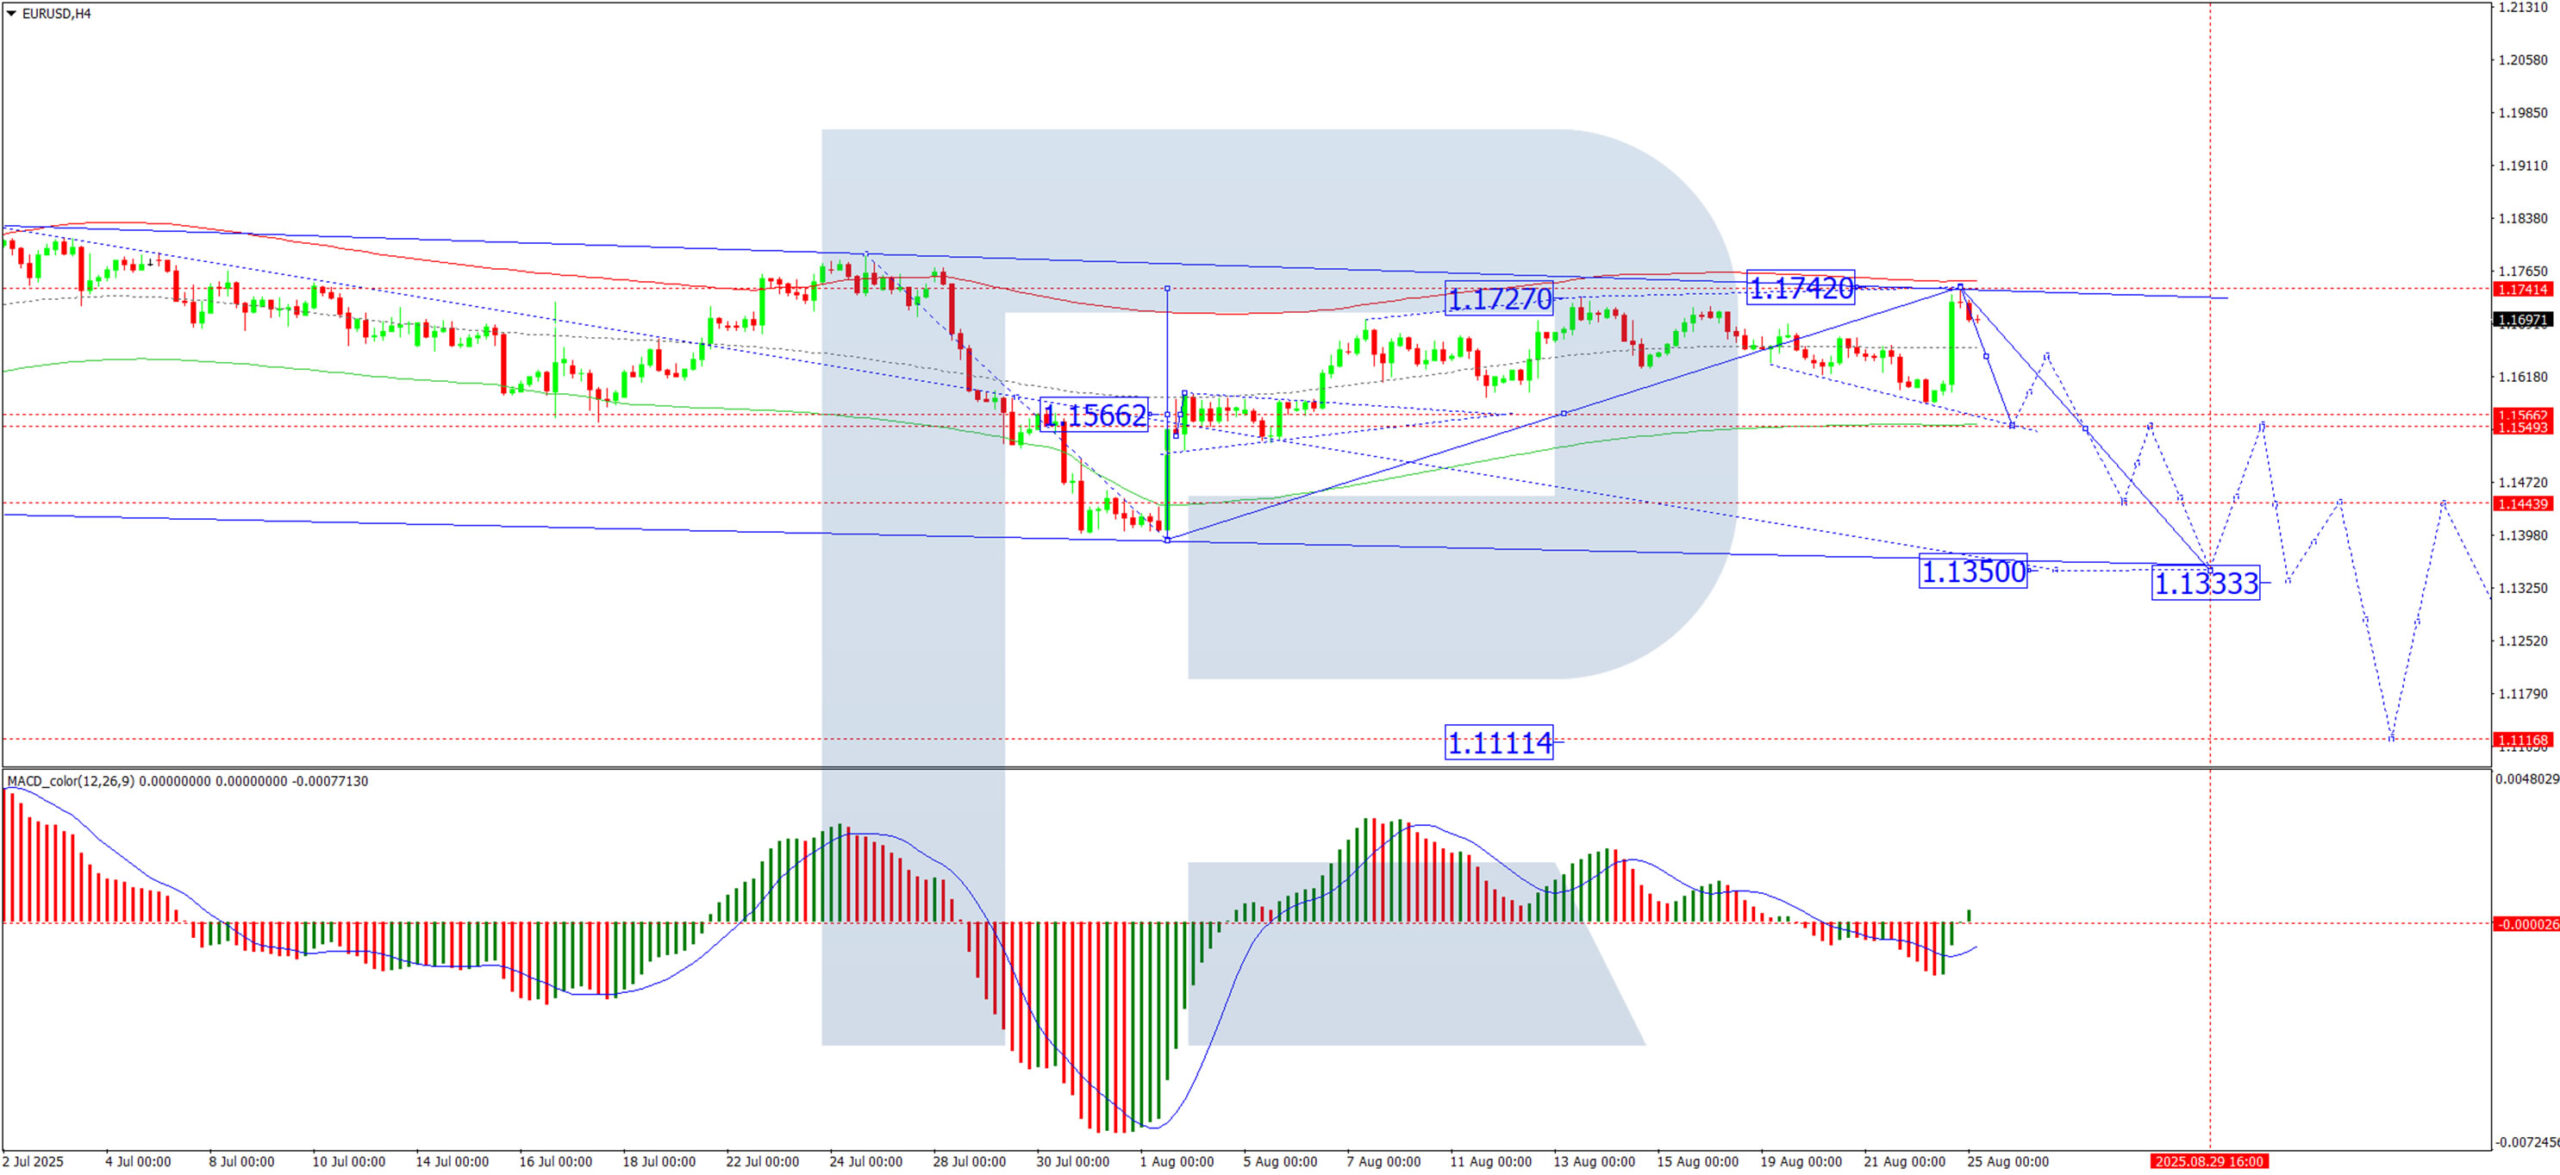
H4 Chart:
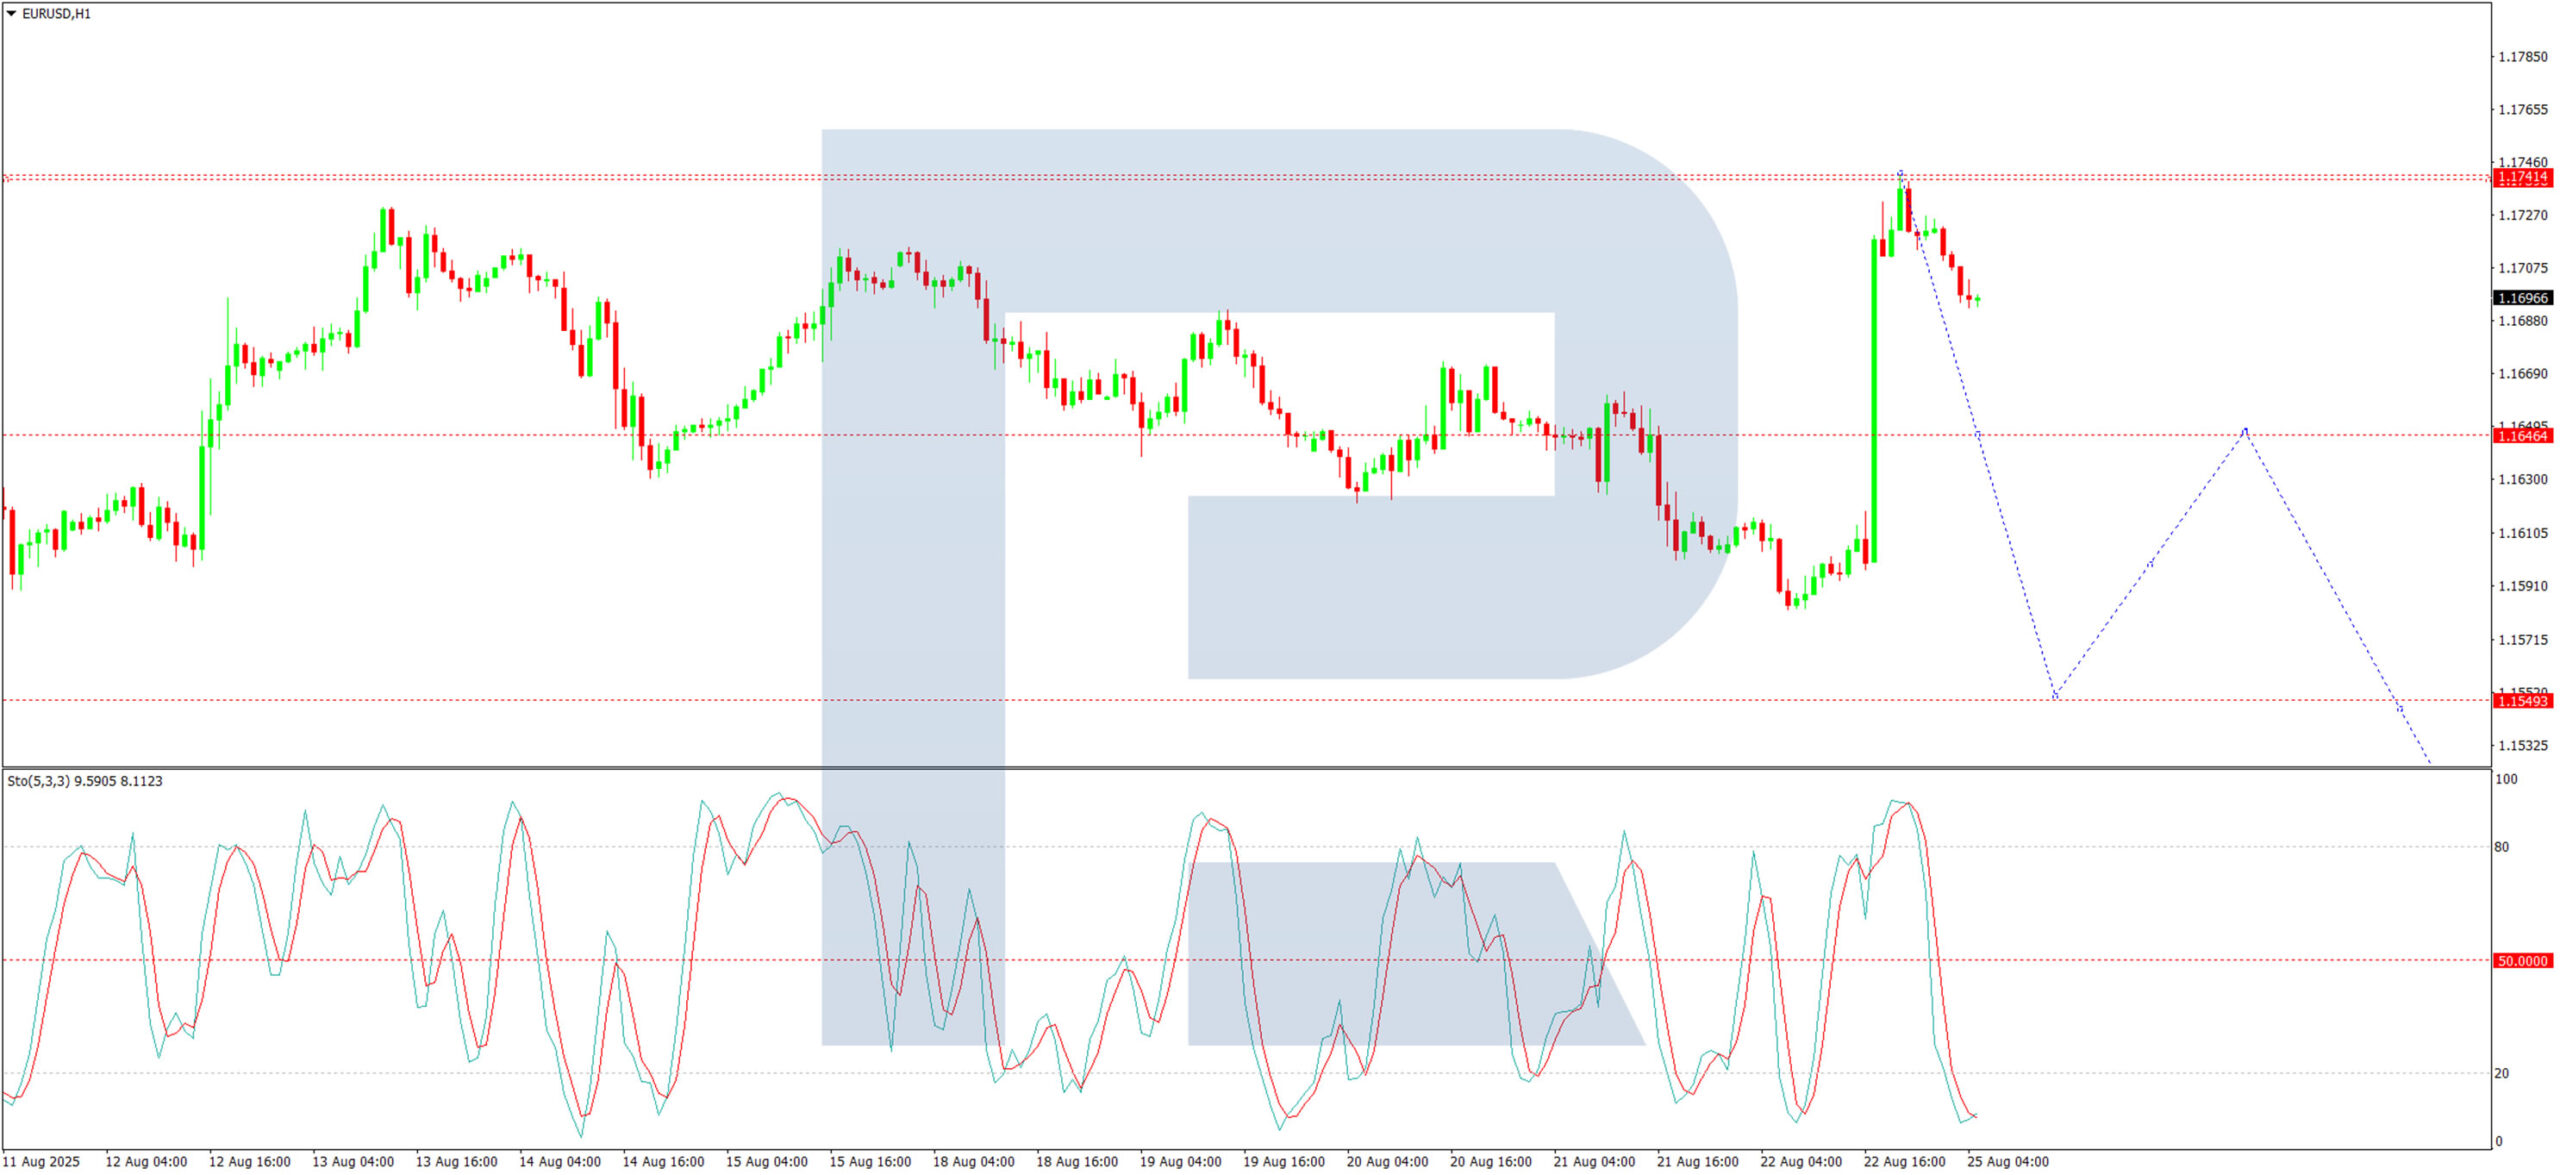
On the H4 chart, the market has formed a consolidation range around the 1.1566 level. Following an upward breakout, the corrective wave appears to have completed at the 1.1742 high. The primary focus is now on the potential initiation of a new bearish wave targeting the 1.1550 level. This scenario is technically supported by the MACD indicator, whose signal line remains below zero and is pointing decisively lower.
H1 Chart:
On the H1 chart, the market completed an ascending wave to the 1.1742 level and subsequently formed a consolidation range below it. The price has now broken downwards out of this range. The immediate outlook suggests a high probability of a further decline towards the 1.1664 support level. Following this, a corrective bounce towards 1.1694 is possible. The broader structure is then expected to resume its downward trajectory, targeting 1.1590, with the ultimate bearish objective for the wave structure seen at 1.1550. This view is corroborated by the Stochastic oscillator, whose signal line is currently below the 50 midline and is trending sharply lower towards the 20 level.
Conclusion
While fundamental drivers from the Fed provided a lift, the technical picture suggests the euro's rally may be limited in the near term.
German Ifo business climate edges higher to 89.0, recovery still weak
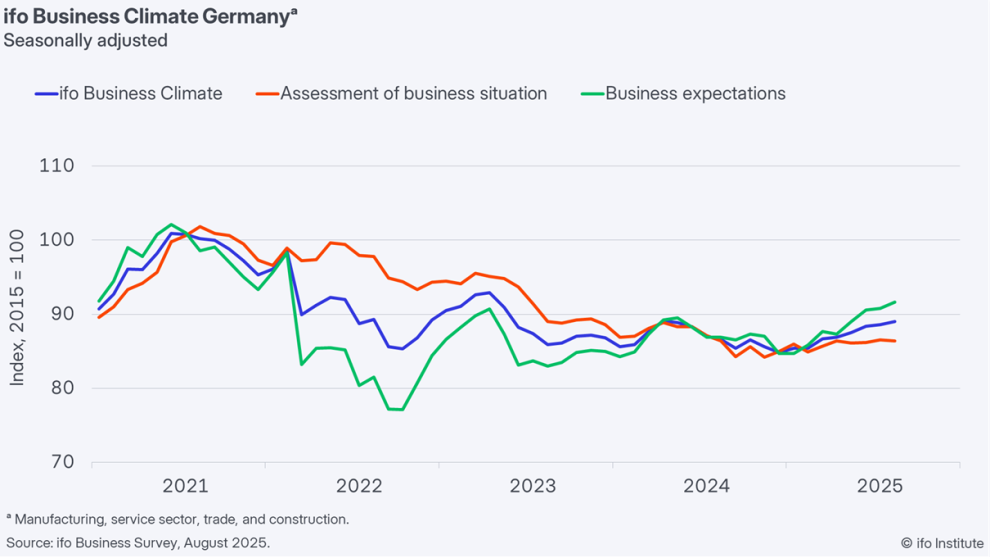
Germany’s Ifo business climate index rose modestly in August, climbing to 89.0 from 88.6 and beating expectations of 88.3. The improvement was driven by stronger expectations, with the sub-index rising to 91.6 from 90.7. Current assessment slipped from 86.5 to 86.4. Ifo said sentiment among companies has “brightened slightly,” but warned that the recovery “remains weak.”
Sector details painted a mixed picture. Manufacturing sentiment deteriorated further from -11.9 to -12.2, with firms less satisfied about current conditions and order intake still showing no signs of growth, though capital goods makers saw noticeable improvement.
Services dipped from 2.8 to 2.6 as expectations turned cautious despite a stronger current situation. Trade slumped from -20.3 to -21.4 on weaker performance. Construction slipped from -14.3 to -15.3, as firms were less satisfied with current conditions even as their outlook improved.
Ethereum Price Approaches $5,000
Ethereum’s price fluctuations are showing strong bullish momentum, approaching the psychological threshold of $5,000:
→ since the beginning of August, ETH/USD has risen by approximately 25%;
→ since the start of summer – by more than 80%.
Bullish Drivers in 2025
This year, market optimism is being shaped by:
→ the large-scale upgrade known as Pectra;
→ improvements in the US regulatory environment (such as the approval of a stablecoin bill and permission for pension funds to invest in cryptocurrencies);
→ weakening of the US dollar (Fed Chair Powell’s Friday speech triggered a fresh bearish impulse for the DXY dollar index).
Technical Analysis of ETH/USD
Last month, we noted that:
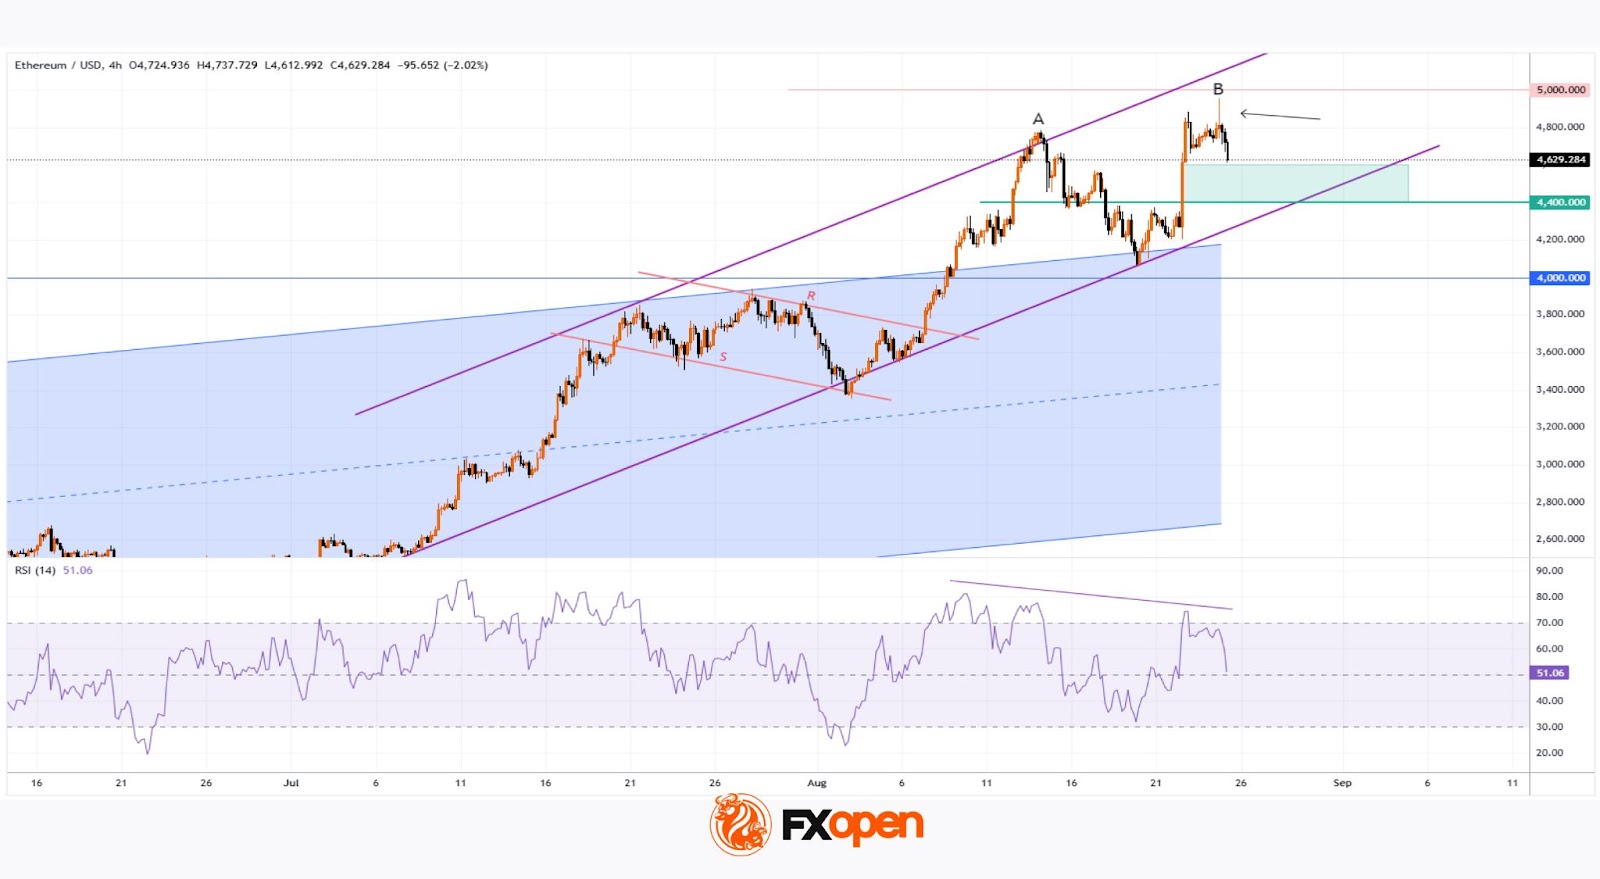
→ ETH/USD price movements had formed an ascending channel (highlighted in blue);
→ we suggested that Ethereum’s steep price rally might slow down as the price approached the channel’s upper boundary (which acted as resistance).
Indeed, since then, the price developed a bullish flag pattern (marked R-S). However, the uptrend soon resumed with renewed strength, with:
→ a steeper upward trajectory emerging (shown with purple lines);
→ the upper boundary of the blue channel switching roles to act as support.
Can ETH/USD Break Through the 5000 Level?
Given the inertia typical of financial market trends, it is difficult to imagine the current strong bullish momentum reversing into bearish action in the near term. The price continues to follow a steeper upward trajectory, while the $4,400–$4,600 zone (highlighted in green) may act as support, as the market advanced through this level with relative ease – a sign of imbalance in favour of buyers.
However, the ETH/USD chart is showing signs of growing bearish pressure:
→ a cascade of divergences on the RSI indicator;
→ long upper wicks (indicated by an arrow) on recent candlesticks;
→ a potential bearish double top formation (A-B).
It appears that the $5,000 mark is acting as psychological resistance, preventing the price from reaching the upper boundary of the purple channel. Therefore, even if an attempt to break above $5k occurs, it could trigger stronger selling pressure.
FXOpen offers the world's most popular cryptocurrency CFDs*, including Bitcoin and Ethereum. Floating spreads, 1:2 leverage — at your service. Open your trading account now or learn more about crypto CFD trading with FXOpen.
*Important: At FXOpen UK, Cryptocurrency trading via CFDs is only available to our Professional clients. They are not available for trading by Retail clients. To find out more information about how this may affect you, please get in touch with our team.
This article represents the opinion of the Companies operating under the FXOpen brand only. It is not to be construed as an offer, solicitation, or recommendation with respect to products and services provided by the Companies operating under the FXOpen brand, nor is it to be considered financial advice.
AUD/USD and NZD/USD Start Recovery, Key Hurdles Ahead
AUD/USD is attempting a fresh increase from 0.6415. NZD/USD is also rising and could aim for a move above 0.5900 in the short term.
Important Takeaways for AUD/USD and NZD/USD Analysis Today
- The Aussie Dollar found support at 0.6415 and moved higher against the US Dollar.
- There was a break above a key bearish trend line with resistance at 0.6440 on the hourly chart of AUD/USD at FXOpen.
- NZD/USD is slowly moving higher above 0.5830.
- There is a major bearish trend line forming with resistance at 0.5870 on the hourly chart of NZD/USD at FXOpen.
AUD/USD Technical Analysis
On the hourly chart of AUD/USD at FXOpen, the pair formed a base above 0.6415. The Aussie Dollar started a significant increase above 0.6425 against the US Dollar to enter a short-term positive zone.
There was a break above a key bearish trend line with resistance at 0.6440 and the 23.6% Fib retracement level of the downward move from the 0.6568 swing high to the 0.6415 low. The pair even surpassed 0.6470 and settled above the 50-hour simple moving average.
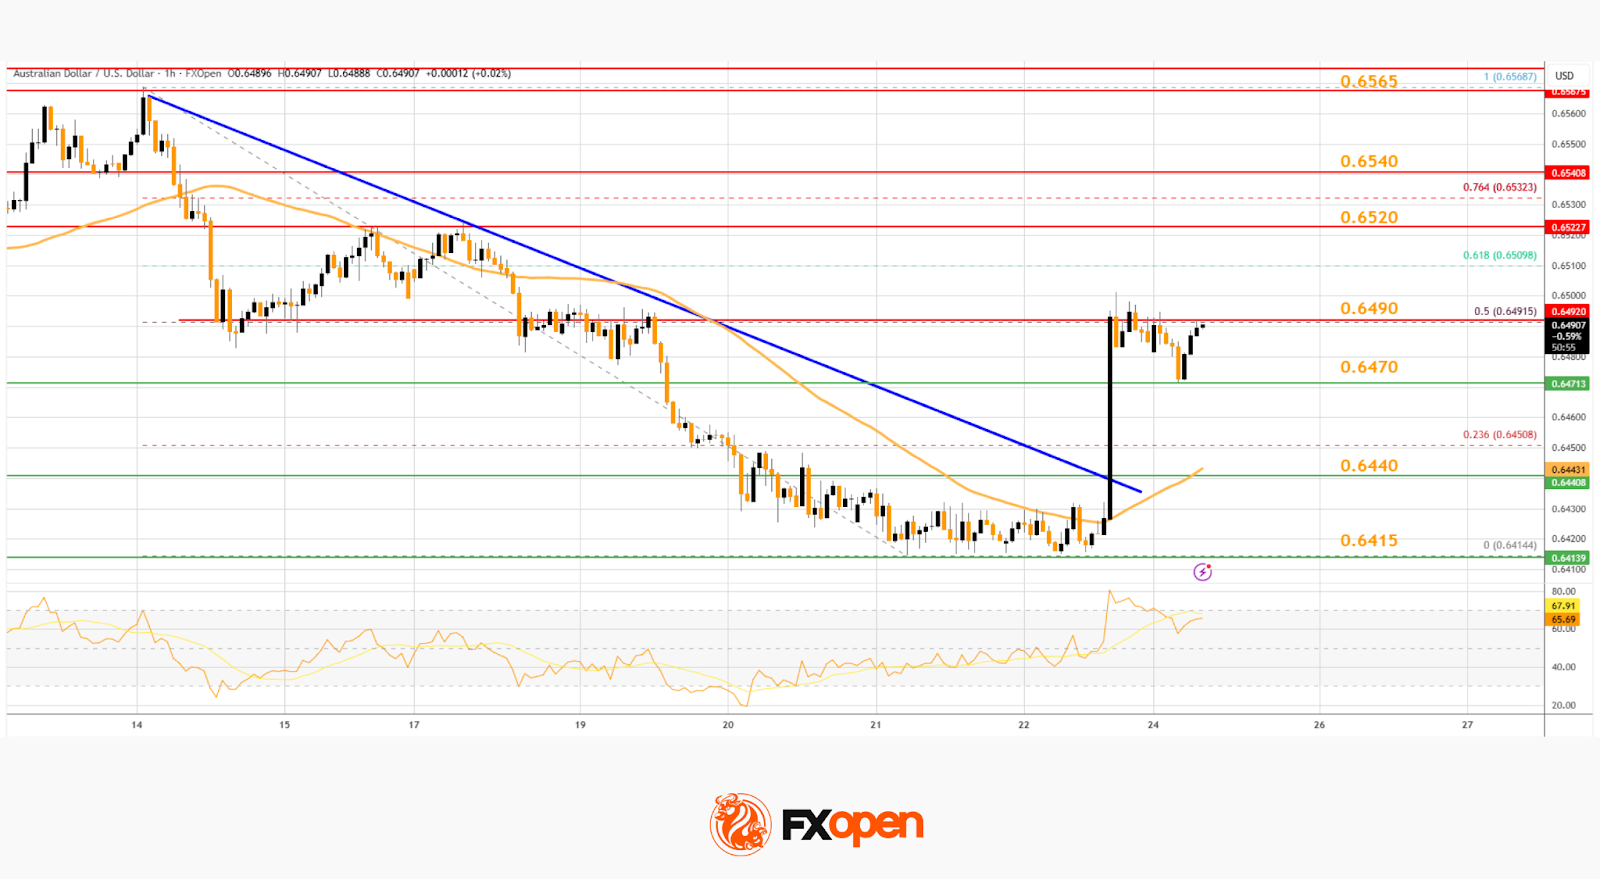
On the upside, the AUD/USD chart indicates that the pair is now facing resistance near the 50% Fib retracement level at 0.6490. The first major hurdle for the bulls could be 0.6520.
An upside break above 0.6520 resistance might send the pair further higher. The next major target is near the 0.6540 level. Any more gains could clear the path for a move toward 0.6565. If there is no close above 0.6490, the pair might start a fresh decline.
Immediate support sits near the 0.6470 level. The next area of interest could be 0.6440. If there is a downside break below 0.6440 support, the pair could extend its decline toward 0.6410. Any more losses might signal a move toward 0.6350.
NZD/USD Technical Analysis
On the hourly chart of NZD/USD at FXOpen, the pair followed AUD/USD. The New Zealand Dollar formed a base above the 0.5800 level and started a recovery wave against the US Dollar.
The pair climbed above the 50-hour simple moving average and 0.5830. There was a close above the 23.6% Fib retracement level of the downward move from the 0.5990 swing high to the 0.5830 low.
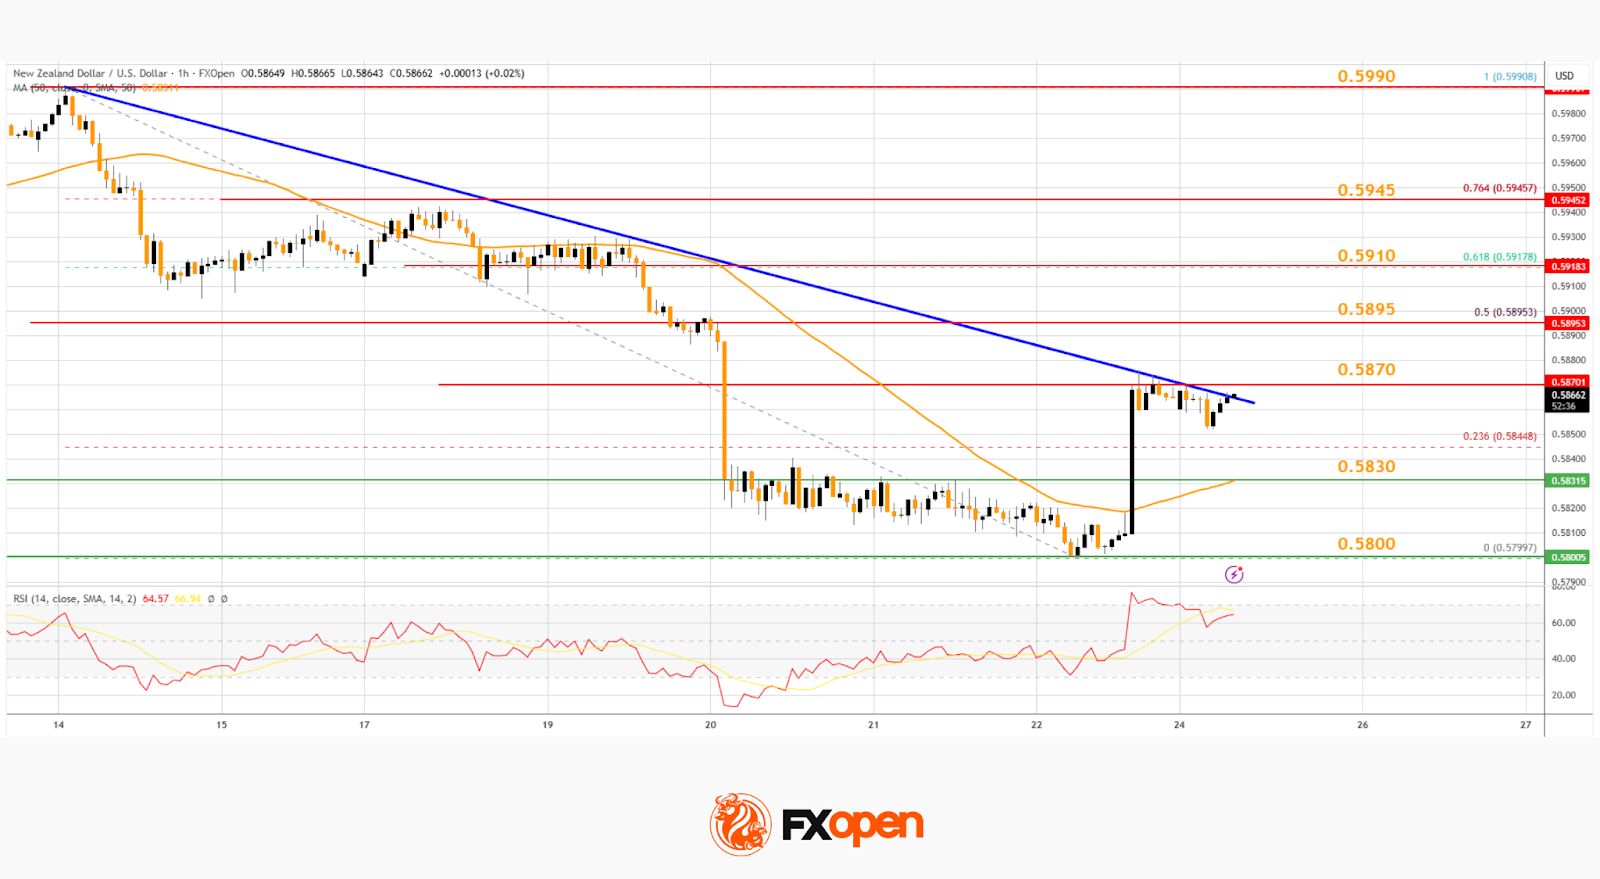
However, the bears are now active near the 0.5870 zone and a major bearish trend line. The NZD/USD chart suggests that the RSI is back above 60, signaling a positive bias. On the upside, the pair is facing resistance near 0.5870.
The next major hurdle for buyers could be near the 50% Fib retracement at 0.5895. A clear move above 0.5895 might even push the pair toward 0.5910. Any more gains might clear the path for a move toward the 0.5945 pivot zone in the coming sessions.
On the downside, there is support forming near the 0.5830 zone. If there is a downside break below 0.5830, the pair might slide toward 0.5800. Any more losses could lead NZD/USD into a bearish zone to 0.5740.
Trade over 50 forex markets 24 hours a day with FXOpen. Take advantage of low commissions, deep liquidity, and spreads from 0.0 pips. Open your FXOpen account now or learn more about trading forex with FXOpen.
This article represents the opinion of the Companies operating under the FXOpen brand only. It is not to be construed as an offer, solicitation, or recommendation with respect to products and services provided by the Companies operating under the FXOpen brand, nor is it to be considered financial advice.
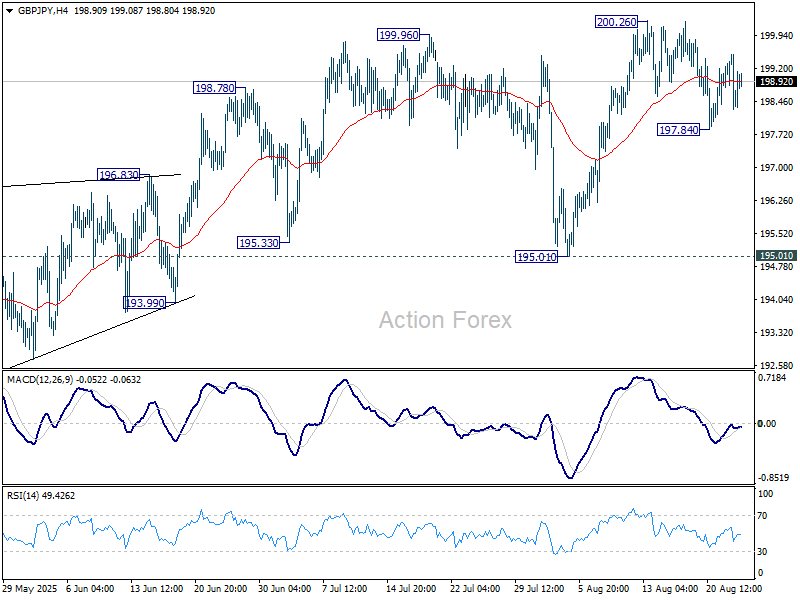
GBP/JPY Daily Outlook
Daily Pivots: (S1) 198.21; (P) 198.87; (R1) 199.41; More...
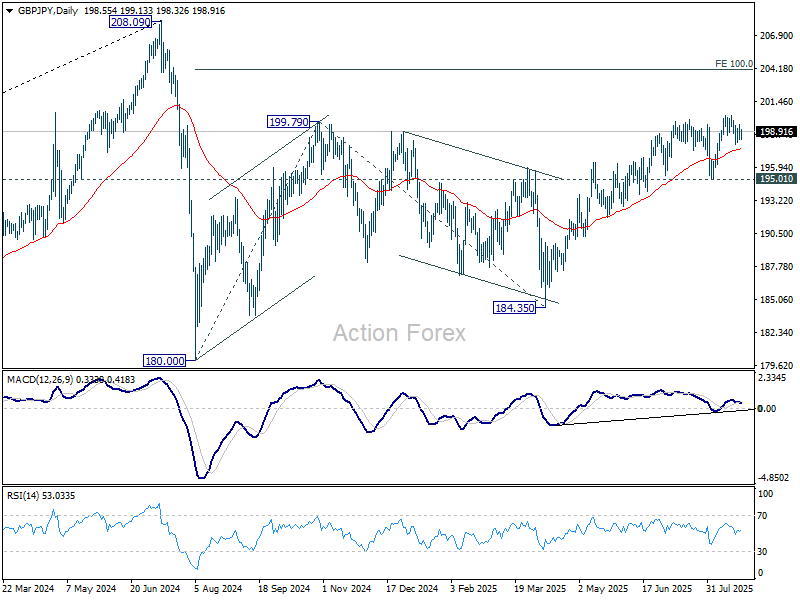
Intraday bias in GBP/JPY remains neutral for consolidations below 200.26. While another fall cannot be ruled out, near term outlook will stay bullish as long as 195.01 support holds. On the upside, firm break of 2002.6 will resume the whole rise from 184.35 to 100% projection of 180.00 to 199.79 from 184.35 at 204.14.
In the bigger picture, price actions from 208.09 (2024 high) are seen as a correction to rally from 123.94 (2020 low). The pattern might still extend with another falling leg. But in that case, strong support should be seen from 38.2% retracement of 123.94 to 208.09 at 175.94 to contain downside. Meanwhile, decisive break of 208.09 will confirm long term up trend resumption.
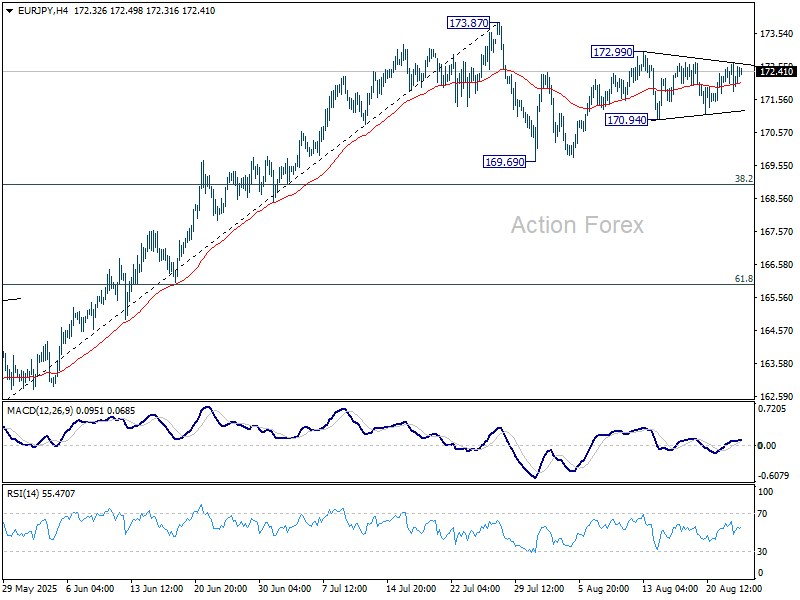
EUR/JPY Daily Outlook
Daily Pivots: (S1) 171.82; (P) 172.25; (R1) 172.67; More...
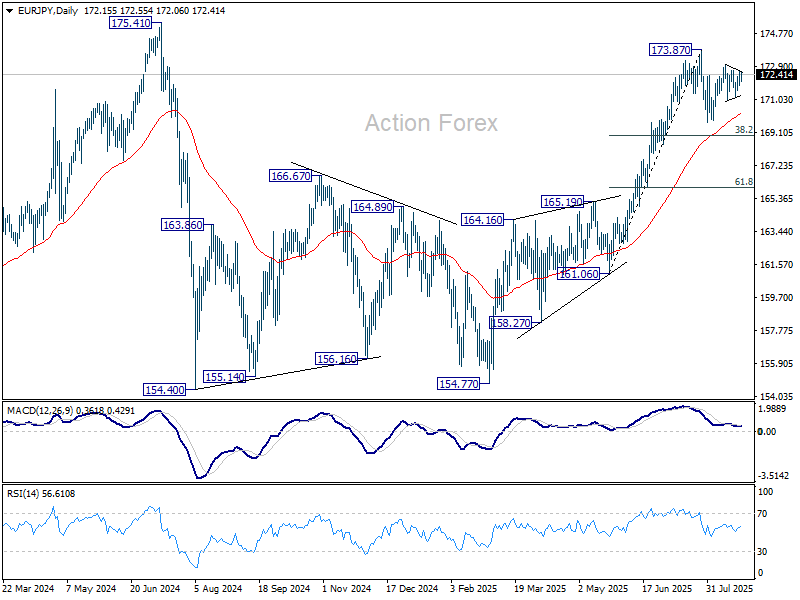
Range trading continues in EUR/JPY and intraday bias stays neutral. Overall price actions from 173.87 are seen as a corrective pattern. On the downside, below 170.94 support will bring deeper fall to 169.69 and possibly below. But downside should be contained by 38.2% retracement of 161.06 to 173.87 at 168.97 to bring rebound. On the upside, above 172.99 will bring retest of 173.87.
In the bigger picture, considering current strong momentum as seen in the rally from 154.77, corrective pattern from 175.41 could have already completed. Decisive break of 154.77 will confirm long term up trend resumption. Next target is 61.8% projection of 124.37 to 175.41 from 154.77 at 186.31. However, rejection by 175.41, followed by firm break of 55 D EMA (now at 170.23) will delay this bullish case.
EUR/GBP Daily Outlook
Daily Pivots: (S1) 0.8649; (P) 0.8660; (R1) 0.8681; More...
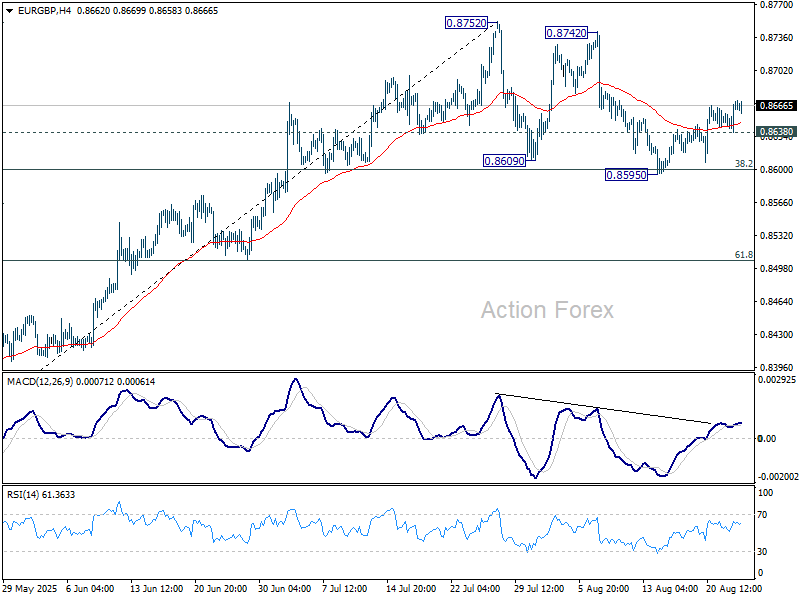
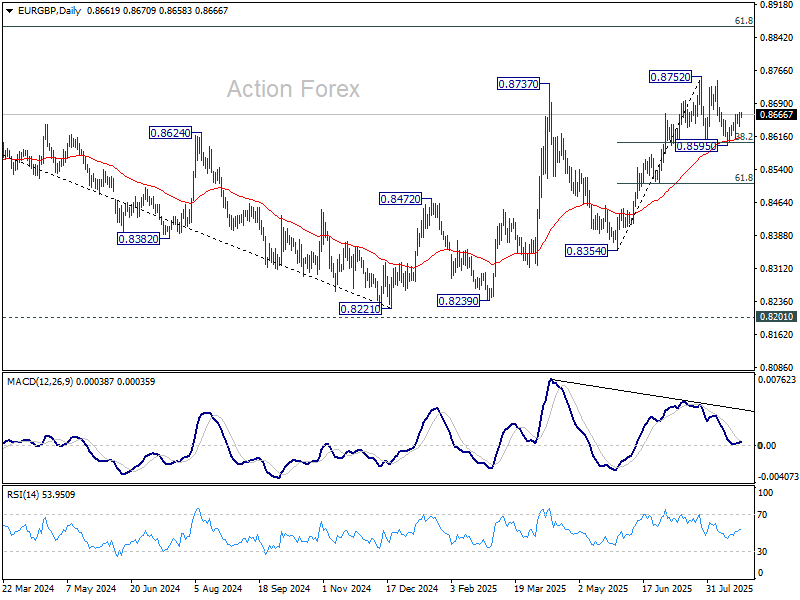
Intraday bias in EUR/GBP stays mildly on the upside at this point. Corrective pattern form 0.8752 could have completed with three waves to 0.8595. Further rise should be seen to retest 0.8752 high next. On the downside, below 0.8638 minor support will turn intraday bias neutral again first. Sustained trading below 38.2% retracement of 0.8354 to 0.8752 at 0.8600 will indicate near term bearish reversal and target 61.8% retracement at 0.8506.
In the bigger picture, the structure from 0.8221 medium term bottom are not impulsive enough to suggest that it's reversing the down trend from 0.9267 (2022 high). But even if it's a correction, further rise is expected to 61.8% retracement of 0.9267 to 0.8221 at 0.8867. This will remain the favored case as long as 55 W EMA (now at 0.8508) holds.
EUR/AUD Daily Outlook
Daily Pivots: (S1) 1.8030; (P) 1.8057; (R1) 1.8085; More...
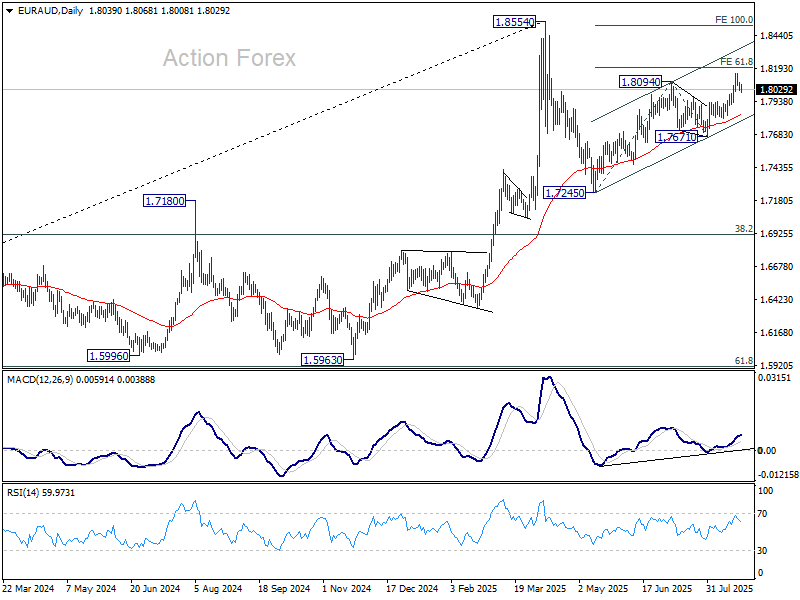
Intraday bias in EUR/AUD remains neutral and more consolidations would be seen below 1.8155. Further rally is expected as long as 1.7942 support holds. Above 1.8155 will target 61.8% projection of 1.7245 to 1.8094 from 1.7671 at 1.8196. Sustained break there will target 100% projection at 1.8520, which is close to 1.8554 high. However, break of 1.7942 will bring deeper fall back to 1.7671 support instead.
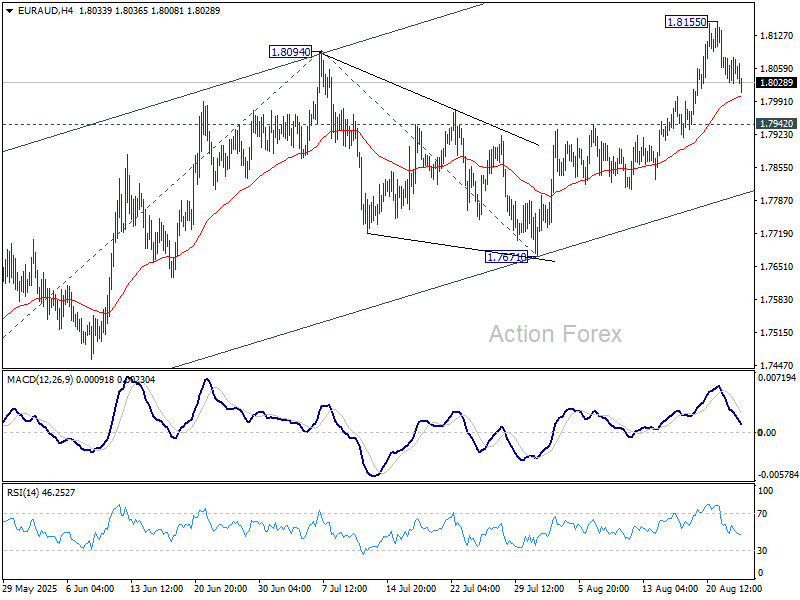
In the bigger picture, price actions from 1.8554 medium term top are seen as a corrective pattern. Such pattern could extend further with another falling leg. But even in that case, downside should be contained by 38.2% retracement of 1.4281 (2022 low) to 1.8554 at 1.6922 to bring rebound. Uptrend from 1.4281 is expected to resume at a later stage.
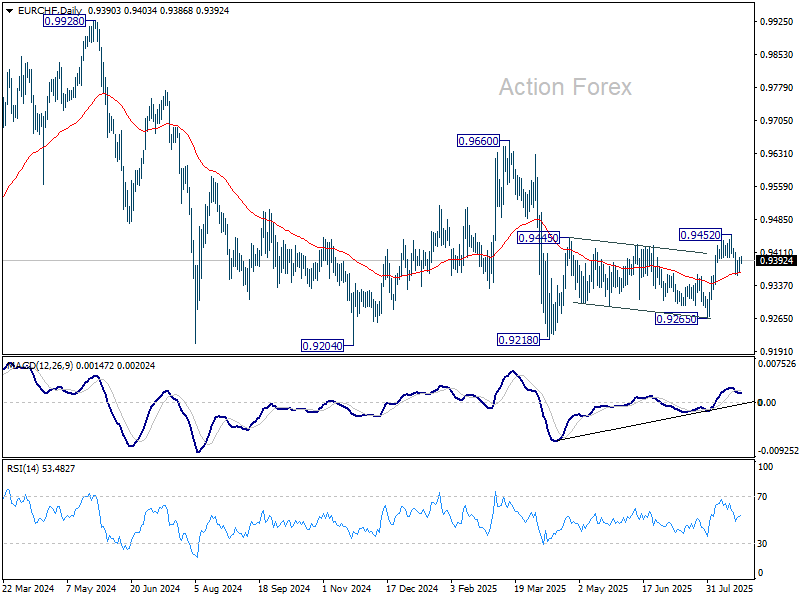
EUR/CHF Daily Outlook
Daily Pivots: (S1) 0.9375; (P) 0.9389; (R1) 0.9406; More....
Intraday bias in EUR/CHF remains neutral for the moment. On the upside, firm break of 0.9400 will bring retest of 0.9452. Firm break there will rebound whole rebound from 0.9218. On the downside, however, sustained trading below 55 D EMA (now at 0.9366) will argue that the rebound from 0.9128 has completed as a corrective move. Deeper fall would then be seen to 0.9265 support for confirmation.
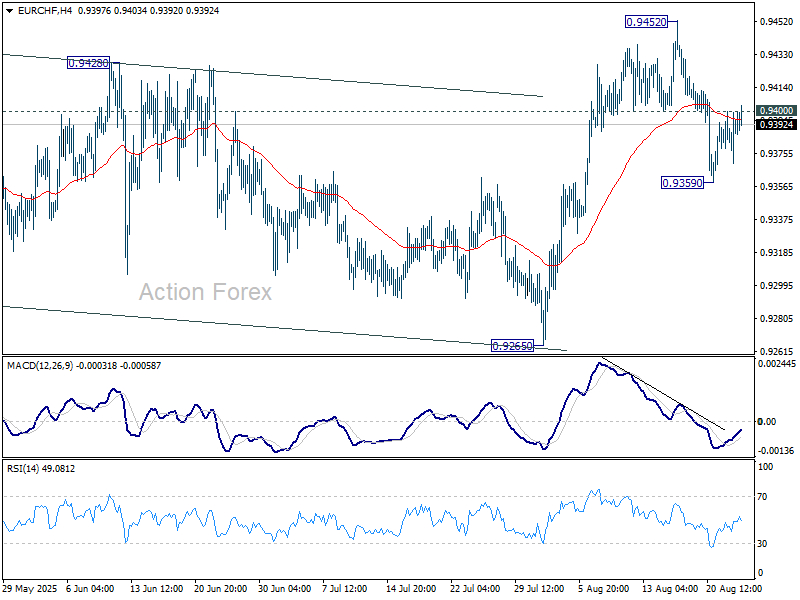
In the bigger picture, the down trend from 0.9204 (2018 high) might still be in progress considering that EUR/CHF is staying well inside the long term falling channel. However, with bullish convergence condition in W MACD, downside potential should be limited in case of another fall. Instead, firm break of 0.9660 resistance will be an important sign of medium term bullish trend reversal.