Sample Category Title
EUR/USD Gains Momentum, Yet Critical Hurdles Could Limit Upside
Key Highlights
- EUR/USD is attempting a fresh increase above the 1.1650 resistance.
- It cleared a key declining channel with resistance at 1.1685 on the 4-hour chart.
- GBP/USD is holding gains above the 1.3400 pivot zone.
- Gold could eye a fresh upward move if it clears the $3,375 barrier.
EUR/USD Technical Analysis
The Euro remained supported above 1.1580 against the US Dollar. EUR/USD started a fresh increase above the 1.1620 and 1.1650 levels.
Looking at the 4-hour chart, the pair cleared a key declining channel with resistance at 1.1685. The pair even climbed 1.1700, and settled above the 100 simple moving average (red, 4-hour) and the 200 simple moving average (green, 4-hour).
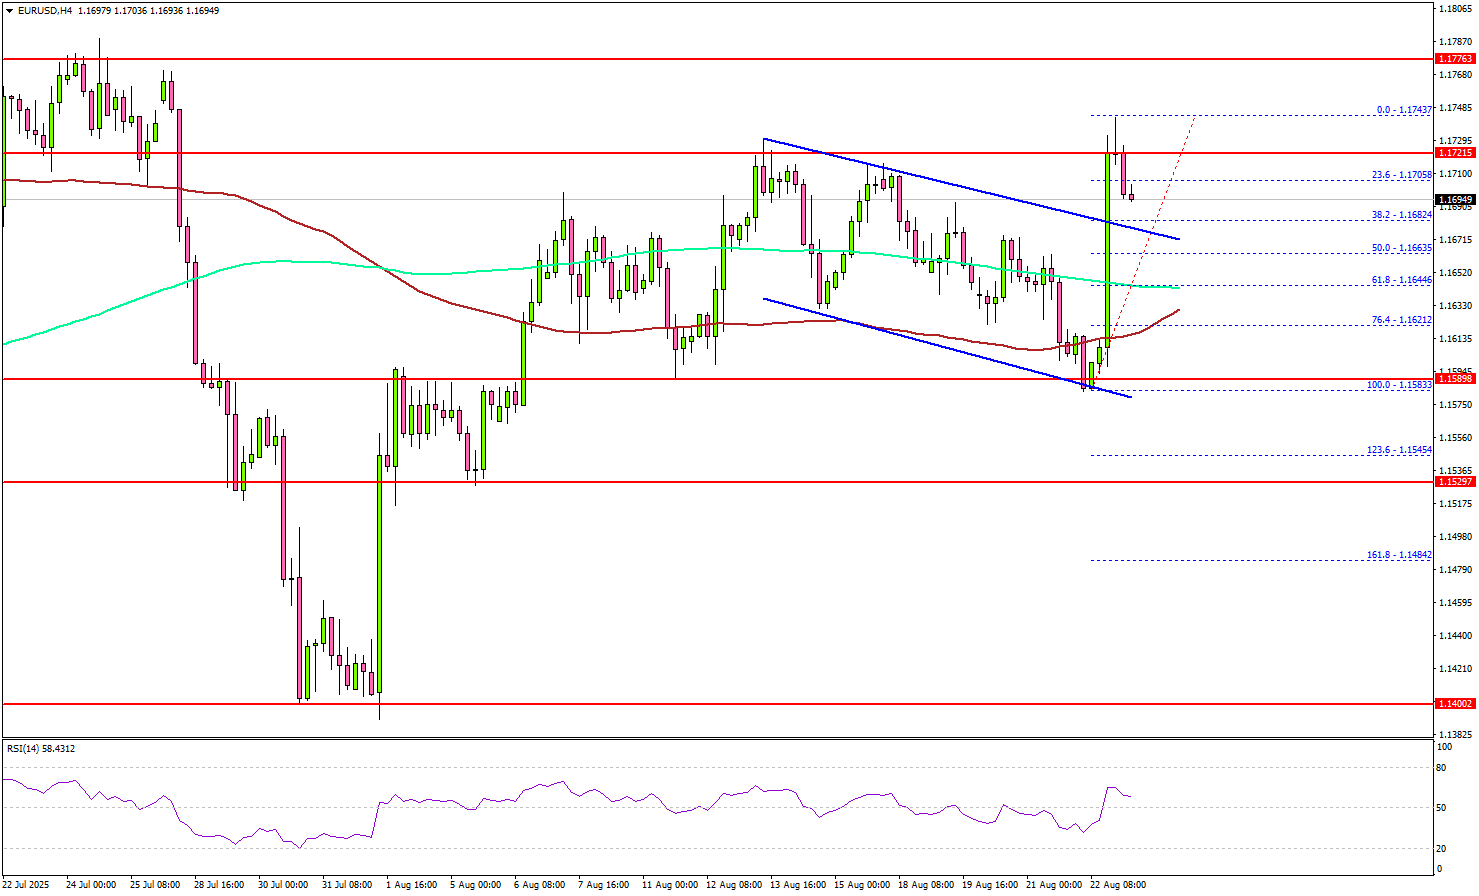
On the upside, the pair now faces resistance near 1.1730. The next key resistance sits at 1.1750. A close above 1.1750 could set the pace for another increase.
In the stated case, the pair could rise toward 1.1800, above which the bulls could aim for a move toward 1.1840. On the downside, immediate support is 1.1680 and the same channel’s trend line.
The next key support sits at 1.1645 and the 200 simple moving average (green, 4-hour). Any more losses could send the pair toward the 1.1600 support zone.
Looking at GBP/USD, the pair started a fresh increase from the 1.3400 zone, but the bears are currently active near 1.3540.
Upcoming Key Economic Events:
- US New Home Sales for July 2025 (MoM) – Forecast +0.1% versus -0.6% previous.
- Chicago Fed National Activity Index for July 2025 – Forecast -0.1, versus -0.1 previous.
Exhausted Ethereum stalls below 5,000, risk of pullback builds
Ethereum briefly surged to a new record above 4,900 over the weekend but has struggled to sustain momentum just shy of the 5,000 psychological barrier. While ETH has outpaced Bitcoin in recent weeks on the view that BTC was overextended, momentum signals indicate Ethereum may now be equally exhausted.
Besides, historically, oversized weekend surges often retrace once liquidity returns early in the week. That dynamic, coupled with stretched momentum, leaves Ethereum exposed to a near-term correction.
Technically, while further rise cannot be ruled out yet, bearish divergence condition in 4H MACD suggests that Ethereum's upside will likely be capped by 200% projection of 1,382.55 to 2,879.27 from 2,110.58 at 5,104.02. This makes the 5,000–5,100 area a formidable resistance zone.
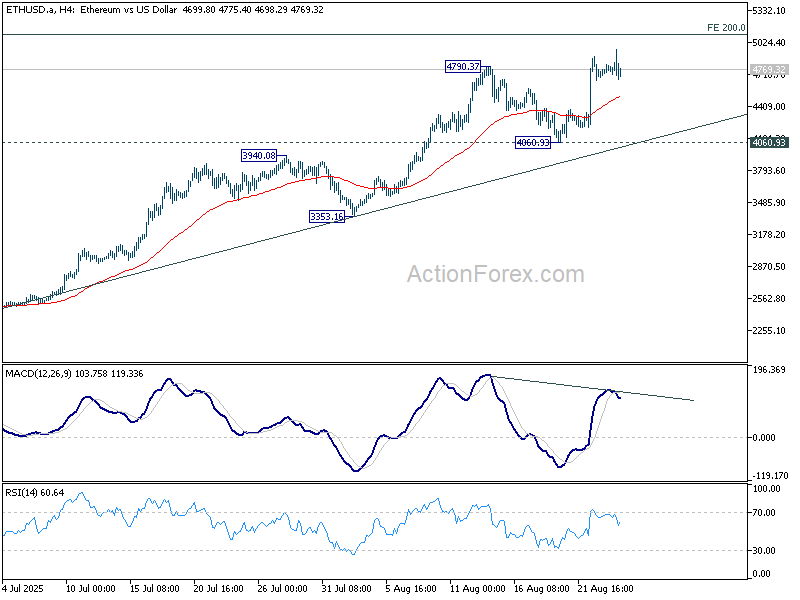
On the downside, firm break of 55 4H EMA (now at 4,508.16) will confirm short term topping. In this case, Ethereum should then be correcting the rise from 2,110.58, which is seen as the third leg of the whole up trend from 1,382.55. Deeper correction should be seen to 4,060.93 support, or even further to 55 D EMA (now at 3,806.63) before resuming the up trend again with the final leg.

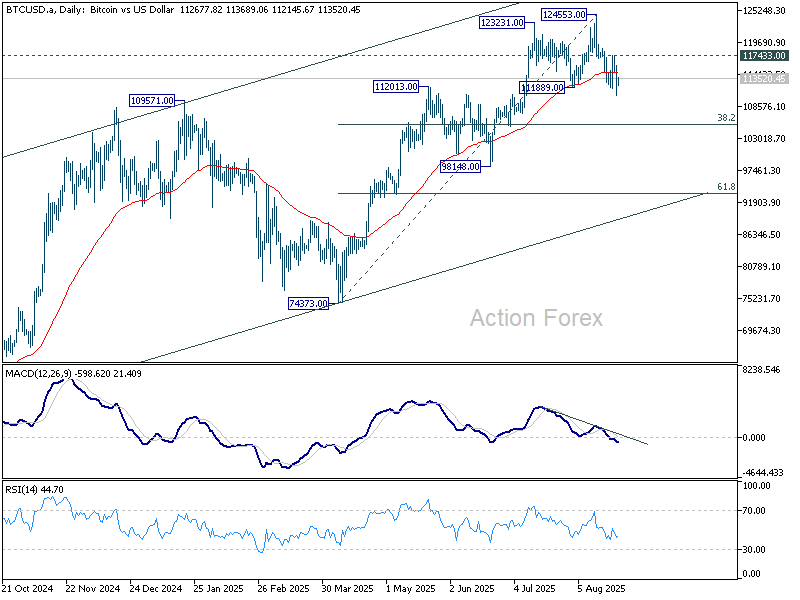
As for Bitcoin, the break of 111,889 support suggests that it's already correcting the rise from 74,373. Near term risk will stay on the downside as long as 117,433 resistance holds. Deeper correction should be seen to 38.2% retracement of 74,373 to 124,553 at 105,384.
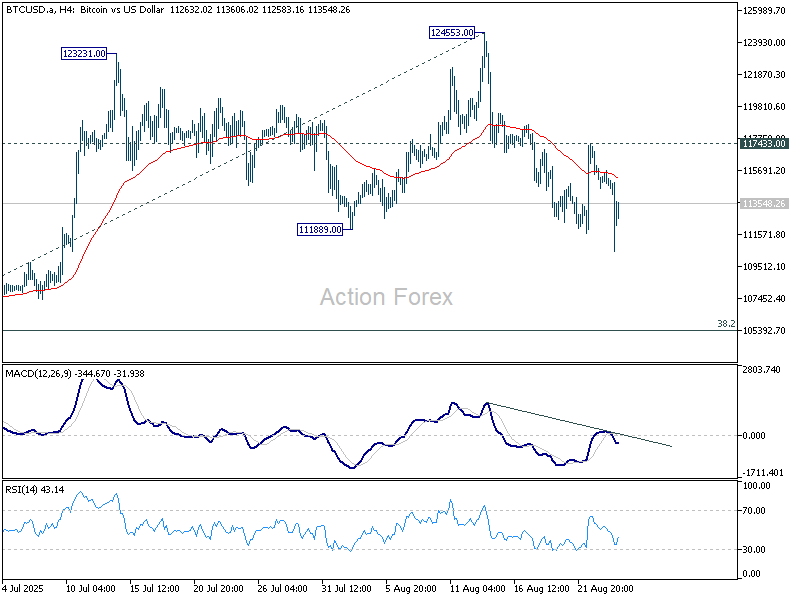
This leaves the near-term outlook more cautious across the crypto space, with both BTC and ETH vulnerable to profit-taking before attempting fresh highs later in the cycle.
Jackson Hole: Powell Hints at Rate Cut, USD Falls, Stocks Rise
Markets were quiet for most of last week as traders waited for Fed Chair Jerome Powell’s speech at Jackson Hole. Until Friday, the U.S. dollar traded sideways and stocks moved lower as investors wanted to hear if the Fed would confirm a rate cut in September. Economic data before the speech was mostly better than expected, with stronger PMI figures in the U.S., U.K., and Eurozone, higher U.K. CPI, and U.S. home sales beating forecasts. Japan’s core inflation slipped to 3.1% in July, just above expectations, while Canada’s removal of retaliatory tariffs was seen as positive for global trade.
On Friday, Powell hinted the Fed may cut rates next month, saying both labor demand and supply are slowing. He stressed that while tariffs are lifting prices, these effects are likely temporary. His tone was more dovish, and markets reacted strongly—equities surged with the Dow hitting a record high, and the U.S. dollar weakened as the chance of a September rate cut rose to about 90%.
Powell also emphasized that the Fed remains data-driven and independent despite political pressures. With job growth slowing and unemployment risks rising, markets are now waiting for this week’s labor and inflation data to confirm whether the Fed will move at the September meeting.
Markets This Week
U.S. Stocks
The Dow hit new record highs last week after Fed Chair Powell’s Jackson Hole speech, with a September rate cut now seen as highly likely. With the negative impact of U.S. tariffs proving less severe than expected, U.S. stocks remain in a strong upward trend. However, the Dow is currently looking overbought, so a pullback or sideways move is likely at the start of the week, which could provide a buying opportunity for both short- and long-term traders. Key resistance levels are at 46,000 and 47,000, while support is seen at 45,000, 44,000, and 43,000.
Japanese Stocks
After hitting a record high early last week, the Nikkei faced profit-taking ahead of Powell’s speech but later found support at previous highs and closed strongly, following the surge in U.S. equities. The index has risen sharply over the past month and has now moved back below the 10-day moving average, suggesting sideways trading in the short term as investors look ahead to when the Bank of Japan may raise interest rates. Key resistance levels are at 44,000円 and 45,000円, while support is seen at 42,250円, 42,000円, 41,500円, and 41,000円.
USD/JPY
The USD/JPY traded sideways for most of last week ahead of the Jackson Hole meetings, before falling sharply after Powell’s speech, as a September U.S. rate cut now looks highly likely. The pair remains in a range, with the 10-day moving average also pointing sideways, making range trading the preferred strategy. However, risks lean to the downside if the Bank of Japan signals it is close to raising interest rates or if upcoming U.S. data disappoints. Resistance is at 148, 149, and 150, while support is at 146 and 145.
Gold
Gold initially tested lower last week but recovered strongly as expectations of a U.S. interest rate cut in September supported demand. The market has moved back above the 10-day moving average, breaking the recent downtrend. Overall, gold remains range-bound, but with support holding, the market could continue to test higher levels, making buying on weakness the preferred strategy. Resistance is at $3,400 and $3,450, while support is at $3,300, $3,250, and $3,200.
Crude Oil
Crude oil rebounded in a quiet week, breaking the recent downtrend after closing above the 10-day moving average. Buyers returned as talks to end the Russia–Ukraine war showed little progress, while Powell’s comments on future rate cuts were seen as supportive for demand. With the downtrend now broken, prices are expected to trade sideways in the short term as traders wait for further news from the negotiations. Resistance is seen at $65, $70, and $75, while support is at $60 and $55.
Bitcoin
Further selling continued through most of last week after the negative key reversal signal on the daily chart, but the market found strong support at $112,000, the August lows and previous record highs. Powell’s speech was positive for Bitcoin, as lower interest rates make the asset more attractive, though Bitcoin remains in a short-term downtrend. For now, the market is likely to trade sideways, offering range-trading opportunities between $112,000 and $120,000 this week. Resistance is at $120,000, $125,000, and $150,000, while support is at $112,000, $110,000, and $105,000.
This Week’s Focus
- Monday: U.S New Home Sales
- Tuesday: Australia Reserve Bank Minutes, U.S. Durable Goods Orders, U.S. CB Consumer Confidence
- Thursday: U.S. GDP, U.S. Initial Jobless Claims, U.S. Pending Home Sales
- Friday: Japan Tokyo Core CPI, Japan Industrial Production, U.S. Core PCE Price Index, U.S. Chicago PMI, U.S. Michigan Consumer Sentiment
This week, traders are still reacting to Fed Chair Powell’s speech at Jackson Hole. His dovish comments raised hopes for a September rate cut, but the question now is whether the dollar will keep falling or if the cut is already fully priced in, leading to a rebound. Powell stressed that the Fed is data-driven, so important U.S. reports on durable goods, GDP, inflation, and consumer confidence will be key. These numbers could quickly change market expectations and create new trading opportunities.
Geopolitics may also play a role. A possible breakthrough in Russia–Ukraine peace talks, though unlikely, would likely lift equities but push oil lower. At the same time, traders are watching the Bank of England for signs of another rate cut, and Japan for a possible rate hike after strong GDP. With central bank signals and global risks in focus, volatility is likely to stay high across currencies, stocks, and commodities.
ECB’s Lagarde highlights migrant labor as key Eurozone growth support
At Jackson Hole on Saturday, ECB President Christine Lagarde credited foreign workers with playing a vital role in supporting the Eurozone economy. She said migration inflows have helped counterbalance reduced working hours and weaker living standards, providing stability during a period of subdued real wage growth.
Lagarde pointed out that although foreign workers represented just 9% of the bloc’s labor force in 2022, they contributed fully half of its growth over the previous three years. "Without this contribution, labor market conditions could be tighter and output lower," she added.
BoE’s Bailey cites falling labor participation rate as UK’s “sad story”
BoE Governor Andrew Bailey warned at Jackson Hole on Saturday that the UK faces an “acute challenge” of weak underlying growth compounded by reduced Labor force participation. He stressed that with ageing demographics unlikely to reverse, raising productivity growth must become a priority to offset the economy’s structural drag.
Bailey said the BoE has shifted its focus from long-term unemployment trends to participation rates, noting that the proportion of working-age Britons active in the Labor market remains lower than before the pandemic, unlike in most advanced economies. While he cautioned that survey data contains caveats, he argued they do not fully explain the shortfall.
Calling it a “pretty sad story for the UK,” Bailey said diminished participation leaves the UK at the bottom of global rankings. This structural weakness is also feeding into inflation concerns, with some policymakers fearing that limited Labor supply is one reason why UK inflation, at 3.8% in July, remains the highest in the G7.
BoJ’s Ueda sees tight labor market sustaining wage growth
BoJ Governor Kazuo Ueda told a Jackson Hole panel on Saturday that Japan’s labor shortages are becoming “one of our most pressing economic issues.” He highlighted that wage growth, once concentrated in large enterprises, is now spreading to smaller firms.
Ueda said that barring a major negative demand shock, "the labor market is expected to remain tight and continue to exert upward pressure on wages". He noted that the demographic shifts set in motion since the 1980s are now driving both "acute labor shortages and persistent upward pressure on wages"
According to Ueda, these shifts are forcing supply-side adjustments, including higher participation rates, greater labor mobility, and increased capital-labor substitution. He pledged the BoJ will "continue to monitor these developments closely and incorporate our assessment of evolving supply-side conditions into the conduct of monetary policy."
First Impressions: NZ retail Trade, June Quarter 2025
Retail spending levels rose 0.5% in the June quarter, beating expectations. Retail sector conditions remain tough, but we are starting to see signs of the long-awaited recovery taking shape.
June quarter retail sales
- Retail sales (volume of goods sold): +0.5% (Prev: +0.8%)
- Westpac f/c: -0.7%, Market: -0.3%
- Core retail sales (volume of goods sold): +0.7% (Prev: +0.4%)
- Nominal retail sales: +0.1% (Prev: +1.4%)
Year to June
- Volume of goods sold: +2.3%
- Nominal sales: +2.5%
Retail spending stronger than expected in the June quarter
The June retail spending report was better than expected. While overall spending growth is still modest, spending appetites are gradually firming, including a lift in some discretionary categories.
Retail spending rose 0.5% over the June quarter. That’s the third quarter in a row that spending levels have been pushing higher. The result was well ahead of our own forecast and the average market forecast for a fall in spending over the June quarter.
At first glance, today’s result seems at odds with comments from the retail and hospitality sectors of continued soft trading conditions. But digging under the surface, we can start to see what’s going on.
In several sectors (especially durable items for the home), spending levels remain well down on the levels we saw in 2021. In addition, while spending levels are turning higher, spending growth remains quite modest – the volume of goods sold rose around 2.5% over the past year, compared to gains of around 4.5% per annum before the pandemic.
But while the retail sector is still confronting some tough trading conditions, we are starting to see signs that the long-awaited recovery is taking shape. Spending levels have risen for the past three quarter. That includes gains in discretionary areas like recreational goods and electronics. However, it is still a mixed picture with spending in sectors like hospitality still flat.
What’s the outlook for the rest of 2025?
Today’s update is an encouraging sign for spending over the remainder of 2025. Spending levels are already pushing higher, and the full impact of the large reductions in interest rates over the past year is yet to be felt.
Over the coming months, increasing numbers of borrowers will be rolling on to lower borrowing rates. The related lift in disposable incomes could be sizeable in some cases, and that’s set to boost spending through the latter part of the year.
There are still some headwinds for the retail sector. Most notably, unemployment is likely to rise around to 5.3% before the end of the year.
Even so, it looks like a recovery in the retail sector is now taking shape.
Implications for GDP growth
We’re forecasting flat GDP growth over the June quarter. Today’s result was ahead of our expectations. However, we’ll take a closer look at how our forecast for GDP growth is shaping up over the next couple of weeks as additional data on June quarter activity is released.
Dow (YM) Rockets Higher From Extreme Zone—Bull Run Continues
Dow (YM) Futures bounced from the extreme support zone and broke to new highs, extending April’s bullish cycle. This post shows how our Elliottwave analysis positioned members ahead of the move—spotting the setup before the breakout.
Following the end of the February 2025 pullback that corrected the bullish cycle from October 2022, a new bullish cycle started on 7th April 2025. This cycle marked the 5th wave of the long term bullish cycle from March 2020. The April 2025 bullish cycle broke into a new high on 28th July 2025. Following this breakout, we recommended to members to buy at the extreme of the 3/7/11 swing pullback. Our system focuses on buy pullbacks within a bullish trend. Likewise, when the sequence is bearish, we prefer to sell at the extreme of corrective bounces. However, we do not just trade any structures. We like to trade off the extreme of a zigzag/double zigzag/triple zigzag corrective structure. We traded the double
Understanding the Double Zigzag (7-swing structure) in Elliott Wave Theory
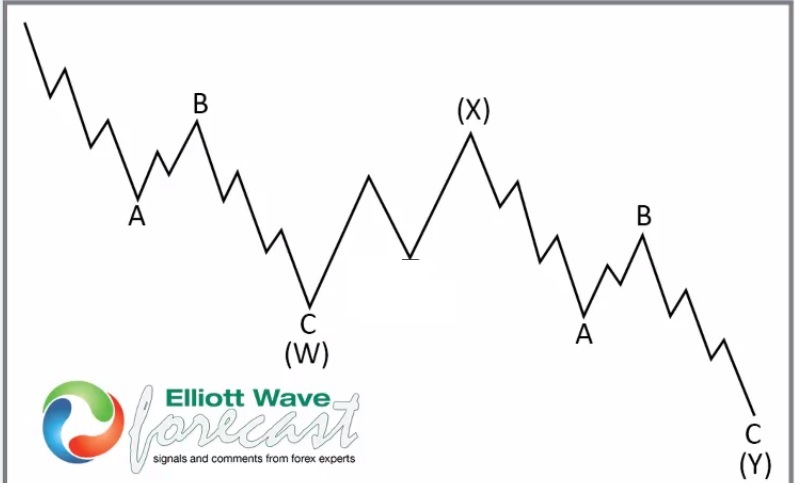
In Elliott Wave analysis, a double zigzag is a complex corrective pattern that helps the market correct deeper than a single zigzag. It’s labeled as W-X-Y, where:
- W and Y are both zigzag structures (5-3-5)
- X is a connecting wave, often a simple corrective move
Key Traits of a Double Zigzag:
- It appears in corrective phases, especially when the market needs to retrace more aggressively.
- The second zigzag (Y) often reaches the 100% of W from X
- It’s more directional than other complex corrections, making it easier to trade with proper wave identification.
Tip: When you spot a zigzag that doesn’t seem to complete the correction, watch for an X wave followed by another zigzag—it might just be a double zigzag unfolding.
After the Dow (YM) marginally reached a new high in July, it pulled back and rallied again in a clear 5-wave structure. Thus, on the shorter cycle, we waited for a perfect 3/7/11 swing and recommended to members to buy at the extreme.
YM Elliott Wave Analysis – 22 August 2025 Update
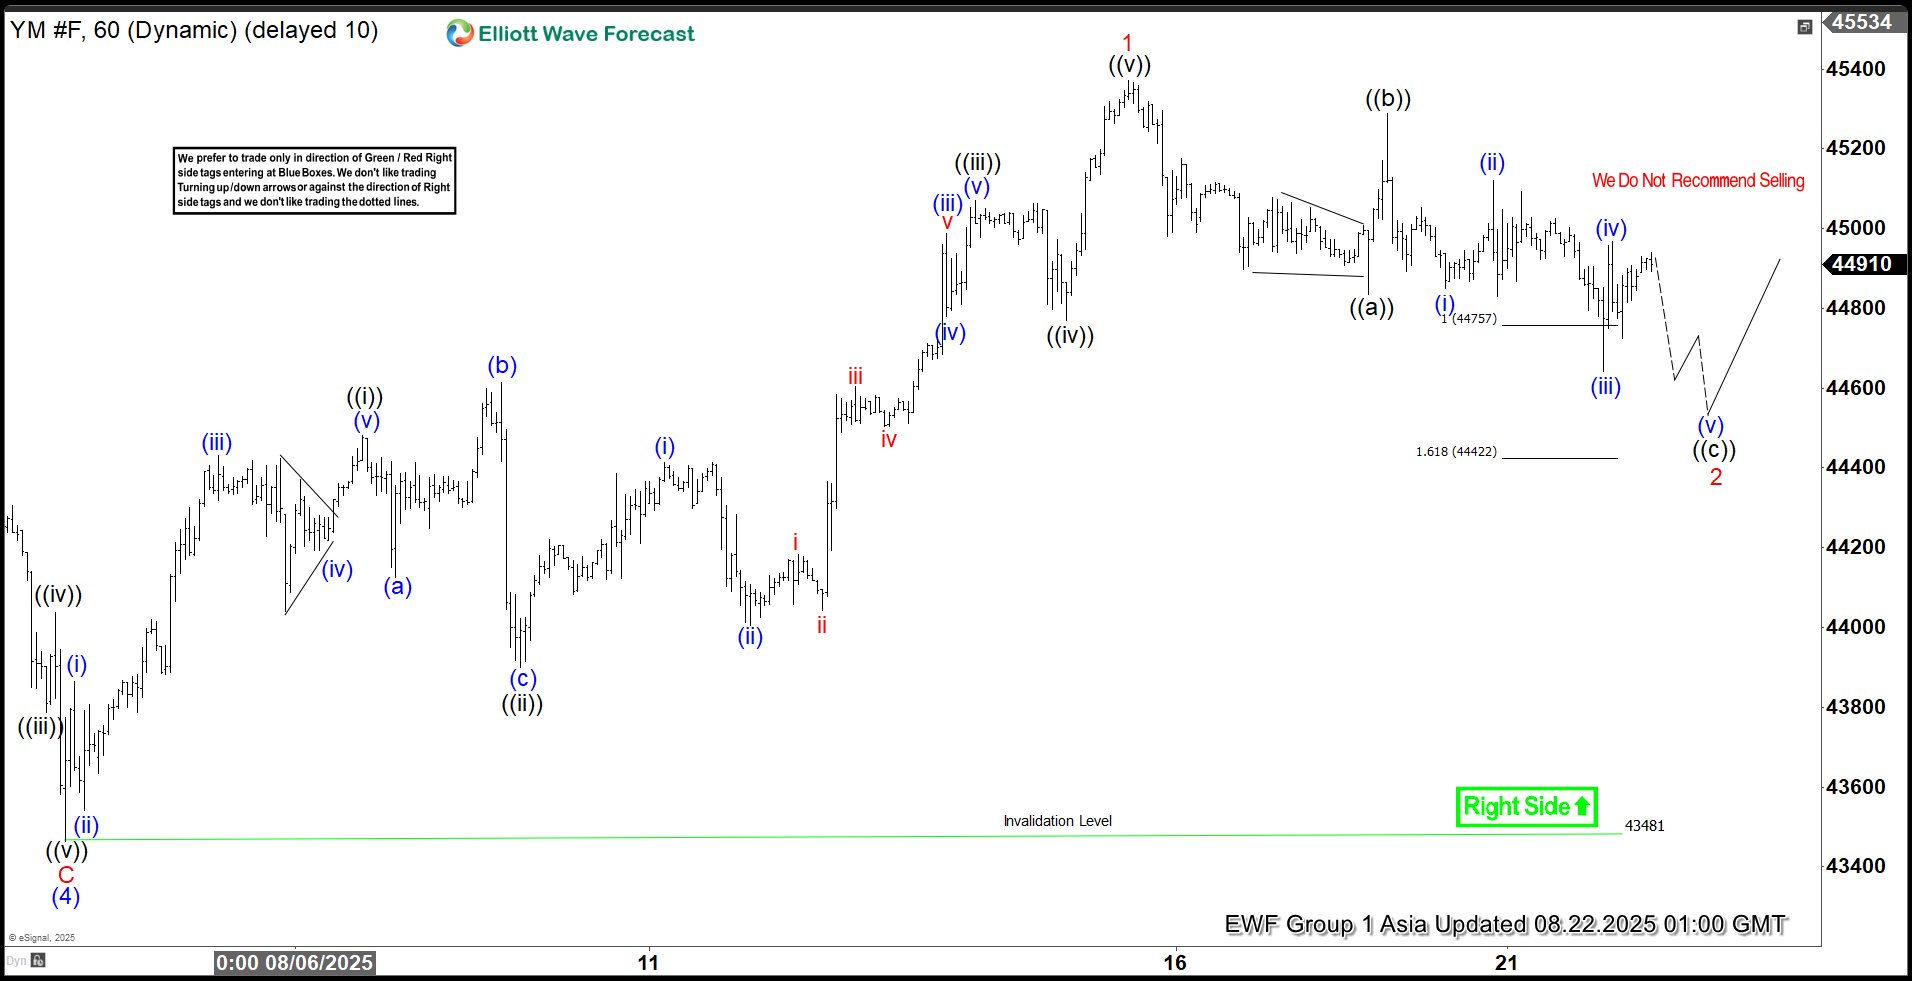
On 22nd August, we shared the chart above showing a 7-swing pullback for wave 2 of (5). The wave (5) is to be the 5th wave of the April cycle. While incomplete, we decided to buy at the extreme of the wave 2 of (5), anticipating to profit off wave 3 of (5) rallies. Price reached the 44757-44422 buying zone and bounced sharply as the chart below shows.
YM Elliott Wave Analysis – 23 August 2025 Update
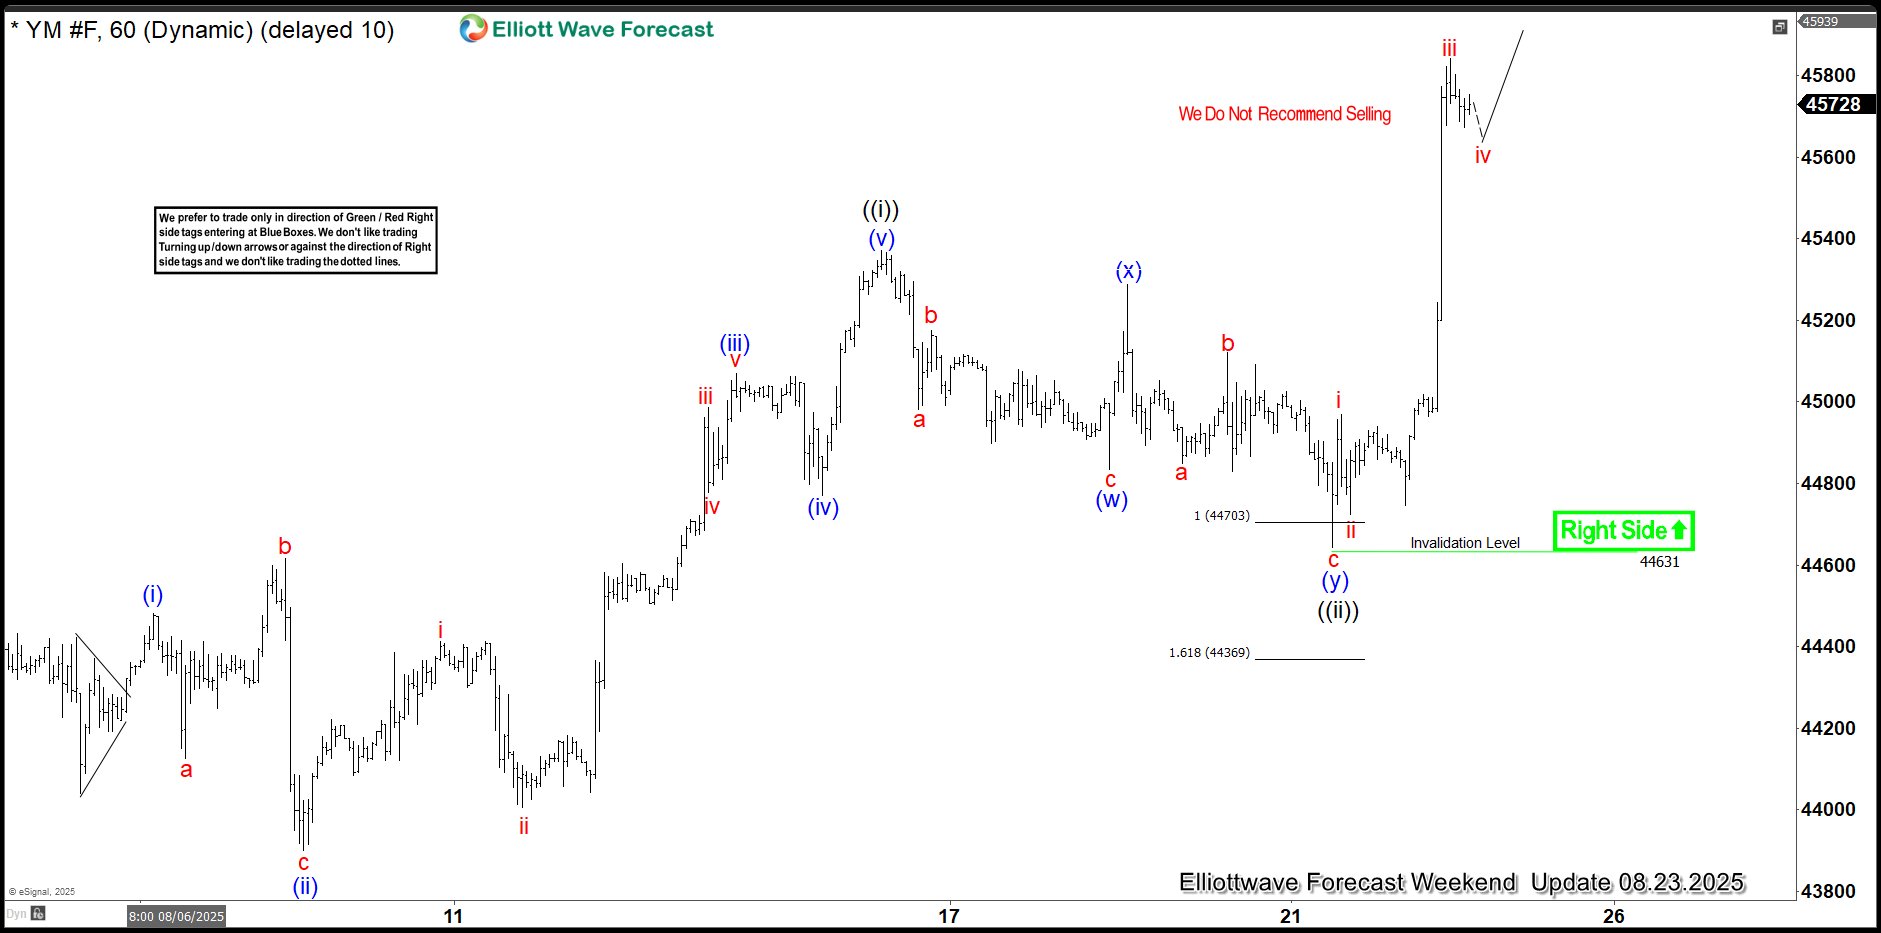
The chart above is the H1 23-August weekend update we shared to members. A perfect reaction from the extreme zone put buyers in good profit while anticipating for more. Going into the new week, we will still anticipate support from the extreme of a 3/7/11 swing pullback toward a new high. We will alert members with new H1 charts several times a day, as price action develops.
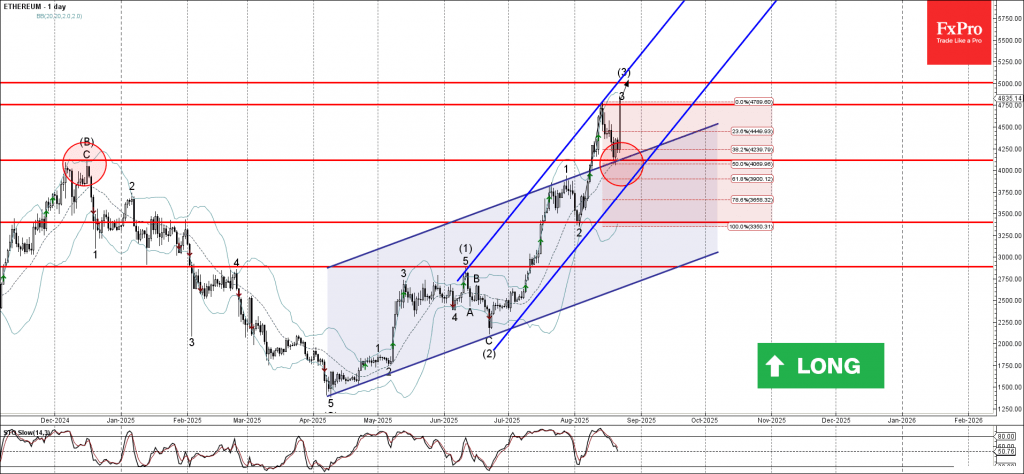
Ethereum Wave Analysis
Ethereum: ⬆️ Buy
- Ethereum broke above the resistance level 4750.00
- Likely to rise to resistance level 5000.00
Ethereum cryptocurrency recently reversed up from the support area between the support level 4115.00 (former multi-month high from December), upper trendline of the recently broken up channel from June and the 50% Fibonacci correction of the upward impulse from the start of August.
The upward reversal from this support area accelerated the active impulse wave 3 of the higher order impulse wave (3) from June.
Having just broke above the resistance level 4750.00, Ethereum cryptocurrency can be expected to rise to the next round resistance level 5000.00 (target for the completion of the active impulse wave 3).
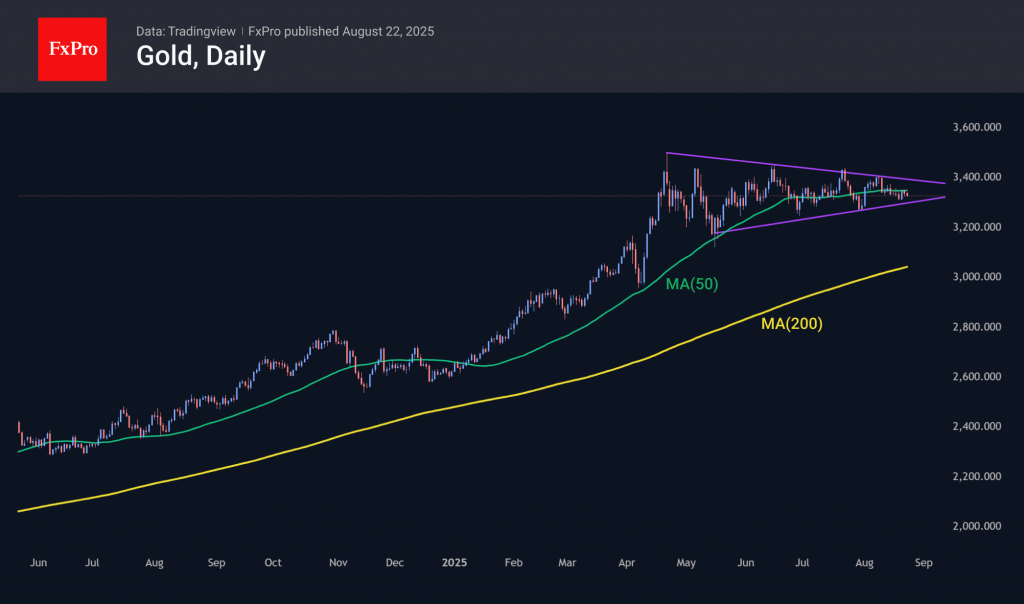
Tedious Seesaw for Gold About to End
Gold’s hopes for an aggressive cut in the Fed’s federal funds rate, the associated decline in Treasury bond yields, and the weakening of the US dollar have not yet materialised. The Fed is likely to ease monetary policy in September. However, it may then pause again. Its slowness is bringing investors’ interest back to the greenback.
Clouds are gathering over the precious metal due to Donald Trump’s efforts to end the armed conflict in Ukraine. The start of hostilities, followed by the West’s freezing of Russia’s gold and foreign exchange reserves, was the starting point for the Gold’s rally. Since February 2022, gold has risen 1.7x and reached a record high of more than $3,500 per ounce in April. The rally was driven by de-dollarisation, active buying of bullion by central banks, and increased demand for ETFs.
In the second quarter, central bank activity in the precious metals market declined significantly, and capital flows into specialised exchange-traded funds slowed. Without these advantages, XAUUSD can forget about recovering the upward trend. However, the favourable external background in the form of monetary stimulus from the Fed, lower Treasury yields, and a weaker US dollar in the medium term will give gold a boost.
The gold chart clearly shows consolidation since April, with the price right in the middle of the 12% range from peak to correction lows. This tedious five-month movement to the right is likely to end in the coming weeks, as August often marks the start of major trends in gold. The duration of consolidation is often directly proportional to the strength of the breakout.
From a technical analysis perspective, given the accumulated overbought condition, the downside potential is huge – up to $3000 or even $2200 per ounce. However, the upside potential is no less impressive: $4600 in an extreme bullish scenario, including the Fed switching to a mode of absolute softness.