Sample Category Title
Powell’s Dovish Pivot Sinks Dollar, Propels Wall Street to Records
The past week marked one of the most decisive turns for markets in months. Fed Chair Jerome Powell’s Jackson Hole speech was the clear catalyst, tilting Fed closer to easing and sparking a rally that lifted Wall Street to new highs. Dollar, by contrast, tumbled sharply.
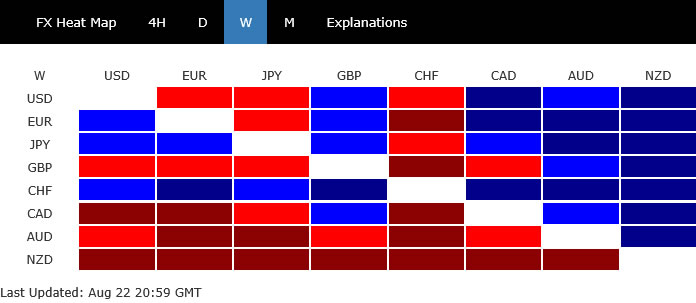
On the surface, Swiss Franc and Yen came out on top in weekly FX performance, supported early by risk aversion but now facing pressure as Fed easing hopes drive global stocks higher. Euro also gained, bolstered by resilient Eurozone data that hinted the bloc may be handling trade headwinds better than feared.
On the other side, Kiwi was weighed down by RBNZ’s dovish cut, which left the door wide open for more easing both this year and next. Aussie tracked lower in sympathy, though its fate hinges on whether it can decouple from its weaker neighbor. Sterling also lagged despite firmer inflation readings.
Dollar ended in the middle of the pack, along with Loonie. But the greenback’s late-week slide suggests this is more than just a temporary adjustment. Selling momentum is likely to extend, at least for the near term, until incoming data like non-farm payrolls give fresh guidance.
Powell Tilts Fed Toward September Cut, Yet Consensus Still Fractured
US equity markets roared higher on Friday as investors embraced Fed Chair Jerome Powell’s Jackson Hole speech as a dovish pivot. DOW jumped 846 points, or 1.89%, to a record close at 45,631.74. S&P 500 rose 1.52%, while NASDAQ gained 1.88%, with tech and cyclicals leading broad-based gains. Currency markets told the same story in reverse. Dollar was dumped across the board, extending sharp losses as traders repriced the Fed outlook.
The key line was Powell’s acknowledgment that “with policy in restrictive territory, the baseline outlook and the shifting balance of risks may warrant adjusting our policy stance.” Markets interpreted this as the clearest sign yet that Fed is edging toward rate cuts.
Powell’s wording suggests that Fed has effectively looked through tariff uncertainty and is now more concerned about the slowdown in the labor market. In effect, the central bank may have shifted from a “no move unless there is a surprise” stance in July to a “cut unless there is a surprise” stance heading into September.
Fed fund futures quickly reflected the shift in tone. Probability of a September cut, which had dipped near 70% earlier in the week following robust US PMI data, rebounded to around 85%. While still shy of the 90%-plus odds seen a week ago, the repricing was swift and decisive after Powell’s speech.
That said, Powell’s view is not necessarily the consensus within Fed. Hawks have continued to push back against market optimism. Cleveland Fed President Beth Hammack reiterated that if the FOMC were meeting tomorrow she “would not see a case for reducing interest rates,” citing persistently high inflation that's “trending in the wrong direction”.
Kansas City Fed President Jeffrey Schmid voiced similar caution, stressing that with inflation still closer to 3% than 2% and the labor market stable, there was “no rush” to cut. He said policymakers would need “very definitive data” before justifying a move.
This hawkish resistance means any September rate cut is likely to be accompanied by a split vote. Powell may have nudged the Fed toward easing, but consensus remains elusive. The committee is far from united on whether inflation progress is sufficient to justify a pivot.
Beyond September, the path looks even less certain. Unless incoming data — particularly the next NFP and CPI releases — shift hawkish views, the Fed is unlikely to commit to an aggressive easing cycle. A cautious, data-dependent path remains the most likely scenario.
For now, markets are content with Powell’s hint. Wall Street has surged to fresh records and the Dollar has slumped, but the real test will be whether upcoming data give Fed hawks reason to relent, or whether they push back hard enough to temper the market’s enthusiasm.
DOW Hits Record, Dollar Index Vulnerable
Powell’s dovish shift at Jackson Hole not only triggered a powerful rally in equities and a broad Dollar selloff but also set up key technical developments across major benchmarks. The breakout in DOW and the vulnerability in Dollar Index are now reinforcing the macro narrative, showing that the policy pivot is translating directly into decisive market momentum.
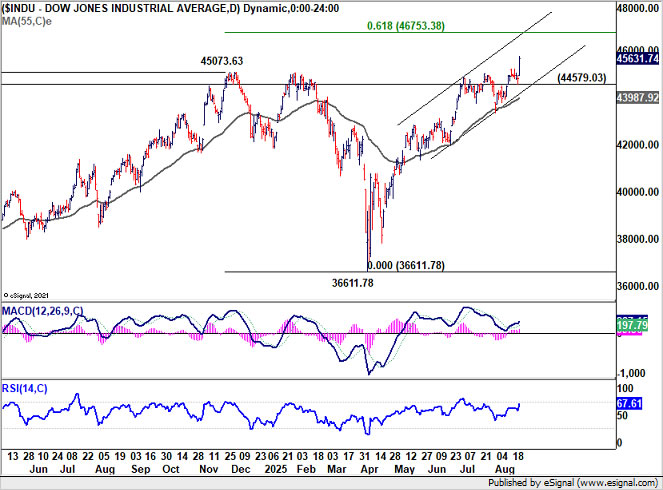
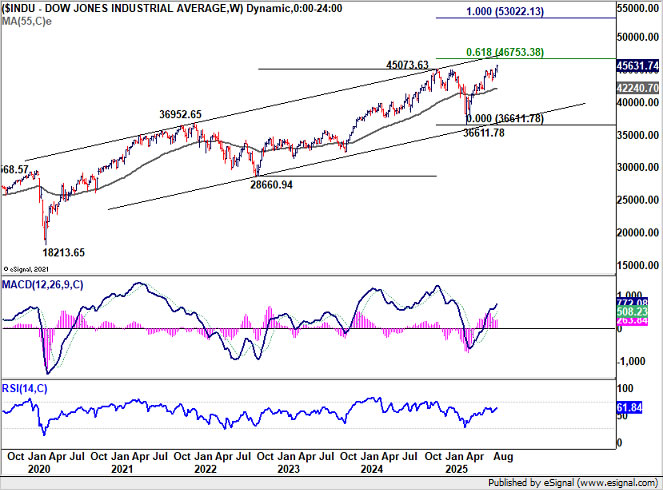
DOW finally cleared the critical 45,073.63 resistance last week, resuming its long-term uptrend with mild upside acceleration evident in D MACD. The clean breakout validates the bullish structure that has been building for months and sets the stage for further gains.
Near-term outlook will stay bullish as long as 44,789.03 support holds. The next major hurdle comes at 61.8% projection of 28,660.94 to 45,073.63 from 36,611.78 at 46,753.38. This level is in proximity to the upper boundary of the long-term rising channel, implying strong resistance could be seen on the first approach.
However, sustained break above this Fibonacci level, coupled with a decisive break of the rising channel ceiling, could prompt medium-term upside acceleration. Such a scenario would open the door for DOW to push beyond the psychological 50,000 mark toward 100% projection at 53,022.13.
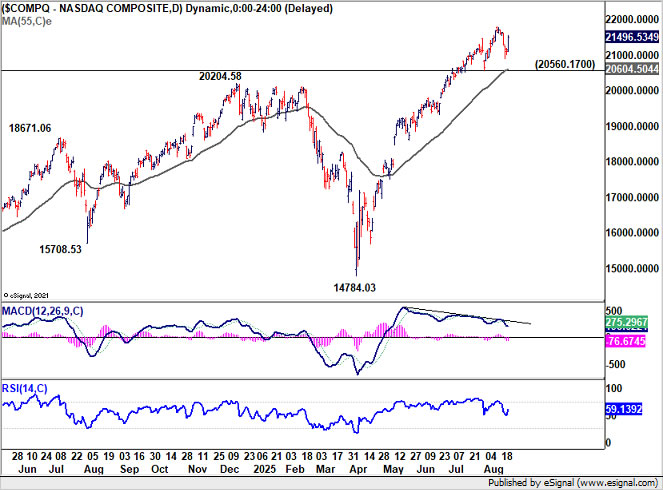
NASDAQ also held up despite a sharp intra-week slump. Downside was contained well above 20,560.17 support, keeping the near-term uptrend intact. The key question now is whether the index can muster enough momentum to break decisively through its own long-term channel resistance. If it succeeds, the path for NASDAQ would be open toward 100% projection of 10088.82 to 20204.58 from 14784.03 at 24899.78 as next medium term target.

Dollar Index, meanwhile, looks increasingly vulnerable. Price action from 96.37 is still viewed as a corrective pattern that could extend. A bounce back toward 100.25 cannot be ruled out. But rejection at 55 D EMA keeps near-term bias tilted lower. The broader risk lies to the downside.
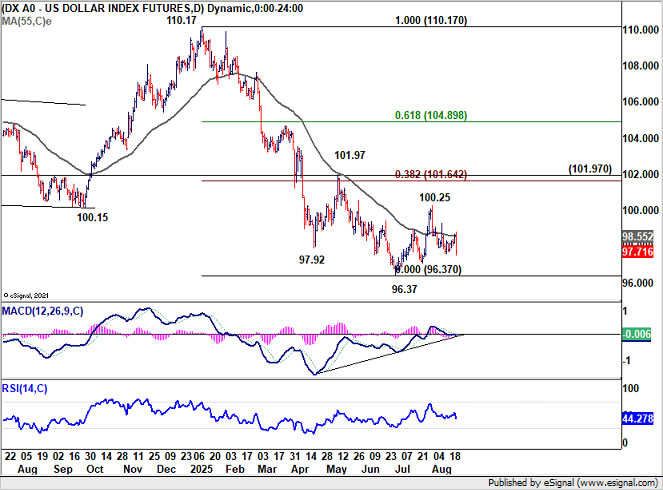
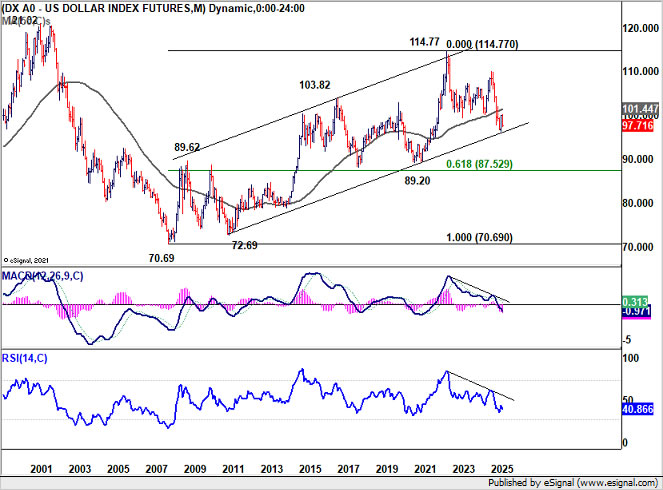
With risk appetite strengthening and equities breaking higher, Dollar Index could soon crack below 96.37 support, confirming resumption of the broader decline from 110.17. That would also threaten the long-term channel that has defined the uptrend since 2008 low at 70.69. Sustained break of the channel would signal the start of a medium-to-long-term downtrend toward levels below 90.
EUR/USD Eyes Structural Test on Policy Divergence
Fed’s dovish tilt and Dollar Index’s vulnerability are not happening in isolation. Developments in Europe are also shaping the outlook, with Eurozone resilience and ECB's pause in easing adding another additional pressure on the greenback.
Last week’s Eurozone data strengthened the case that ECB is now firmly in a prolonged pause. Even if the easing cycle might not have fully ended, there is little urgency to deliver further cuts. As the Fed edges closer to rate reduction, this divergence lends EUR/USD a supportive backdrop.
Eurozone's August PMI reports provided a boost to sentiment. Manufacturing returned to expansion, while services held resilient despite trade frictions and tariffs. The data suggest that Eurozone businesses are coping better than expected with both global and domestic headwinds.
Wages development in Eurozone also remain a key factor. Negotiated pay jumped 3.95% yoy in Q2, up sharply from 2.46% in Q1. While below the peak 5.4% rate of 2024, the rebound underscores the persistence of domestic cost pressures. This stickiness ensures ECB will remain wary of easing too far.
Technically, while EUR/USD's pullback last week was slightly deeper than expected, the strong support from 55 D EMA affirms near term bullishness. The development is so far in line with the case that correction from 1.1829 has completed at 1.1390, and up trend from 1.0176 is ready to resume.
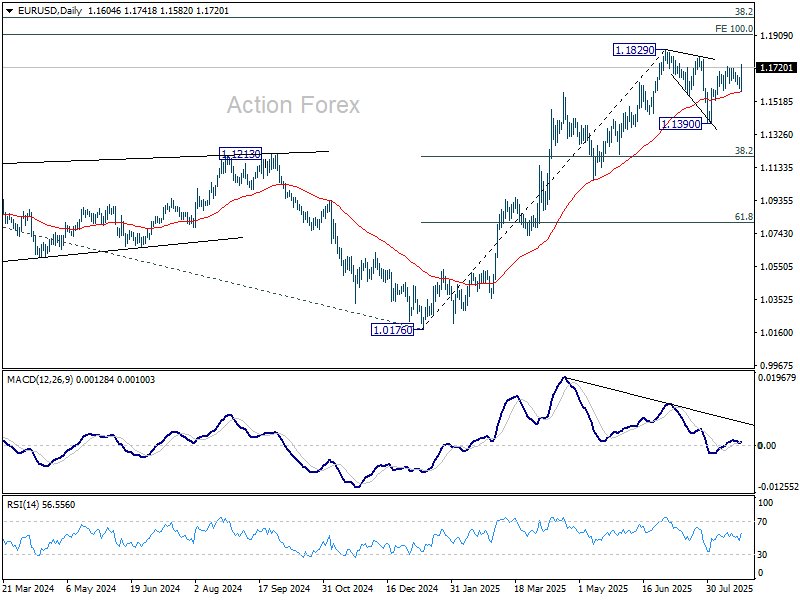
On break of 1.1829, EUR/USD will then be facing a key resistance zone at around 1.2, 38.2% retracement of 1.6039 (2008 high) to 0.9534 (2022 low) at 1.2019. Decisive break of 1.2 will bolster the case that EUR/USD is not just staging a cyclical rebound but is reversing a structural downtrend that has dominated for more than 15 years.
USD/CAD Weekly Outlook
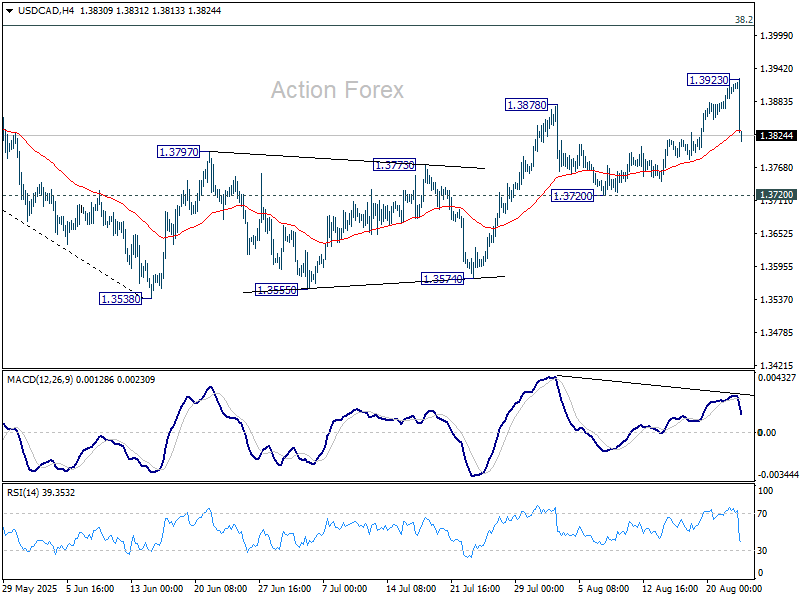
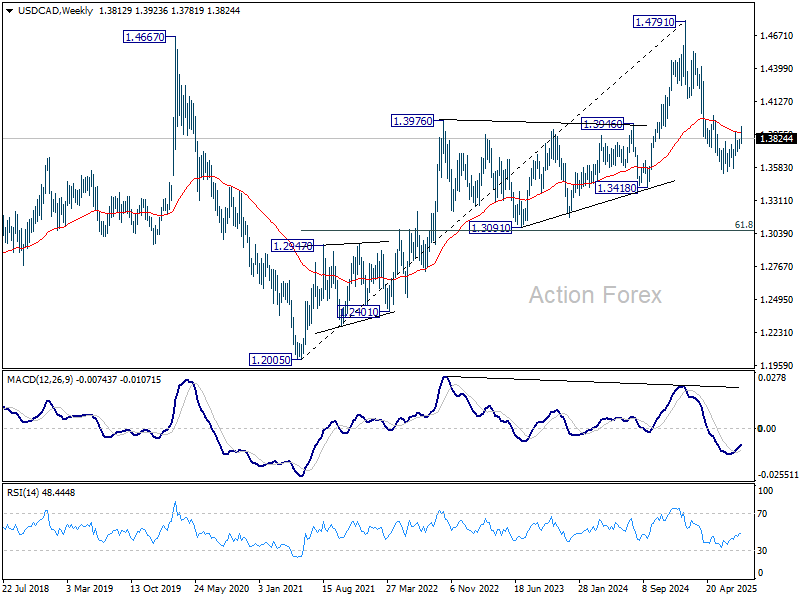
USD/CAD rose to 1.3923 last week but dived sharply from there. Initial bias is turned neutral this week first. Price actions from 1.3538 are seen as a corrective pattern. As long as 1.3720 support holds, another rise could still be seen. However, upside should be limited by 1.4014 cluster resistance (38.2% retracement of 1.4791 to 1.3538 at 1.4017). Meanwhile, firm break of 1.3720 will argue that the corrective bounce has already completed, and bring retest of 1.3538 low.
In the bigger picture, price actions from 1.4791 medium term top could either be a correction to rise from 1.2005 (2021 low), or trend reversal. In either case, further decline is expected as long as 1.4014 resistance holds. Next target is 61.8% retracement of 1.2005 (2021 low) to 1.4791 at 1.3069.
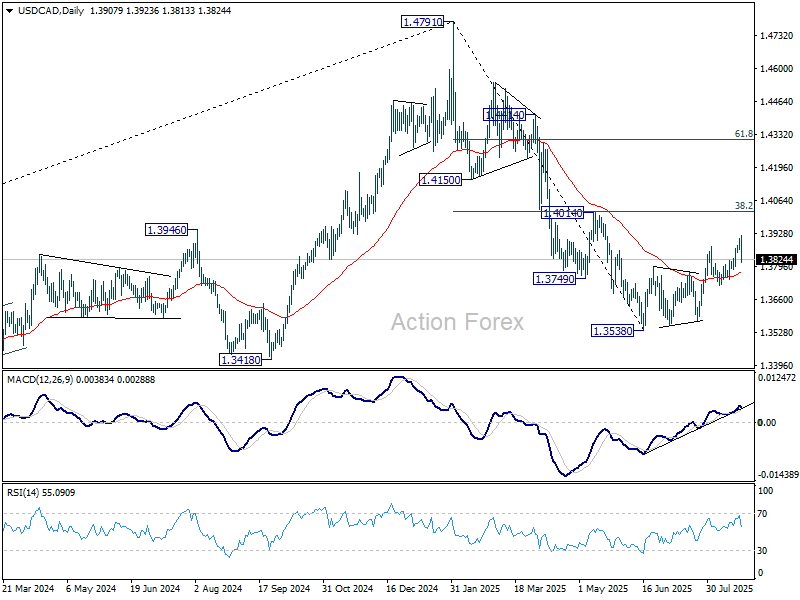
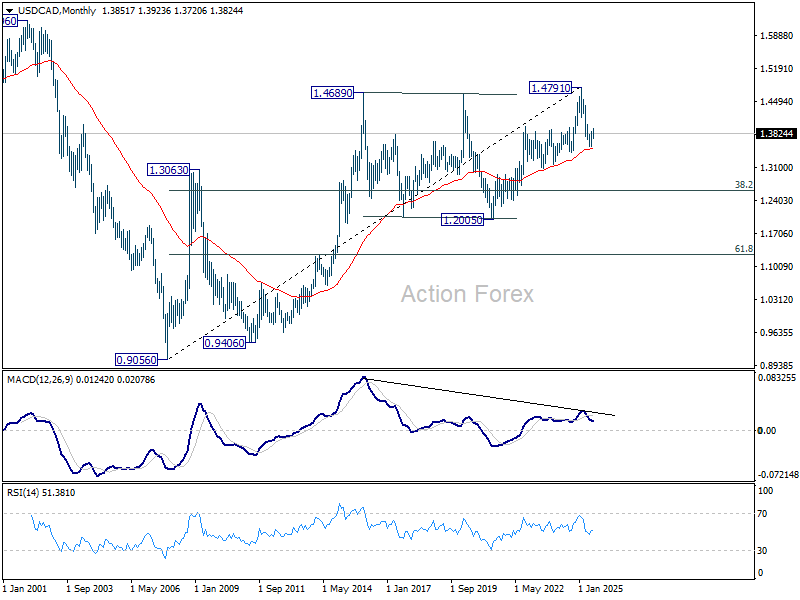
In the long term picture, as long as 55 M EMA (now at 1.3514) holds, up trend from 0.9056 (2007 low) should still resume through 1.4791 at a later stage. However, sustained trading below 55 M EMA will argue that the up trend has already completed, with rise from 1.2005 to 1.4791 as the fifth wave. 1.4791 would then be seen as a long term top and deeper medium term down trend should then follow.
EUR/USD Weekly Outlook
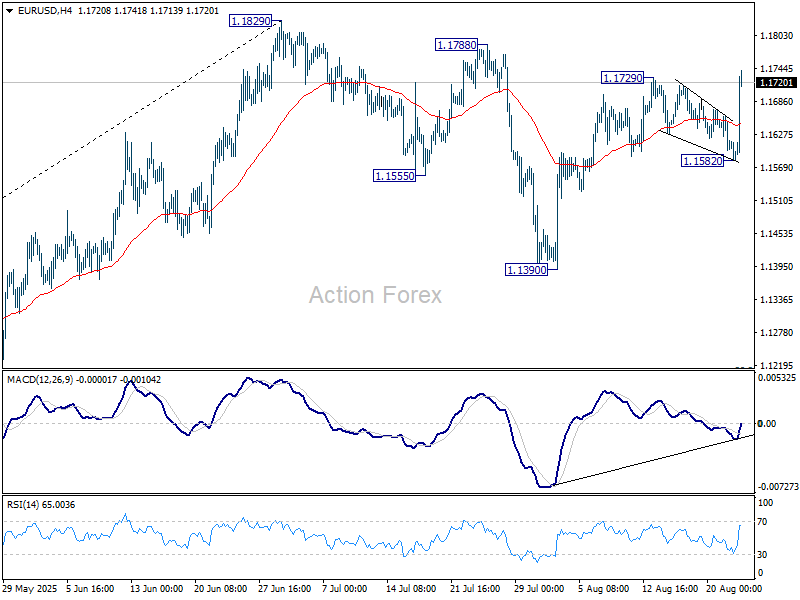
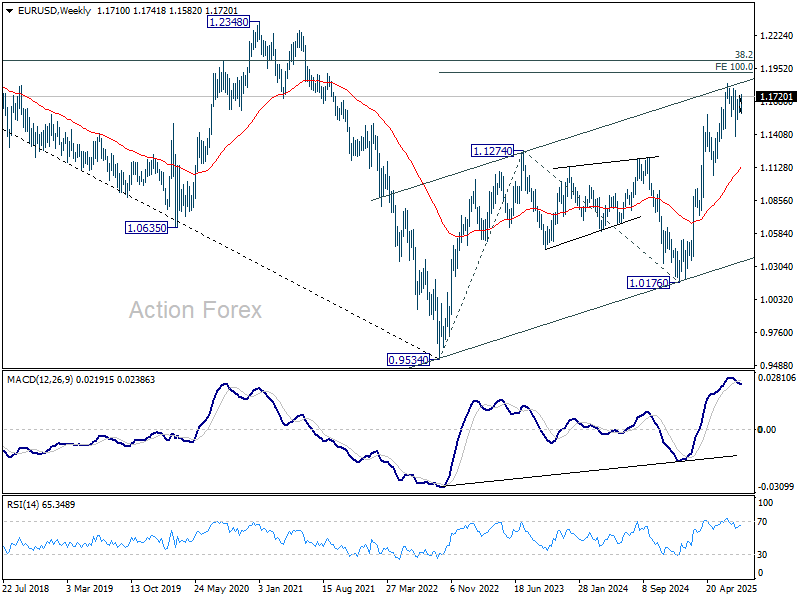
EUR/USD gyrated lower to 1.1582 last week but rebounded strongly from there. Late breach of 1.1729 resistance suggests that rise from 1.1390 is resuming. Initial bias is now on the upside this week for retesting 1.1819 high first. Firm break there will resume larger up trend. For now, risk will stay on the upside as long as 1.1582 support holds, in case of retreat.
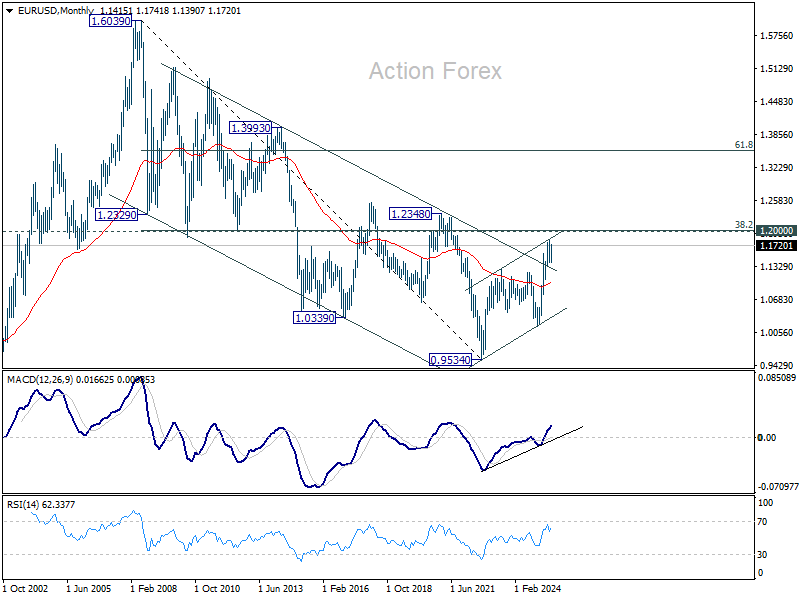
In the bigger picture, rise from 0.9534 long term bottom could be correcting the multi-decade downtrend or the start of a long term up trend. In either case, further rise should be seen to 100% projection of 0.9534 to 1.1274 from 1.0176 at 1.1916. This will remain the favored case as long as 1.1604 support holds.
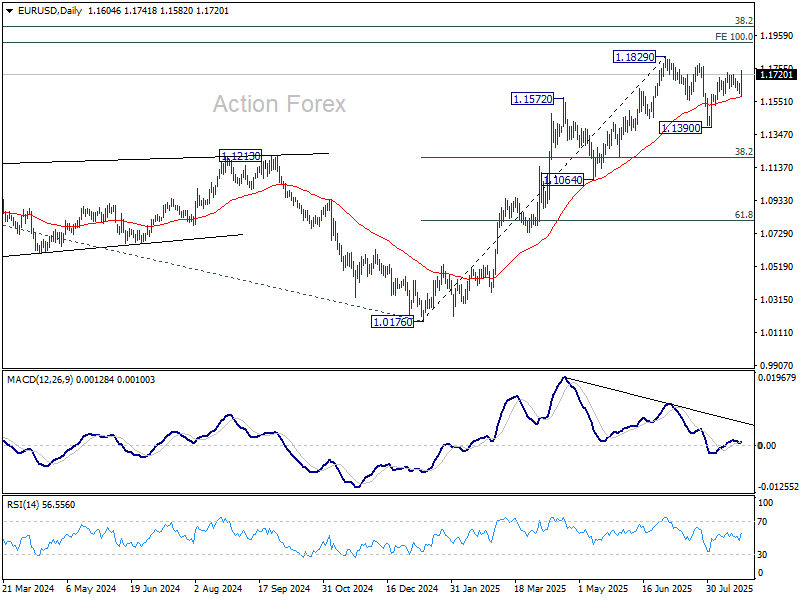
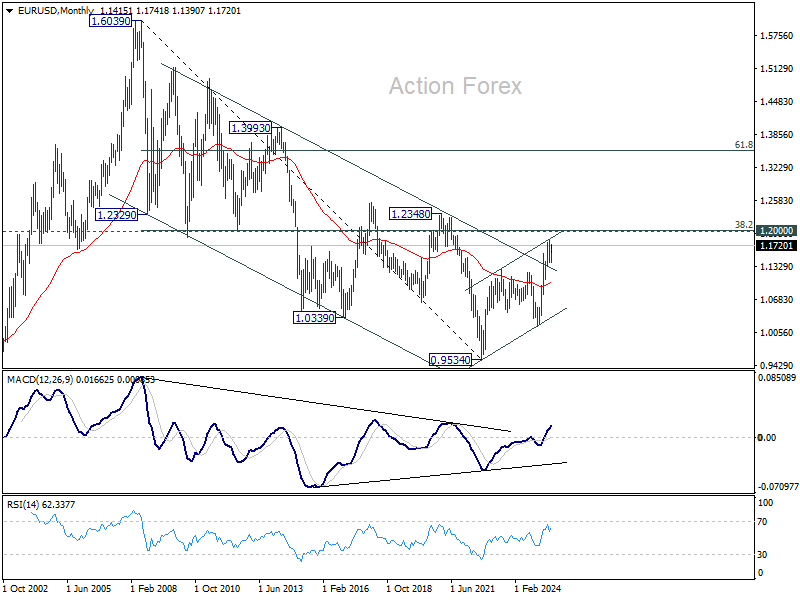
In the long term picture, a long term bottom was in place already at 0.9534, on bullish convergence condition in M MACD. Further rise should be seen to 38.2% retracement of 1.6039 to 0.9534 at 1.2019. Rejection by 1.2019 will keep the price actions from 0.9534 as a corrective pattern. But sustained break of 1.2019 will suggest long term bullish trend reversal, and target 61.8% retracement at 1.3554.
USD/JPY Weekly Outlook
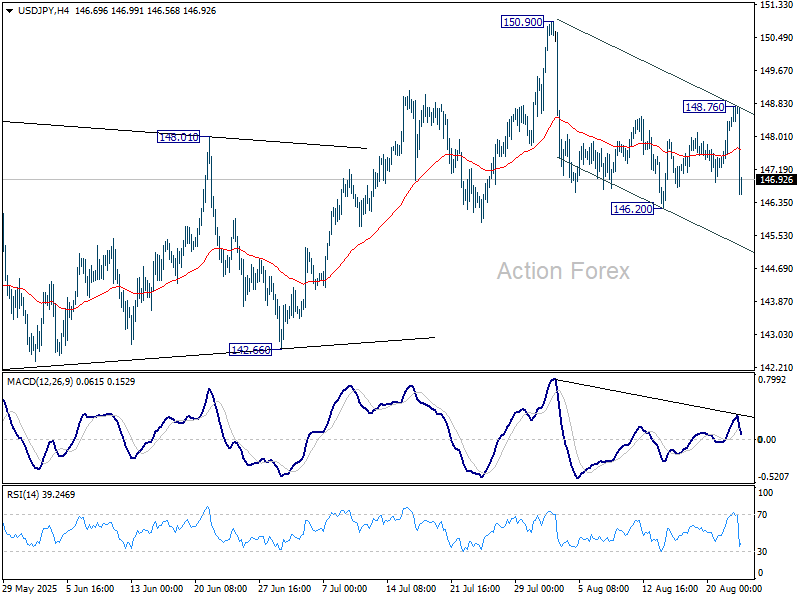
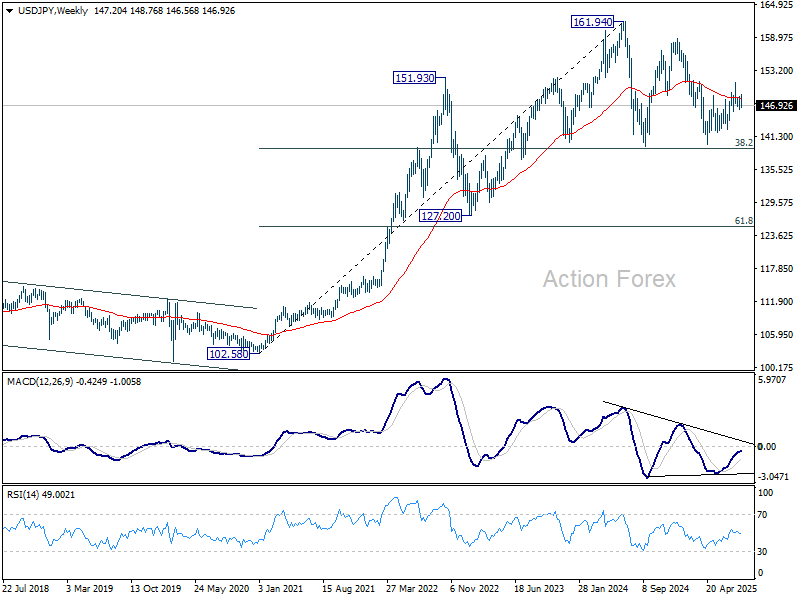
USD/JPY recovered to 148.76 last week and fell notably from there. Initial bias is turned neutral this week first. On the downside, firm break of 146.20 will resume the fall from 150.90. Also, that would argue that rebound from 139.87 has completed as a corrective move to 150.90. Deeper fall should be seen to 142.667 support for confirmation. On the upside, above 148.76 will bring another rise to retest 150.90 instead.
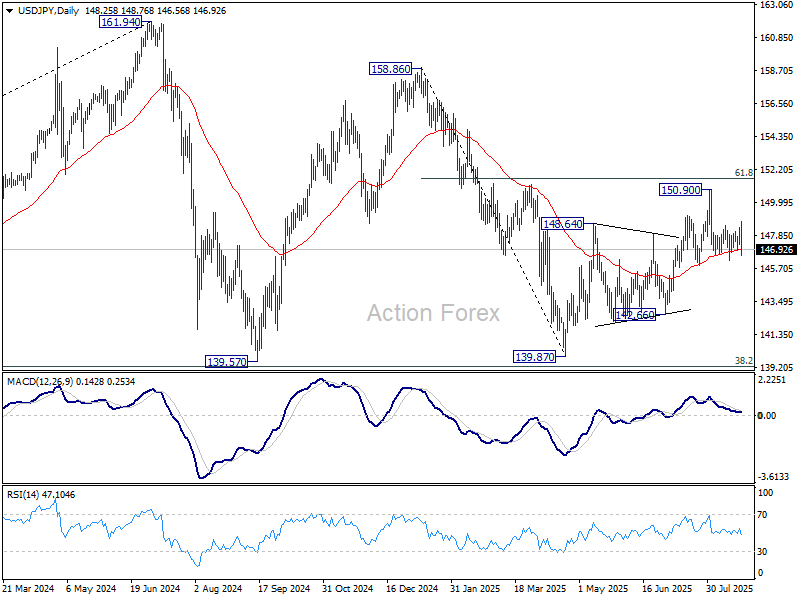
In the bigger picture, price actions from 161.94 (2024 high) are seen as a corrective pattern to rise from 102.58 (2021 low). Decisive break of 61.8% retracement of 158.86 to 139.87 at 151.22 will argue that it has already completed with three waves at 139.87. Larger up trend might then be ready to resume through 161.94 high. In case the corrective pattern extends with another fall, strong support is expected from 38.2% retracement of 102.58 to 161.94 at 139.26 to bring rebound.
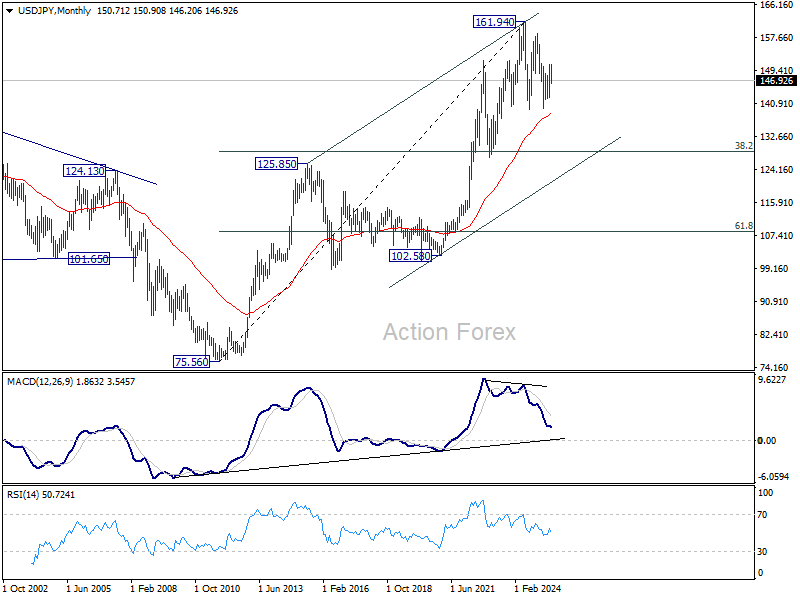
In the long term picture, there is no sign that up trend from 75.56 (2011 low) has completed. But then, firm break of 161.94 is needed to confirm resumption. Otherwise, more medium term range trading could still be seen.
GBP/USD Weekly Outlook
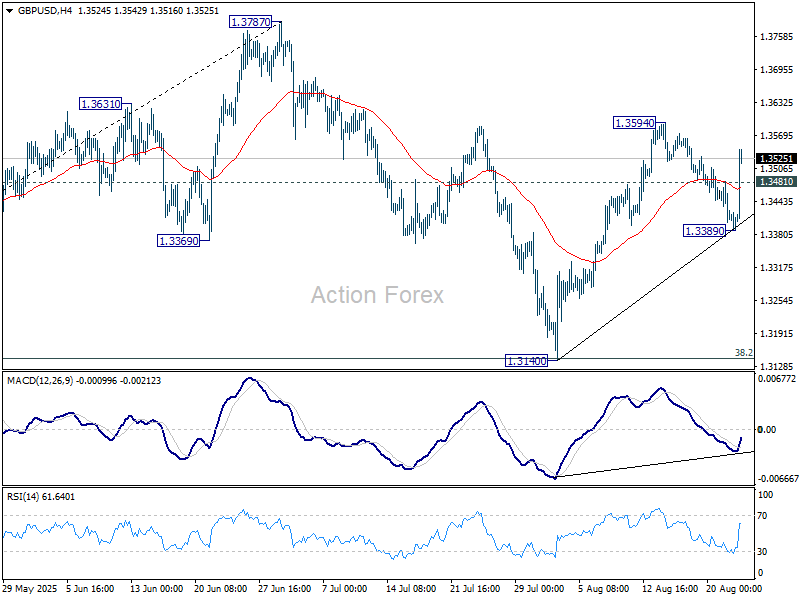
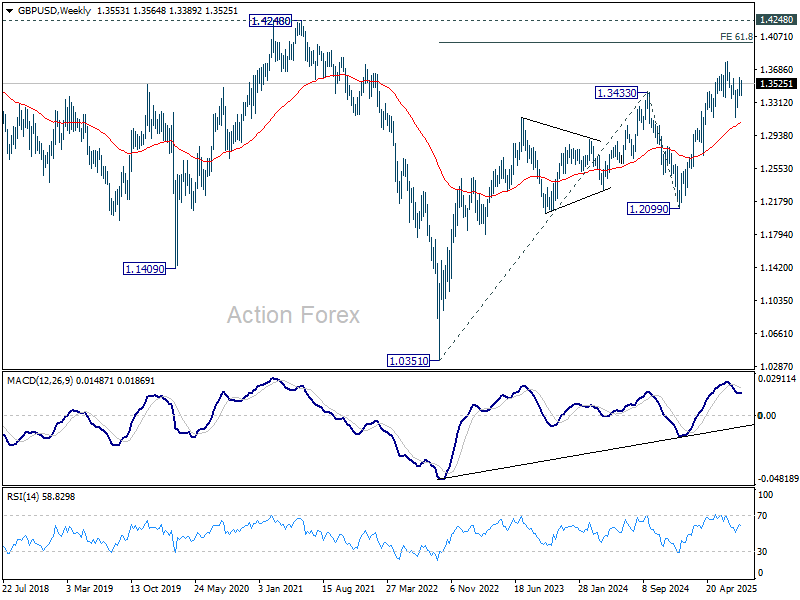
GBP/USD gyrated lower to 1.3389 last week but rebounded strongly from there. Initial bias remains neutral this week first. Break of 1.3594 will resume the rebound from 1.3140 to retest 1.3787 high. Firm break there will resume the larger up trend. For now, risk will stay on the upside as long as 1.3389 support holds, in case of retreat.
In the bigger picture, up trend from 1.3051 (2022 low) is in progress. Next medium term target is 61.8% projection of 1.0351 to 1.3433 from 1.2099 at 1.4004. Outlook will now stay bullish as long as 55 W EMA (now at 1.3073) holds, even in case of deep pullback.
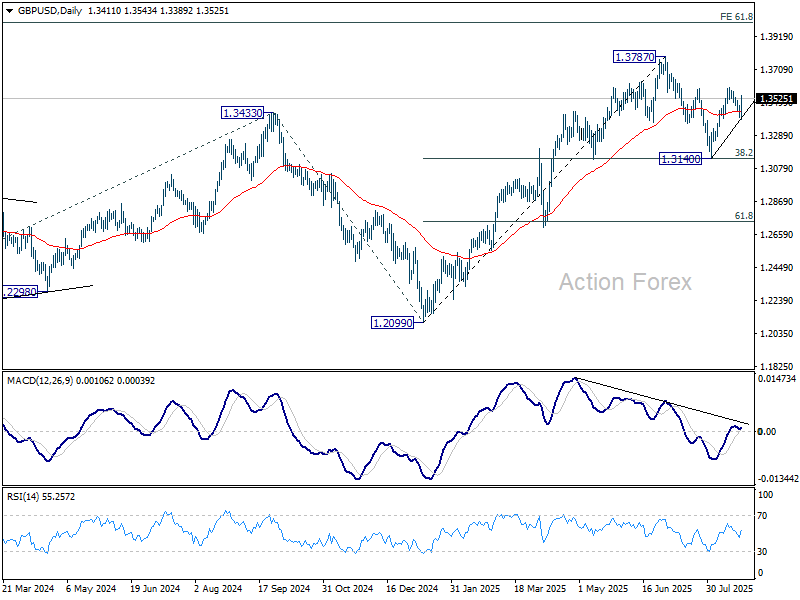
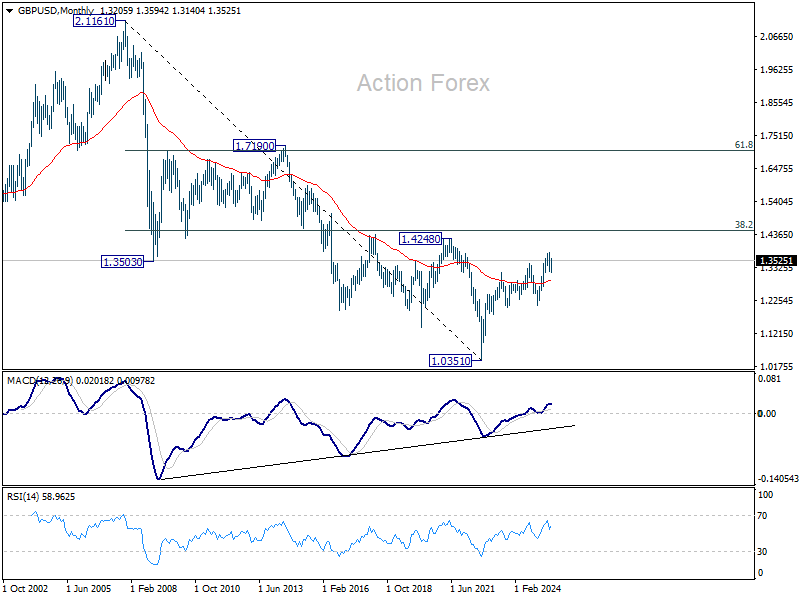
In the long term picture, for now, price actions from 1.0351 (2022 low) are still seen as a corrective pattern to the long term down trend from 2.1161 (2007 high) only. However, firm break of 1.4248 resistance (38.2% retracement of 2.1161 to 1.0351 at 1.4480) will be a strong sign of long term bullish reversal.
USD/CHF Weekly Outlook
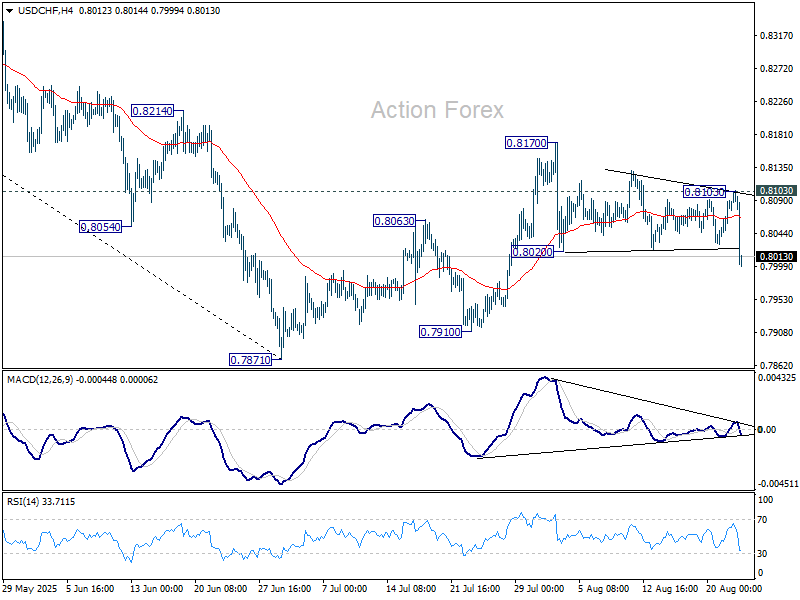
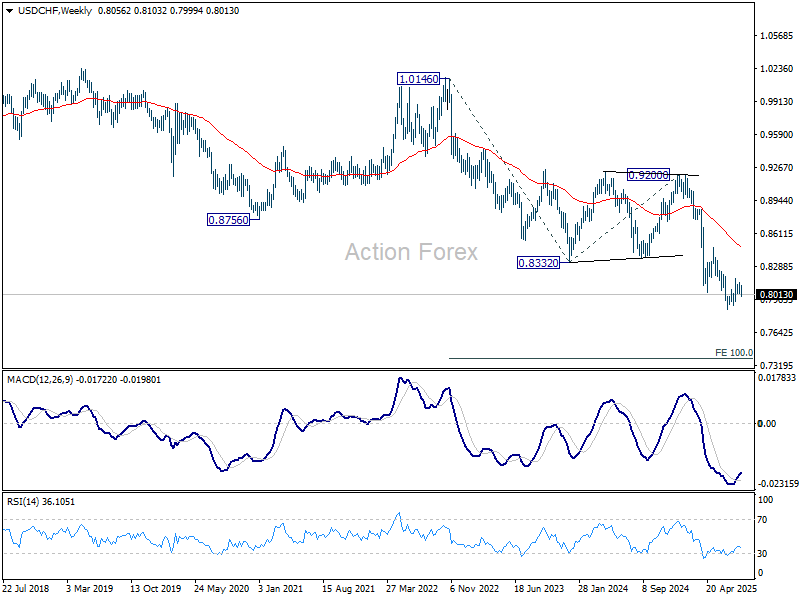
USD/CHF's late break of 0.8020 support suggests that corrective bounce from 0.7871 might have completed with three waves up to 0.8170 already. Initial bias is now on the downside this week for retesting 0.7871 low. Meanwhile, risk will stay on the downside as long as 0.8103 resistance holds, in case of recovery.
In the bigger picture, long term down trend from 1.0342 (2017 high) is still in progress. Next target is 100% projection of 1.0146 (2022 high) to 0.8332 from 0.9200 at 0.7382. In any case, outlook will stay bearish as long as 0.8475 resistance holds.
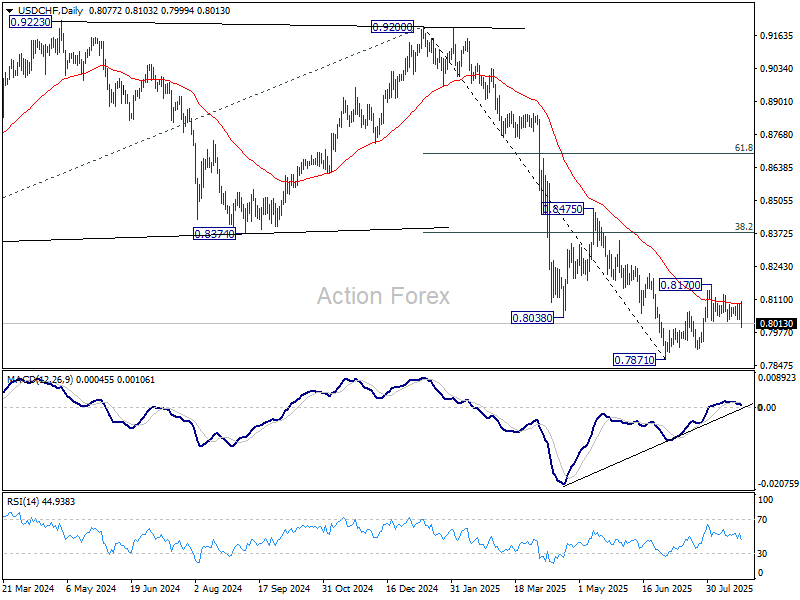
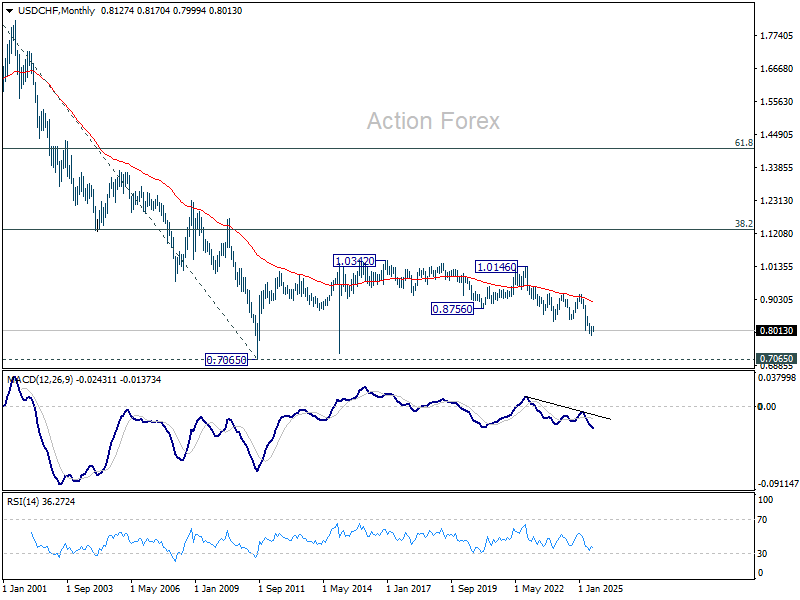
In the long term picture, price action from 0.7065 (2011 low) are seen as a corrective pattern to the multi-decade down trend from 1.8305 (2000 high). It's uncertain if the fall from 1.0342 is the second leg of the pattern, or resumption of the downtrend. But in either case, outlook will stay bearish as long as 0.9200 resistance holds. Retest of 0.7065 should be seen next.
AUD/USD Weekly Report
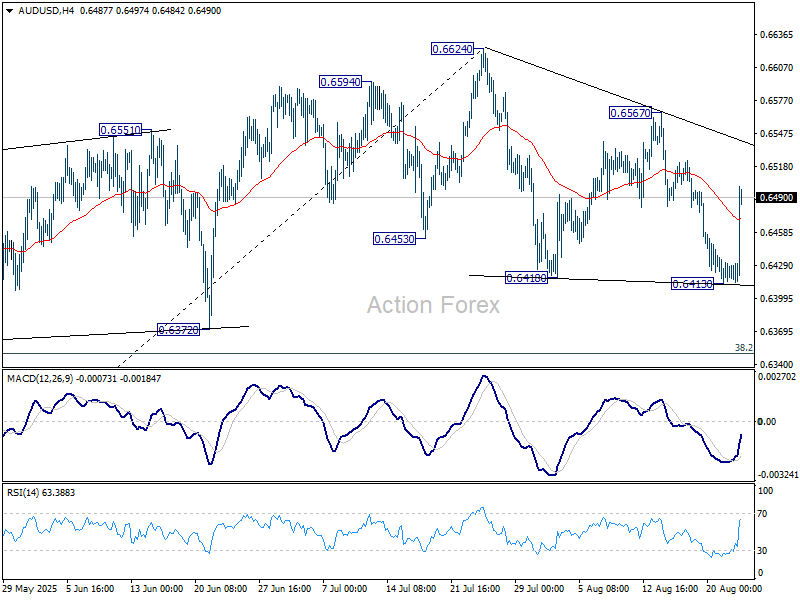
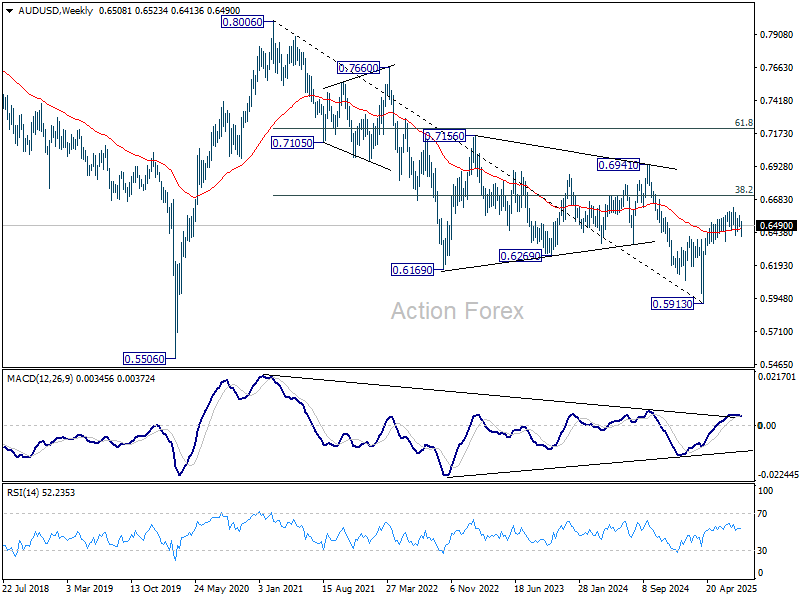
AUD/USD dived to 0.6413 last week but rebounded strongly from there. Initial bias is turned neutral this week first. Outlook is unchanged that price actions from 0.6624 are seen as a corrective pattern. On the downside, break of 0.6413 will extend the correction lower to 38.2% retracement of 0.5913 to 0.6624 at 0.6352. On the upside, though, firm break of 0.6567 will suggest that correction has completed and bring retest of 0.6624 high.
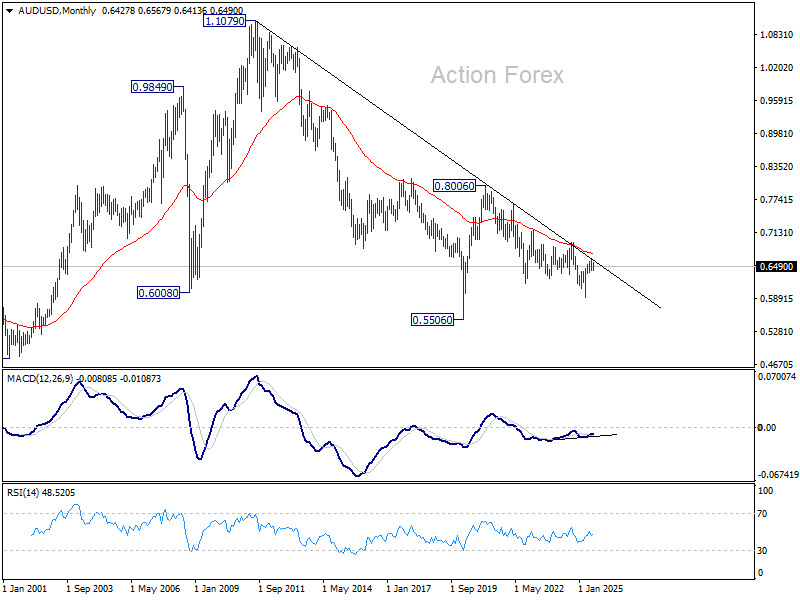
In the bigger picture, there is no clear sign that down trend from 0.8006 (2021 high) has completed. Rebound from 0.5913 is seen as a corrective move. While stronger rally cannot be ruled out, outlook will remain bearish as long as 38.2% retracement of 0.8006 to 0.5913 at 0.6713 holds. Nevertheless, considering bullish convergence condition in W MACD, even in case of another fall through 0.5913, downside should be contained above 0.5506 (2020 low).
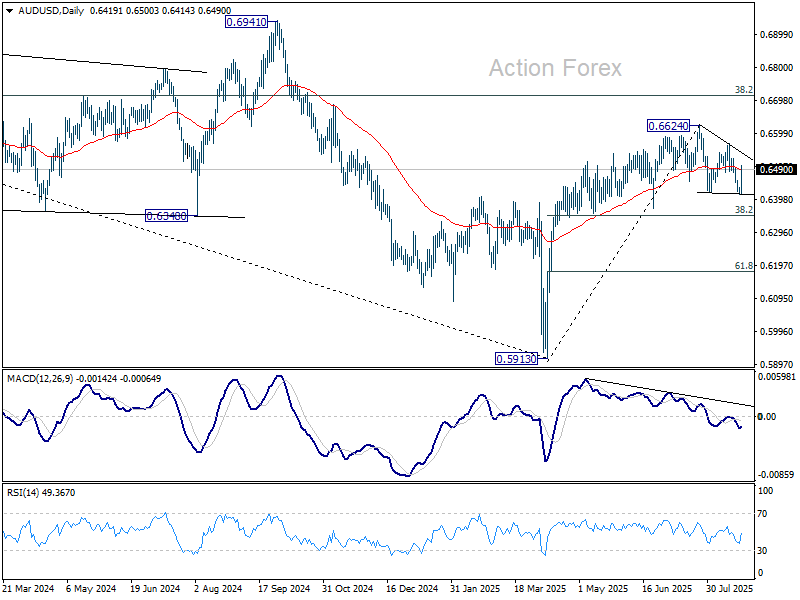
In the long term picture, fall from 0.8006 is seen as the second leg of the corrective pattern from 0.5506 long term bottom (2020 low). Hence, in case of deeper decline, strong support should emerge above 0.5506 to contain downside to bring reversal. On the upside, firm break of 0.6941 will argue that the third leg has already started back to 0.8006.
USD/CAD Weekly Outlook
USD/CAD rose to 1.3923 last week but dived sharply from there. Initial bias is turned neutral this week first. Price actions from 1.3538 are seen as a corrective pattern. As long as 1.3720 support holds, another rise could still be seen. However, upside should be limited by 1.4014 cluster resistance (38.2% retracement of 1.4791 to 1.3538 at 1.4017). Meanwhile, firm break of 1.3720 will argue that the corrective bounce has already completed, and bring retest of 1.3538 low.
In the bigger picture, price actions from 1.4791 medium term top could either be a correction to rise from 1.2005 (2021 low), or trend reversal. In either case, further decline is expected as long as 1.4014 resistance holds. Next target is 61.8% retracement of 1.2005 (2021 low) to 1.4791 at 1.3069.
In the long term picture, as long as 55 M EMA (now at 1.3514) holds, up trend from 0.9056 (2007 low) should still resume through 1.4791 at a later stage. However, sustained trading below 55 M EMA will argue that the up trend has already completed, with rise from 1.2005 to 1.4791 as the fifth wave. 1.4791 would then be seen as a long term top and deeper medium term down trend should then follow.
GBP/JPY Weekly Outlook
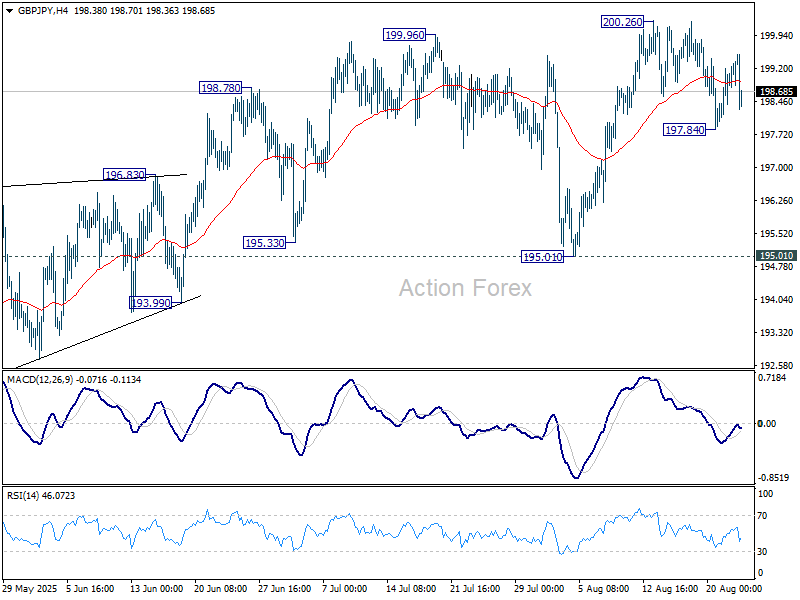
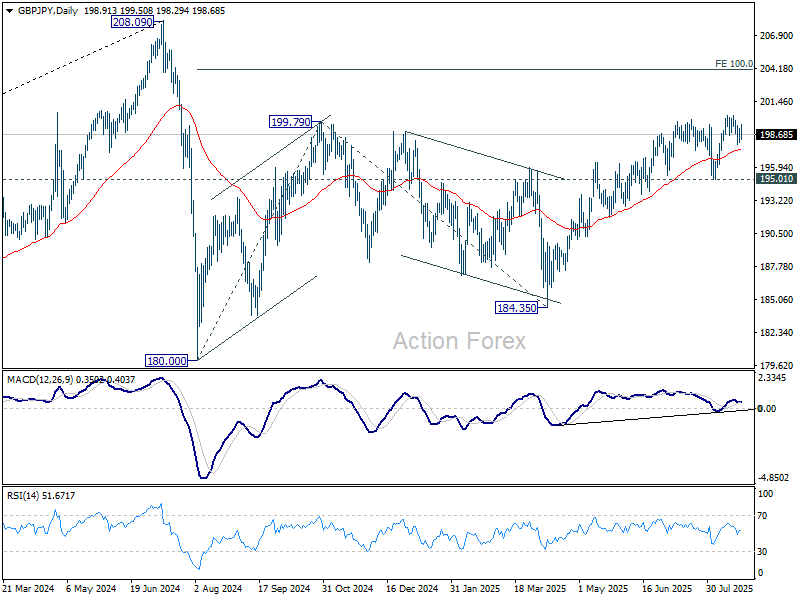
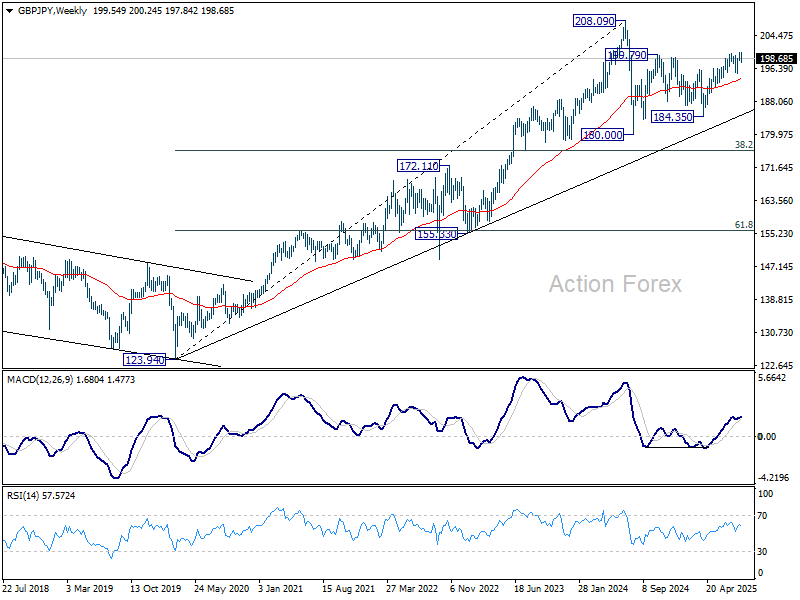
GBP/JPY's corrective pattern from 200.26 extended with a dip to 197.84 last week, but quickly recovered. Initial bias stays neutral this week first. While another fall cannot be ruled out, near term outlook will stay bullish as long as 195.01 support holds. On the upside, firm break of 2002.6 will resume the whole rise from 184.35 to 100% projection of 180.00 to 199.79 from 184.35 at 204.14.
In the bigger picture, price actions from 208.09 (2024 high) are seen as a correction to rally from 123.94 (2020 low). The pattern might still extend with another falling leg. But in that case, strong support should be seen from 38.2% retracement of 123.94 to 208.09 at 175.94 to contain downside. Meanwhile, decisive break of 208.09 will confirm long term up trend resumption.
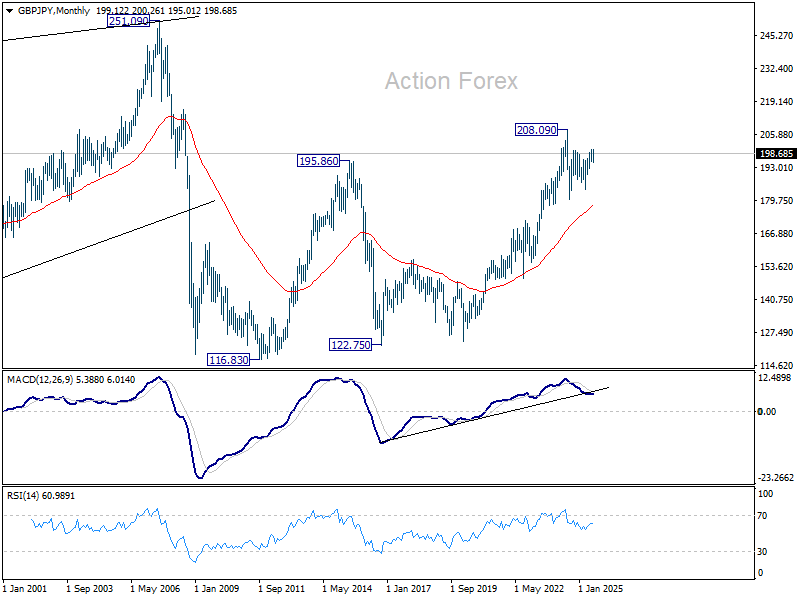
In the long term picture, there is no sign that the long term up trend from 122.75 (2016 low) has concluded. But firm break of 208.09 is needed to confirm resumption. Otherwise, more medium term range trading could still be seen.
EUR/JPY Weekly Outlook
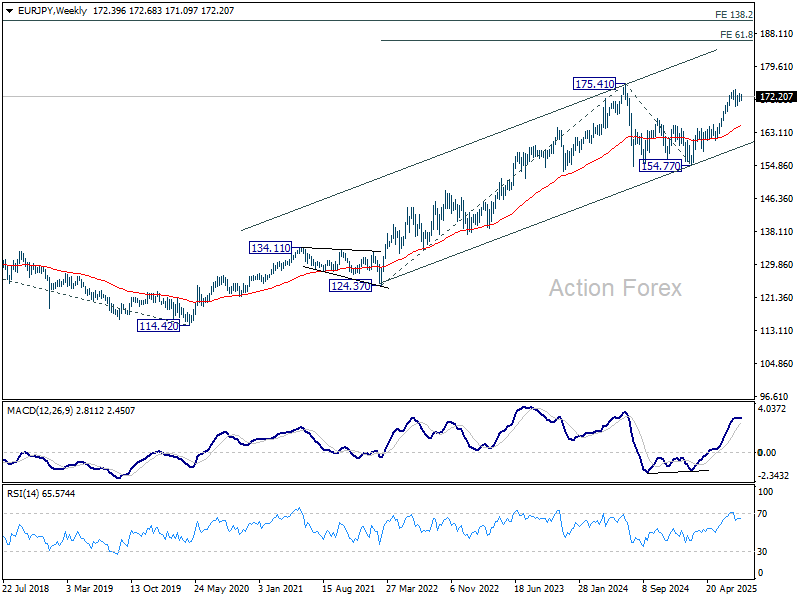
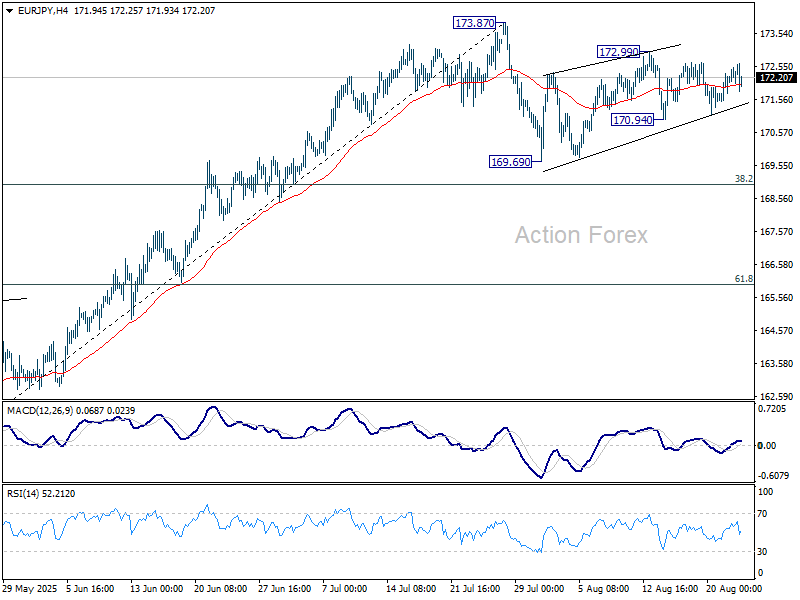
EUR/JPY gyrated in range below 172.99 last week and outlook is unchanged. Overall price actions from 173.87 are seen as a corrective pattern. On the downside, below 170.94 support will bring deeper fall to 169.69 and possibly below. But downside should be contained by 38.2% retracement of 161.06 to 173.87 at 168.97 to bring rebound. On the upside, above 172.99 will bring retest of 173.87.
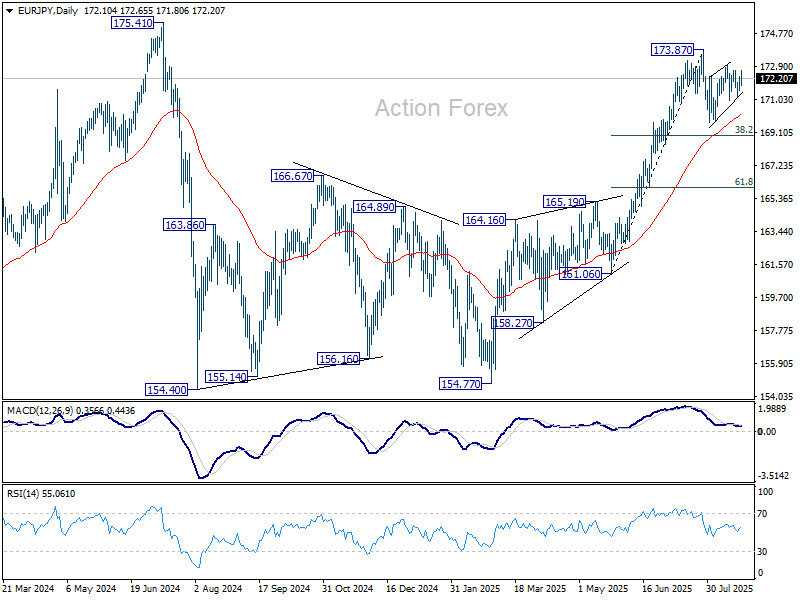
In the bigger picture, considering current strong momentum as seen in the rally from 154.77, corrective pattern from 175.41 could have already completed. Decisive break of 154.77 will confirm long term up trend resumption. Next target is 61.8% projection of 124.37 to 175.41 from 154.77 at 186.31. However, rejection by 175.41, followed by firm break of 55 D EMA (now at 170.15) will delay this bullish case.
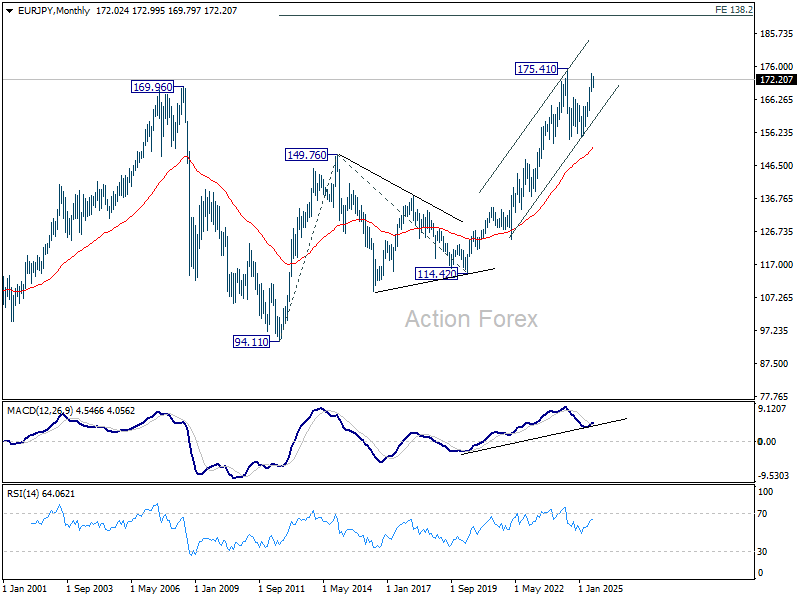
In the long term picture, up trend fro 94.11 (2021 low) is still in progress. On resumption, next target is 138.2% projection of 94.11 to 149.76 (2014 high) from 114.42 (2020 low) at 191.32.