
Sample Category Title
EUR/USD Daily Outlook
Daily Pivots: (S1) 1.1622; (P) 1.1683; (R1) 1.1782; More...
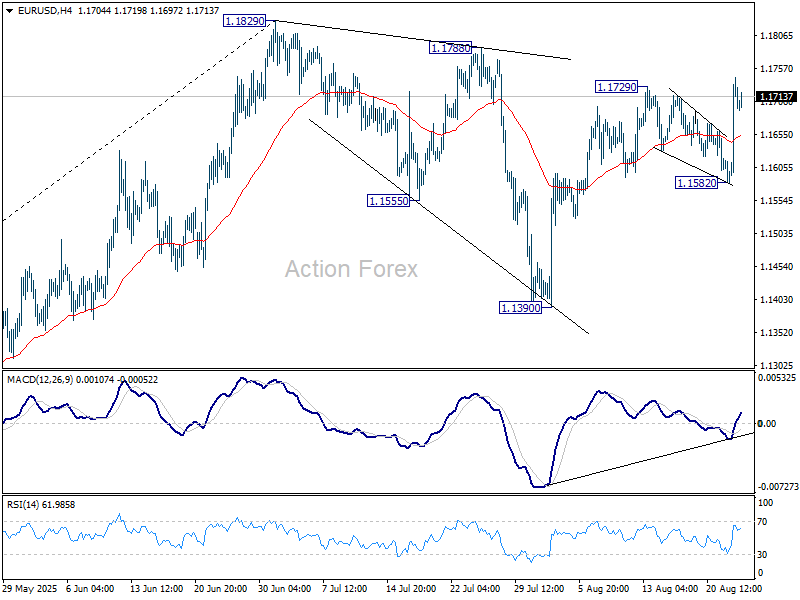
Intraday bias in EUR/USD remains on the upside as rise from 1.1390 is in progress. The corrective pattern from 1.1829 should have completed with three waves down to 1.1390. Further rally should be seen to retest 1.1829 high first. Firm break there will resume larger up trend. For now, risk will stay on the upside as long as 1.1582 support holds, in case of retreat.
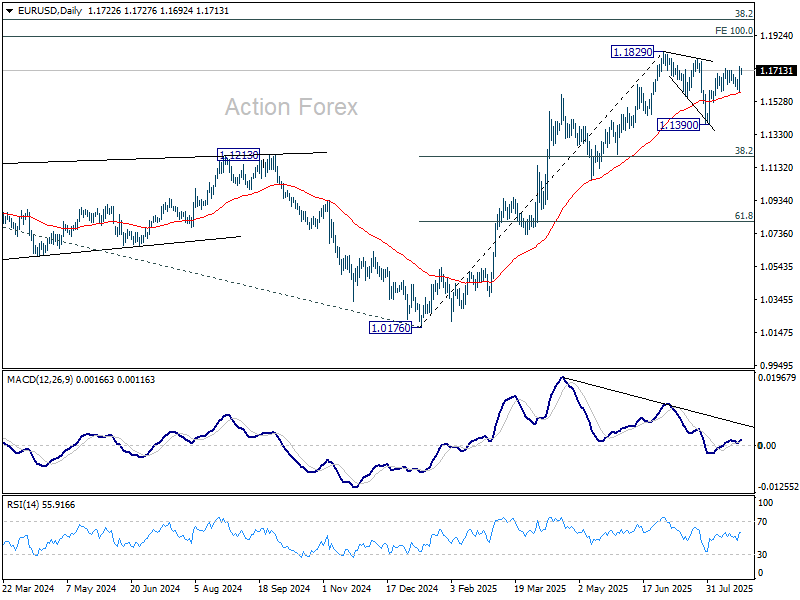
In the bigger picture, rise from 0.9534 long term bottom could be correcting the multi-decade downtrend or the start of a long term up trend. In either case, further rise should be seen to 100% projection of 0.9534 to 1.1274 from 1.0176 at 1.1916. This will remain the favored case as long as 1.1604 support holds.
USD/JPY Daily Outlook
Daily Pivots: (S1) 146.08; (P) 147.43; (R1) 148.28; More...
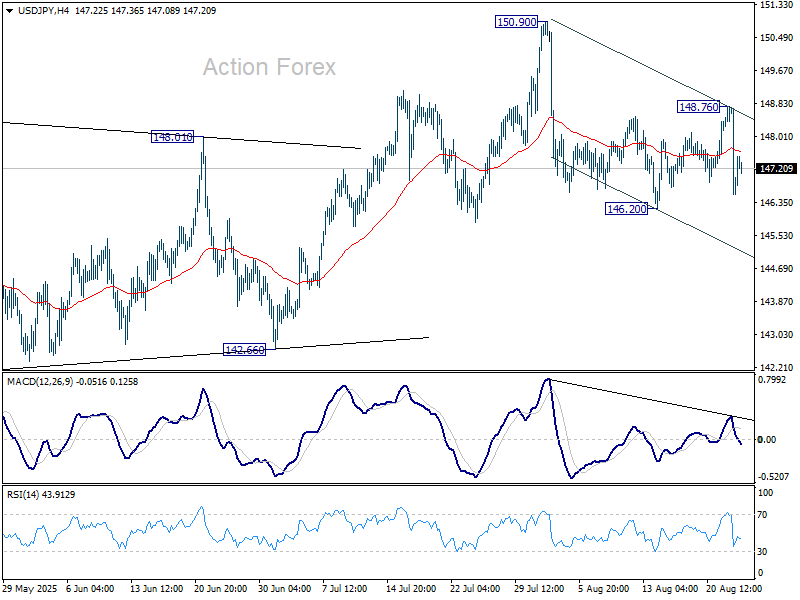
USD/JPY is staying in range above 146.20 support and intraday bias remains neutral. On the downside, firm break of 146.20 will resume the fall from 150.90. Also, that would argue that rebound from 139.87 has completed as a corrective move to 150.90. Deeper fall should be seen to 142.667 support for confirmation. On the upside, above 148.76 will bring another rise to retest 150.90 instead.
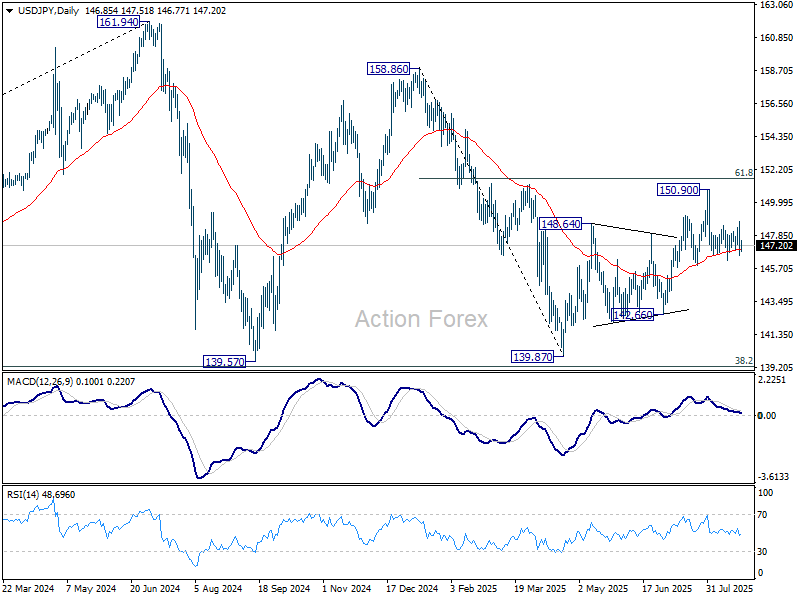
In the bigger picture, price actions from 161.94 (2024 high) are seen as a corrective pattern to rise from 102.58 (2021 low). Decisive break of 61.8% retracement of 158.86 to 139.87 at 151.22 will argue that it has already completed with three waves at 139.87. Larger up trend might then be ready to resume through 161.94 high. In case the corrective pattern extends with another fall, strong support is expected from 38.2% retracement of 102.58 to 161.94 at 139.26 to bring rebound.
GBP/USD Daily Outlook
Daily Pivots: (S1) 1.3431; (P) 1.3487; (R1) 1.3584; More...
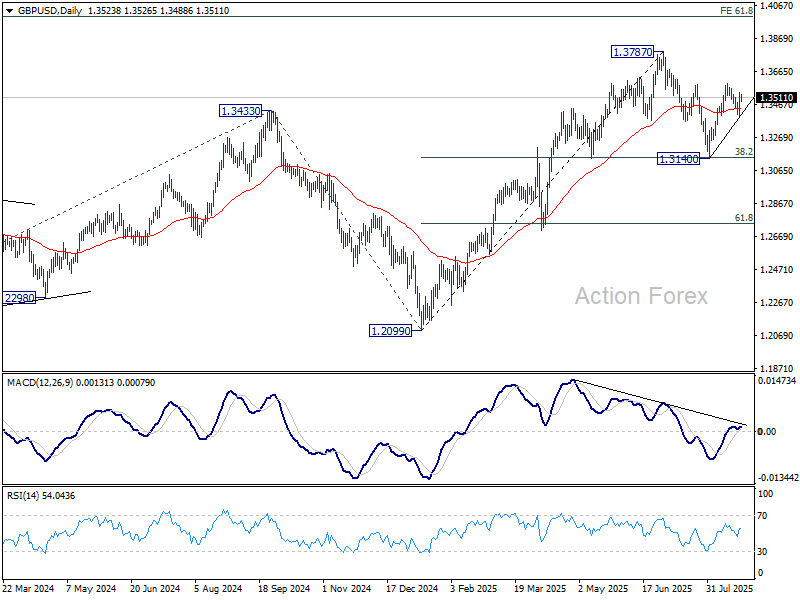
Intraday bias in GBP/USD remains neutral for the moment. Overall, price actions from 1.3787 high are seen as a corrective pattern. On the upside, break of 1.3594 will resume the rebound from 1.3140 to retest 1.3787 high. Firm break there will resume the larger up trend. For now, risk will stay on the upside as long as 1.3389 support holds, in case of retreat.
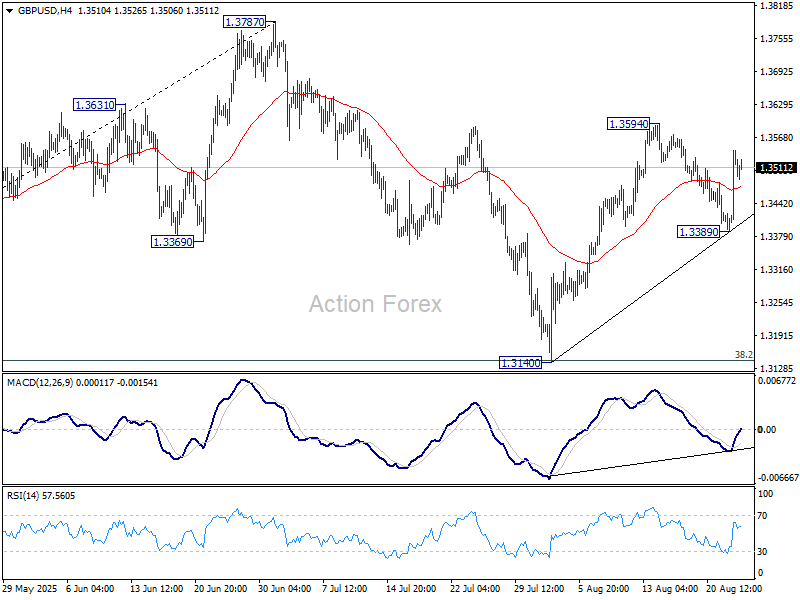
In the bigger picture, up trend from 1.3051 (2022 low) is in progress. Next medium term target is 61.8% projection of 1.0351 to 1.3433 from 1.2099 at 1.4004. Outlook will now stay bullish as long as 55 W EMA (now at 1.3073) holds, even in case of deep pullback.
USD/CHF Daily Outlook
Daily Pivots: (S1) 0.7976; (P) 0.8040; (R1) 0.8080; More….
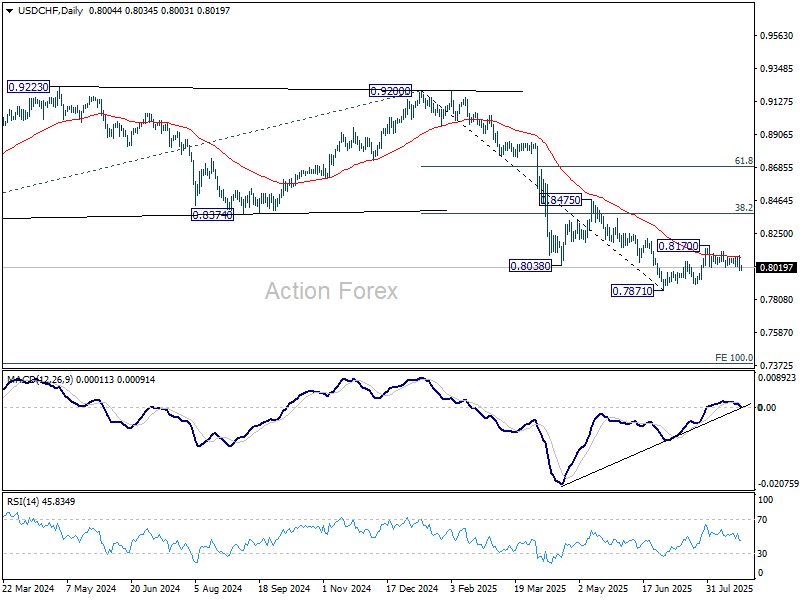
Intraday bias in USD/CHF stays mildly on the downside at this point. Corrective rebound from 0.7871 might have completed with three waves up to 0.8170 already. Deeper fall should be seen back to retest 0.7871 low. Meanwhile, risk will stay on the downside as long as 0.8103 resistance holds, in case of recovery.
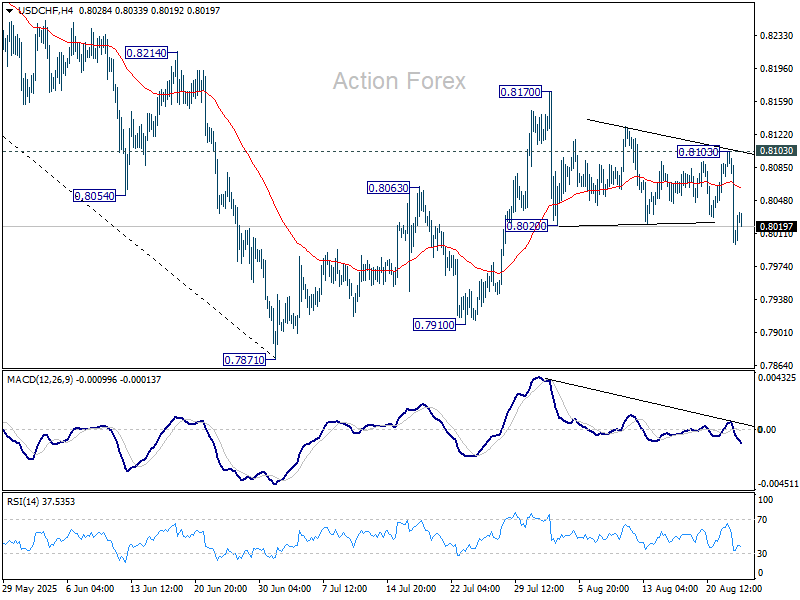
In the bigger picture, long term down trend from 1.0342 (2017 high) is still in progress. Next target is 100% projection of 1.0146 (2022 high) to 0.8332 from 0.9200 at 0.7382. In any case, outlook will stay bearish as long as 0.8475 resistance holds.
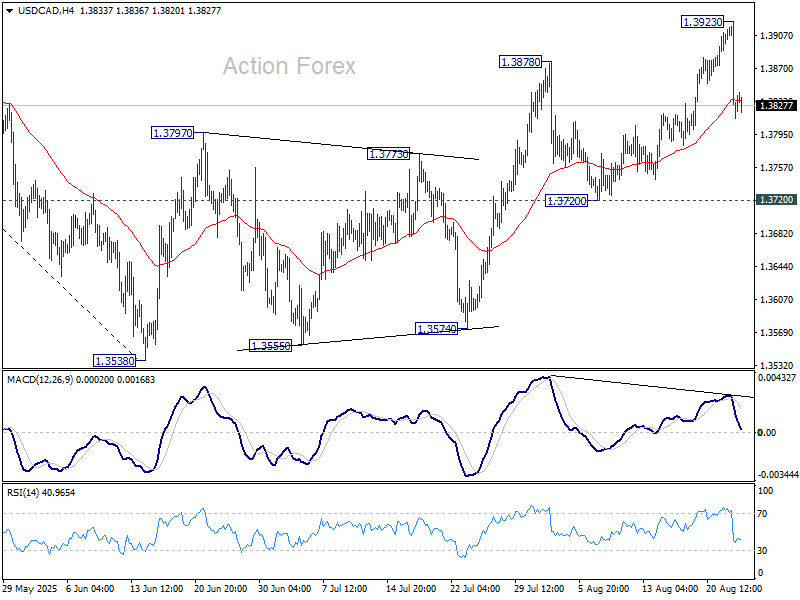
USD/CAD Daily Outlook
Daily Pivots: (S1) 1.3787; (P) 1.3856; (R1) 1.3897; More...
Intraday bias in USD/CAD remains neutral first. Price actions from 1.3538 are seen as a corrective pattern. As long as 1.3720 support holds, another rise could still be seen. However, upside should be limited by 1.4014 cluster resistance (38.2% retracement of 1.4791 to 1.3538 at 1.4017). Meanwhile, firm break of 1.3720 will argue that the corrective bounce has already completed, and bring retest of 1.3538 low.
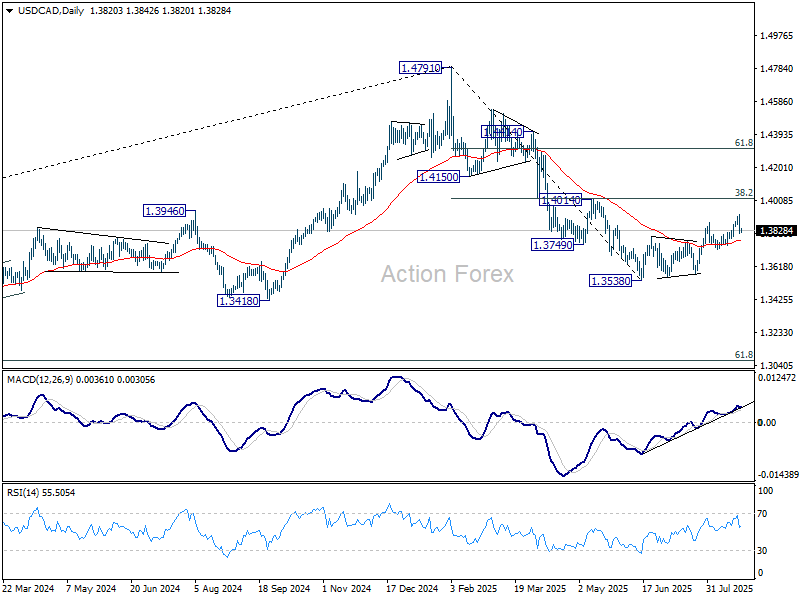
In the bigger picture, price actions from 1.4791 medium term top could either be a correction to rise from 1.2005 (2021 low), or trend reversal. In either case, further decline is expected as long as 1.4014 resistance holds. Next target is 61.8% retracement of 1.2005 (2021 low) to 1.4791 at 1.3069.
Loss of Interest Rates Support Propelled EUR/USD, But Still Within This Summer’s Trading Range
Markets
Fed chair Powell ignited a bond and stock market rally last Friday by saying in his key Jackson Hole speech that downside risks to employment are rising. “With policy in restrictive territory, the baseline outlook and the shifting balance may warrant adjusting our policy stance.” The Fed chair gives the nod for a cautious September rate cut (25 bps). His tone was more subtle than last year around when Powell’s “the time has come for policy to adjust” and “the direction of travel is clear” resulted in a 50 bps opening rate cut and a cumulative effort of 100 bps in Q4 2024. Powell’s main arguments echo the ones put forward by one of the two dissenters at the July FOMC meeting, Waller. The Fed chair is puzzled by the curious state of the US labour market: low in demand and low in supply, keeping the unemployment rate stable. Once firms shift from labour hoarding to lay-offs, the labour market could deteriorate quickly. If this assumption of underlying weakness is correct, Powell argues that second-round inflation effects coming from higher US tariffs can be avoided as employees are not in the position to demand for compensating higher wages. Tariffs would in such scenario effectively result in a one-off increase in prices instead of creating lasting inflationary pressures. Powell in his final Jackson Hole appearance also shared conclusions from the central bank’s monetary policy framework review. First, the Fed reviewed language indicating that the effective lower bound (0%) was a defining feature of the economic landscape. Second, the Fed switched back to a flexible inflation target instead of the average inflation targeting strategy, allowing for longer deviations from the 2% target to “make up” for periods of deviations at the other side of the 2%. In the current set-up, this suggests a slightly more restrictive monetary policy in the longer run. Other smaller changes included a clarification to the Fed’s reaction function when the ideal response is not complementary with the employment and inflation objectives. That’s the situation the US central bank is in right now. The Fed will then take into account the extent of departures from its goals and the potentially different time horizons over which each is projected to return to a level consistent with the dual mandate.
The US yield curve bull steepened with yields dropping by 4.2 bps (30-yr) to 10.1 bps (3-yr) to Powell’s pivot. The implied probability of a September rate cut increased from around 70% to 85%. Disappointing US labour market data or absence of more pronounced inflationary pressures can still move the needle on US money markets for the remainder of the year with the base scenario currently being a skip in October and another 25 bps rate cut in December. US Treasuries obviously outperformed German Bunds. Changes on the German curve range between -1.8 bps (30-yr) and -3.8 bps (5-yr). Loss of interest rates support propelled EUR/USD from 1.1606 to 1.1718, but still within this summer’s trading range (1.1392-1.1829). The current set-up increases the probability of a topside test. US stock markets rallied 1.5% to 1.9% last Friday, making up for lost ground earlier that week. Today’s eco calendar is thin with German Ifo business sentiment and a Belgian OLO auction the only things to watch. Trading volumes will be low during European trading hours with UK markets closed (Summer Bank Holiday).
News & Views
Canadian PM Carney on Friday announced that his government will remove retaliatory import tariffs on US goods that are covered under the US-Mexico-Canada free trade agreement (USMCA). The move came as the US recently also indicated that it didn’t intend to impose tariffs on goods that were compliant with the USMCA. In this respect, Cananda from September 1st will no longer impose a 25% tax on many US consumer products. At the same time, Cananda will maintain a 25% import tax on US steel and aluminum products as well as on US cars and trucks. The milder approach of the Canadian government comes as both countries will start preparations on a new trade agreement as the USMCA trade deal will come up for review next year. Carney also indicated "Canada and the U.S. have now re-established free trade for the vast majority of our goods," and said that Canadian exports overall are still subject to a low level of US tariffs, compared with other trading partners.
AUD/USD Daily Report
Daily Pivots: (S1) 0.6438; (P) 0.6469; (R1) 0.6524; More...
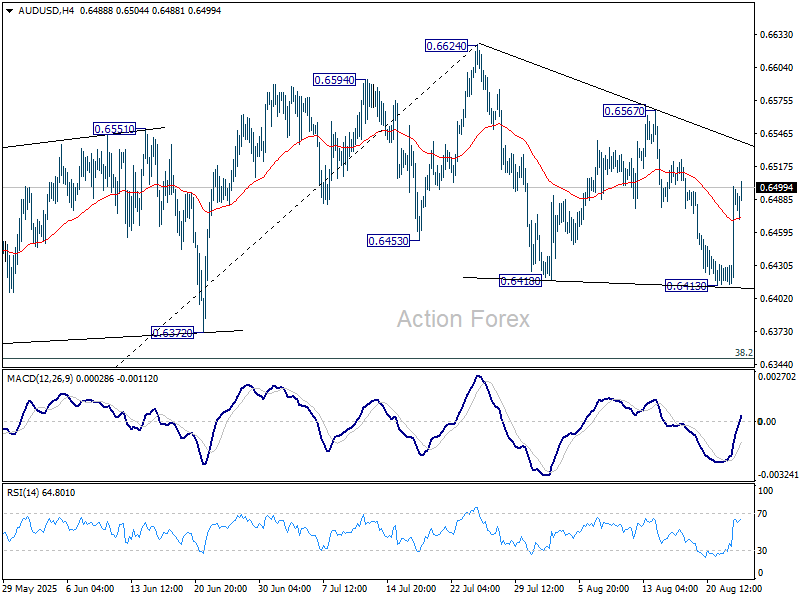
AUD/USD extends the rebound from 0.6413 but stays well below 0.6567 resistance. Intraday bias remains neutral first. Corrective pattern from 0.6624 could extend further sideway. On the upside, firm break of 0.6567 will argue that the correction has completed and bring retest of 0.6624 high. However, break of 0.6413 will extend the correction lower towards 38.2% retracement of 0.5913 to 0.6624 at 0.6352.
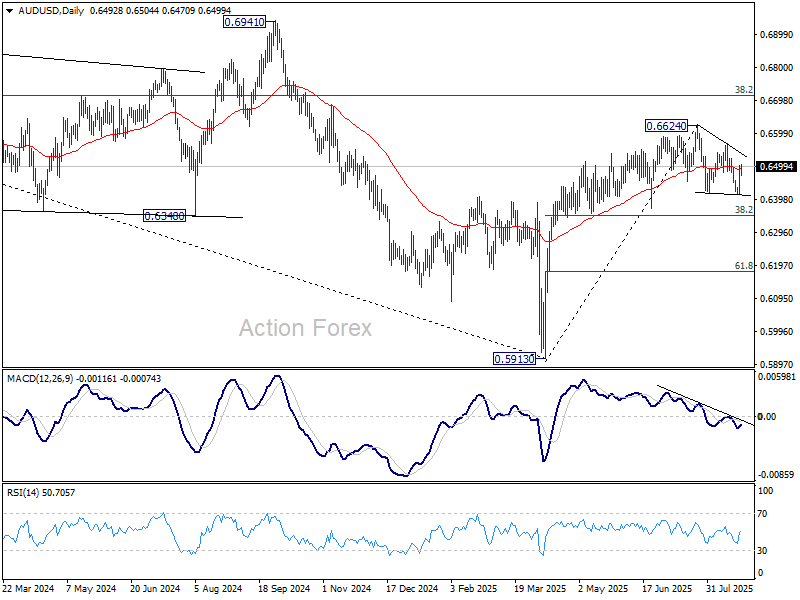
In the bigger picture, there is no clear sign that down trend from 0.8006 (2021 high) has completed. Rebound from 0.5913 is seen as a corrective move. While stronger rally cannot be ruled out, outlook will remain bearish as long as 38.2% retracement of 0.8006 to 0.5913 at 0.6713 holds. Nevertheless, considering bullish convergence condition in W MACD, even in case of another fall through 0.5913, downside should be contained above 0.5506 (2020 low).
Risk-On Tone Lifts Aussie, Pressures Yen and Franc
Asian investors kicked off the week on a positive note, with equities advancing after Fed Chair Jerome Powell struck a dovish tone at Jackson Hole. Gains were particularly strong in Hong Kong, though most regional markets saw upward momentum, reflecting belief that the Fed appears ready to ease again soon.
Still, market expectations have essentially reverted to where they stood before last week’s volatility. Fed fund futures are currently pricing an 87% probability of a September rate cut. Odds of a follow-up move in October stand at just 42%, while December is seen carrying more than an 80% chance of another cut.
Taken together, traders now see a high probability of two rate cuts this year—precisely the scenario already sketched out in the Fed’s June dot plot. In that sense, Powell’s speech has not materially shifted the outlook, but it has restored confidence that the central bank remains aligned with its own projections.
In currency trading, risk appetite is evident. Aussie is leading Kiwi and Loonie higher, while traditional havens—the Swiss Franc and Japanese Yen—are under pressure, followed by Euro. Sterling and Dollar sit mid-pack.
Looking ahead, the data calendar is relatively light this week. U.S. PCE inflation, Japan’s Tokyo CPI, and other price reports will offer some direction but are unlikely to shift expectations for September. The real test comes next week, when U.S. nonfarm payrolls are released. That will be the key input, alongside CPI on September 11, for the Fed’s policy decision at the September 16–17 meeting. Until then, markets may continue to trade on sentiment rather than fresh conviction.
In Asia, Nikkei rose 0.37%. Hong Kong HSI is up 2.06%. China Shanghai SSE is up 0.95%. Singapore Strait Times is up 0.17%. Japan 10-year JGB yield is flat at 1.619.
ECB's Lagarde highlights migrant labor as key Eurozone growth support
At Jackson Hole on Saturday, ECB President Christine Lagarde credited foreign workers with playing a vital role in supporting the eurozone economy. She said migration inflows have helped counterbalance reduced working hours and weaker living standards, providing stability during a period of subdued real wage growth.
Lagarde pointed out that although foreign workers represented just 9% of the bloc’s labor force in 2022, they contributed fully half of its growth over the previous three years. "Without this contribution, labor market conditions could be tighter and output lower," she added.
BoE's Bailey cites falling labor participation rate as UK’s “sad story”
BoE Governor Andrew Bailey warned at Jackson Hole on Saturday that the UK faces an “acute challenge” of weak underlying growth compounded by reduced Labor force participation. He stressed that with ageing demographics unlikely to reverse, raising productivity growth must become a priority to offset the economy’s structural drag.
Bailey said the BoE has shifted its focus from long-term unemployment trends to participation rates, noting that the proportion of working-age Britons active in the Labor market remains lower than before the pandemic, unlike in most advanced economies. While he cautioned that survey data contains caveats, he argued they do not fully explain the shortfall.
Calling it a “pretty sad story for the UK,” Bailey said diminished participation leaves the UK at the bottom of global rankings. This structural weakness is also feeding into inflation concerns, with some policymakers fearing that limited Labor supply is one reason why UK inflation, at 3.8% in July, remains the highest in the G7.
BoJ's Ueda sees tight labor market sustaining wage growth
BoJ Governor Kazuo Ueda told a Jackson Hole panel on Saturday that Japan’s labor shortages are becoming “one of our most pressing economic issues.” He highlighted that wage growth, once concentrated in large enterprises, is now spreading to smaller firms.
Ueda said that barring a major negative demand shock, "the labor market is expected to remain tight and continue to exert upward pressure on wages". He noted that the demographic shifts set in motion since the 1980s are now driving both "acute labor shortages and persistent upward pressure on wages"
According to Ueda, these shifts are forcing supply-side adjustments, including higher participation rates, greater labor mobility, and increased capital-labor substitution. He pledged the BoJ will "continue to monitor these developments closely and incorporate our assessment of evolving supply-side conditions into the conduct of monetary policy."
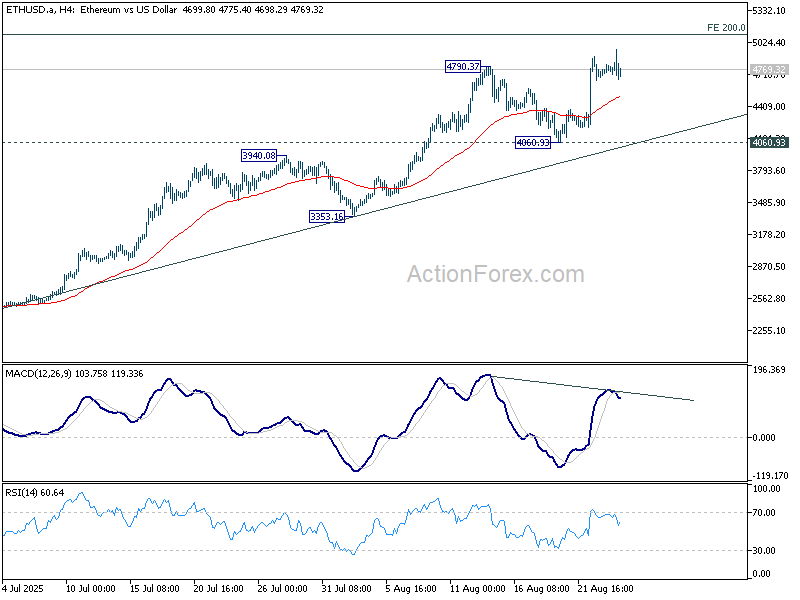
Exhausted Ethereum stalls below 5,000, risk of pullback builds
Ethereum briefly surged to a new record above 4,900 over the weekend but has struggled to sustain momentum just shy of the 5,000 psychological barrier. While ETH has outpaced Bitcoin in recent weeks on the view that BTC was overextended, momentum signals indicate Ethereum may now be equally exhausted.
Besides, historically, oversized weekend surges often retrace once liquidity returns early in the week. That dynamic, coupled with stretched momentum, leaves Ethereum exposed to a near-term correction.
Technically, while further rise cannot be ruled out yet, bearish divergence condition in 4H MACD suggests that Ethereum's upside will likely be capped by 200% projection of 1,382.55 to 2,879.27 from 2,110.58 at 5,104.02. This makes the 5,000–5,100 area a formidable resistance zone.
On the downside, firm break of 55 4H EMA (now at 4,508.16) will confirm short term topping. In this case, Ethereum should then be correcting the rise from 2,110.58, which is seen as the third leg of the whole up trend from 1,382.55. Deeper correction should be seen to 4,060.93 support, or even further to 55 D EMA (now at 3,806.63) before resuming the up trend again with the final leg.

As for Bitcoin, the break of 111,889 support suggests that it's already correcting the rise from 74,373. Near term risk will stay on the downside as long as 117,433 resistance holds. Deeper correction should be seen to 38.2% retracement of 74,373 to 124,553 at 105,384.
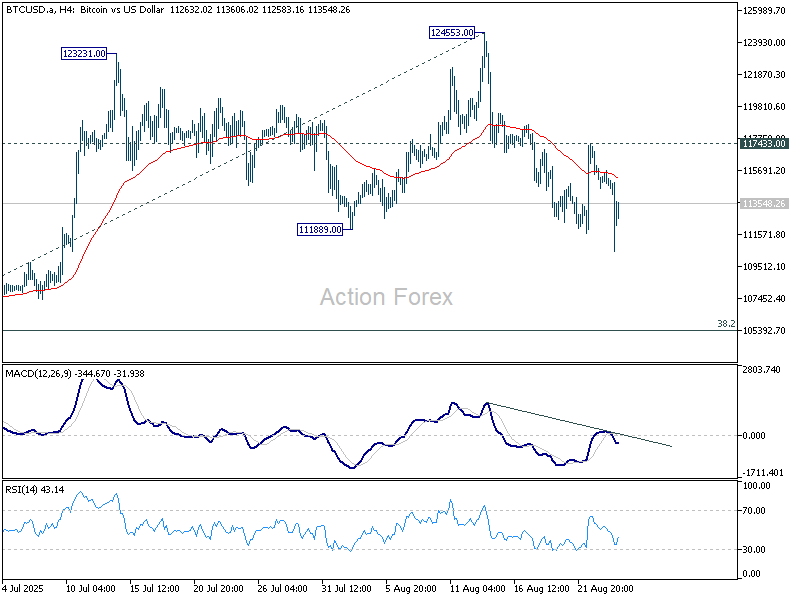
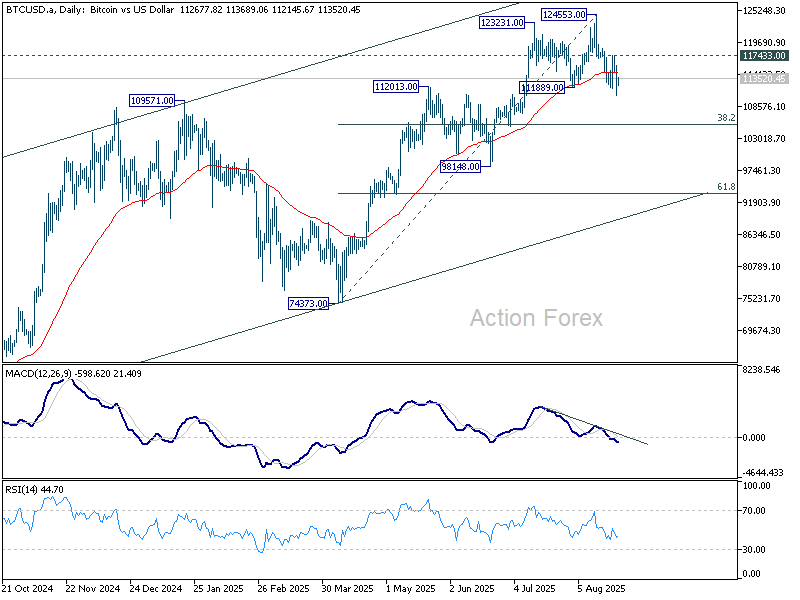
This leaves the near-term outlook more cautious across the crypto space, with both BTC and ETH vulnerable to profit-taking before attempting fresh highs later in the cycle.
US PCE, Tokyo CPI and RBA minutes set tone for data-light week
The final full week of August brings a relatively light calendar, but still enough to keep markets engaged as investors look beyond to September’s critical events. While inflation data from the U.S., Japan, and Australia will dominate, traders know the real turning points lie in early September with U.S. jobs and CPI.
The main focus in the U.S. will be July PCE inflation on Friday. Consensus points to headline PCE holding steady at 2.6% yoy, while core PCE edges up slightly to 2.9% yoy. Normally, such a reading would command market attention. But Fed Chair Jerome Powell’s dovish tilt at Jackson Hole has softened the impact of marginal surprises. Only a sharp deviation would challenge the market’s conviction that a September rate cut is the base case.
The real determinants will come in early September. Nonfarm payrolls on September 5 and CPI on September 11 are seen as the data points that will ultimately seal the Fed’s course for the September 16–17 meeting. Still, growth readings this week will matter. Personal spending and durable goods orders are expected to shed light on how consumers and businesses are coping with Trump’s tariff regime. Any signs of strain could reinforce the Fed’s case for policy easing.
Japan’s Tokyo CPI on Friday will be another focal point. Core inflation in the capital is expected to fall to 2.6% yoy, a meaningful step down from 2.9% yoy. BoJ policymakers will be looking for evidence that elevated food prices, especially rice, are finally cooling, while also watching whether services inflation remains firm. Alongside Tokyo CPI, Japan’s industrial production and retail sales will be important for assessing growth resilience.
Australia’s monthly CPI, due Wednesday, is forecast to accelerate sharply from 1.9% yoy to 2.3% yoy in July. The outsize move, however, is largely statistical—reflecting the fading of electricity rebate effects. Traders will also parse the RBA’s August meeting minutes, which could confirm the bank’s reluctance to act again in September. Money markets currently price less than a one-third chance of a 25bps cut next month, with November seen as more realistic.
European data are also due, with Germany’s Ifo and GfK surveys and Swiss GDP adding context. Still, the dominant themes are U.S. easing expectations, Japan’s inflation path, and whether Australia’s policymakers are comfortable staying patient for now.
Here are some highlights for the week:
- Monday: New Zealand retail sales; Germany Ifo business climate; US new home sales.
- Tuesday: RBA minutes; US durable goods orders, consumer confidence.
- Wednesday: Australia monthly CPI; Germany Gfk consumer sentiment.
- Thursday: New Zealand ANZ business confidence; Swiss GDP; US GDP revision, jobless claims, pending home sales.
- Friday: Japan Tokyo CPI; industrial production, retail sales; Germany retail sales, CPI flash, import prices, unemployment; Swiss KOF economic barometer; Canada GDP; US personal income and spending, PCE inflation, goods trade balance, Chicago PMI.
AUD/USD Daily Report
Daily Pivots: (S1) 0.6438; (P) 0.6469; (R1) 0.6524; More...
AUD/USD extends the rebound from 0.6413 but stays well below 0.6567 resistance. Intraday bias remains neutral first. Corrective pattern from 0.6624 could extend further sideway. On the upside, firm break of 0.6567 will argue that the correction has completed and bring retest of 0.6624 high. However, break of 0.6413 will extend the correction lower towards 38.2% retracement of 0.5913 to 0.6624 at 0.6352.
In the bigger picture, there is no clear sign that down trend from 0.8006 (2021 high) has completed. Rebound from 0.5913 is seen as a corrective move. While stronger rally cannot be ruled out, outlook will remain bearish as long as 38.2% retracement of 0.8006 to 0.5913 at 0.6713 holds. Nevertheless, considering bullish convergence condition in W MACD, even in case of another fall through 0.5913, downside should be contained above 0.5506 (2020 low).
And It’s a Dove
Investors lapped up Jerome Powell’s words like honey on Friday, as the man has apparently been troubled enough by the latest weakness in jobs numbers to say that this situation “suggests that downside risks to employment are rising” and that “if those risks materialize, they can do so quickly in the form of sharply higher layoffs and rising unemployment.” And no one wants that to happen – especially after heavy criticism from the White House pointing at Powell as Mr. Too Late.
So, Powell basically delivered the 25bp before the September meeting. Unless we see a major positive surprise in the next jobs data, or a major quickening in inflation numbers, September will bring the first rate cut since last September’s 50bp cut. Then, the data – especially the inflation data – will tell if there could be further rate relief into the year-end. But let’s eat one lion at a time. For now, markets are happy, and risk investors got the best of what they wished for from this Jackson Hole speech.
Thursday’s US GDP update and Friday’s PCE data – the Federal Reserve’s (Fed) favourite gauge of inflation – will be the first test of the new Fed outlook. The Q2 GDP is expected to print a 3% rebound in US growth following a dip the month before due to tariff-led disruption – when imports exploded before tariffs became effective, dampening the growth figure. We will probably see that readjust. But whether strong GDP or inflation data will derail the dovish Fed expectations is yet to be seen. Powell’s message was too clear to be questioned regarding a September action.
With a dovish policy shift in hand, the door is open to fresh positive pressure across the equity markets. The S&P 500 jumped 1.5% and closed the week a touch below an ATH, while small-cap stocks – which need lower rates more than anyone else – soared nearly 4%. Mood across Asian markets is positive.
Gains across Chinese equities accelerated with the CSI 300 hitting an almost one-year high. The story there is not only about the Fed but also expectations that the Chinese authorities will announce more stimulus measures, topped by rising appetite for Chinese chip stocks on news that DeepSeek will replace its Nvidia chips with local players (as the government doesn’t want Chinese companies buying American chips). Related reports said Nvidia asked several suppliers to stop working on H20 chips – designed specifically for China. As such, SMIC – often seen as the equivalent of Nvidia for China – jumped more than 10% on Friday and hit a fresh record high this morning before pulling back. Cambricon Technologies rocketed 20% – hit the daily trade limit – and pushed to a fresh record today before pulling back. The stock price is up by around 150% since mid-July.
As for Nvidia, the company will close the earnings dance by releasing its Q2 earnings this Wednesday. Every tech investor is watching how Nvidia performed last quarter with Chinese business in limbo and competition rising. The company had pointed at $45 billion in revenue for Q2 – plus or minus 2% – with margins above 70%. That’s pretty much the average consensus among investors. If achieved, that would mean 50% year-over-year growth – very strong – but probably already priced in. Last week alone, bank analysts raised their price targets for Nvidia by more than 3%. It gets me thinking, maybe Nvidia needs a breather at the current levels, and the rising competition could eventually eat into optimism.
But frankly, if risk appetite remains strong – and it looks like it will – unless we see very disappointing news from Nvidia (which seems unlikely right now), investors will probably rush to buy any dips.
US futures are near flat – digesting Friday’s gains – while European futures are slightly bearish, as we’re still waiting to hear more about Ukraine with peace optimism losing momentum due to slow progress. The UK is closed for a bank holiday. Note that European markets also reacted positively to the Fed news on Friday – as the dovish shift comes just as the European Central Bank (ECB) is considering pausing its own rate cuts. Chic, thought investors – the Fed couldn’t come to spice things up at a better moment. But two things are keeping European investors from fully enjoying the positive echoes from the Fed: the lack of progress on the Ukrainian front, and the likelihood that the rotation out of tech stocks will stall, as lower borrowing costs support growth stock valuations – and tech stocks will benefit from that.
So, the next few days could see European indices underperform their US peers on fading peace optimism and a possible U-turn on tech rotation. Major euro area nations will start revealing their preliminary inflation figures on Friday; soft figures could help lift sentiment.
In metals and energy, gold traded above its 50-DMA despite Friday’s risk-on rally, while US crude is stabilizing following three straight sessions of recovery. Resistance is seen in the $64.75–65pb range – including the 100-DMA and a major Fibonacci retracement. Short-term risks are two-sided, while the medium-to-long-term outlook remains cautiously bearish.
In FX & bonds: the US 2-year yield tanked after Powell’s dovish speech on Friday. The US dollar slipped below the 50-DMA, reversing weekly losses in majors like EURUSD. The convergence of a more dovish Fed outlook versus a stable ECB view should give further support to the single currency, bringing a rise toward 1.20 back on the table.
Powell’s Jackson Hole Address Fuels Expectations of a September Rate Cut
In focus today
In the euro area, focus turns towards the German Ifo indicator. It will be important to see if it shows the same improvement in the manufacturing sector like the PMIs did last week.
In terms of other data releases, today is a quiet day with no significant market movers.
Economic and market news
What happened Friday and over the weekend
In the US, at the Jackson Hole conference on Friday, Federal Reserve Chair Powell signalled a potential rate cut at the September meeting. At the conference, Powell discussed the risk of persistent inflation stemming from higher inflation expectations but appeared relatively more concerned about downside risks to labour markets. While the Fed chair did not pre-commit to anything, this is one of the clearest signals for a September rate cut one could have imagined, and markets reacted dovishly, with expectations for a 25bp cut rising to 80% after his remarks.
Other Fed speakers were not as convinced of the prospect of rate cuts. Cleveland Fed's Beth Hammack (non-voter) cautioned that the Fed is still "missing badly on the inflation mandate", while St. Louis Fed's Alberto Musalem (voter) said that the next jobs report 'may, or may not, be enough to justify a rate cut'. These comments place significant weight on the next monthly employment report, due on 5 September, ahead of the Fed's meeting on the 16-17 September.
In the euro area, negotiated wage growth rose to 3.95% y/y in Q2 from 2.5% y/y in Q1. There were no consensus expectations for Q2, but we did expect it to rise significantly due to the timing of one-off inflation compensation bonuses that effects the yearly growth rates. Compared to ECB's wage tracker that excludes one-off bonuses, the negotiated wages data generally follows the same downward trend despite the uptick in Q2. The negotiated wages indicator covers only the part of wages that is based on collective bargaining, thereby not painting the full picture of wage growth, which we get on 5 September.
In Sweden, the LFS survey data came in weaker than expected, with the unemployment rate (SA) rising to 8.9% (cons: 8.6, prior: 8.3%). The rise in unemployment was primarily driven by weaker employment (-0.4% m/m). the U4 unemployment rate, which includes discouraged workers no longer actively seeking employment, reached a new cycle high, further underlining the soft tone of Friday's release.
In geopolitics, Canadian PM Mark Carney met Ukrainian President Zelenskiy in Kyiv on Independence Day, backing Ukraine's call for NATO-like security guarantees in a future peace deal and stating that Canada would not rule out sending troops under such a framework. The two leaders signed a drone co-production agreement, while Carney announced over CAD 1bn in military aid. Trump's special envoy, Keith Kellogg, also attended and discussed security frameworks with Ukraine's PM. Furthermore, Ukrainian drone attacks on Sunday and earlier in the week targeted Russian oil and energy infrastructure raising concerns over potential disruptions to Russian oil supply which has contributed to pushing oil prices slightly higher.
Equities: Equities rallied on Friday as Powell struck a more dovish tone than expected. The reaction should, however, be seen in the context of the sell-off in the days leading up to the Jackson Hole conference. The S&P 500 gained 1.5% (securing another week of advances), while the small-cap Russell 2000 surged an impressive 3.9%, reflecting its sensitivity to interest rates. Among sectors, the pattern was the same: yield-sensitive areas such as homebuilders, retail, autos, and travel all advanced 3-4%. The momentum has not carried into today, with US futures slightly lower, though Asian markets are rallying in catch-up.
FI and FX: UST yields moved sharply lower on Friday afternoon when Fed Chair Powell hinted at upcoming rate cuts in his annual Jackson Hole speech, saying the current balance of risks 'may warrant adjusting policy stance'. Equity markets saw solid gains on Friday after Powell's remarks, and the positive sentiment continued in Asia overnight, although European and US equity futures are slightly lower ahead of the European open. Powell's speech also triggered broad dollar weakness, with EUR/USD rising from the 1.16-level to reach 1.1740 on Friday afternoon before settling around the 1.1700 level overnight. The "risk on" sentiment on Friday resulted in strengthening of both SEK and NOK with EUR/SEK now trading around 11.13 and EUR/NOK around 11.78 after trading as high as 11.98 on Wednesday.