
Sample Category Title
USD/JPY Daily Outlook
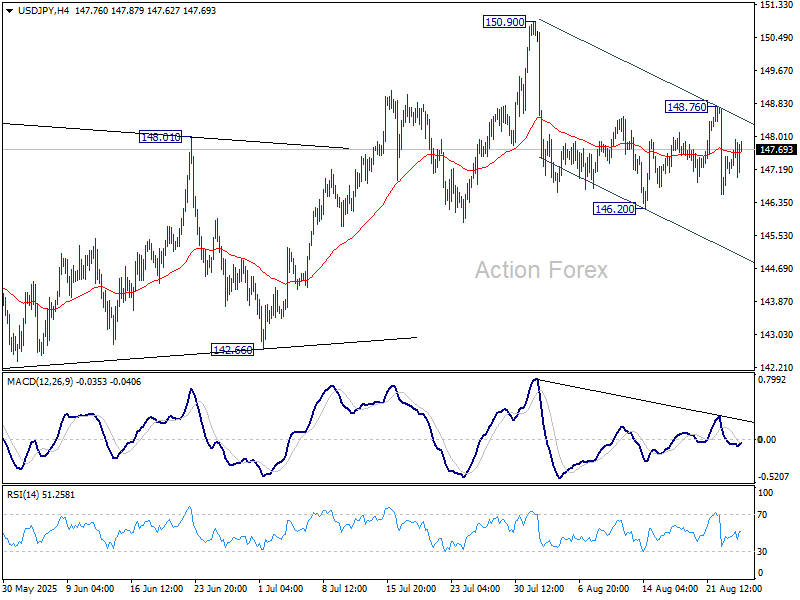
Daily Pivots: (S1) 147.06; (P) 147.50; (R1) 148.19; More...
Intraday bias in USD/JPY remains neutral for the moment. On the downside, firm break of 146.20 will resume the fall from 150.90. Also, that would argue that rebound from 139.87 has completed as a corrective move to 150.90. Deeper fall should be seen to 142.667 support for confirmation. On the upside, above 148.76 will bring another rise to retest 150.90 instead.
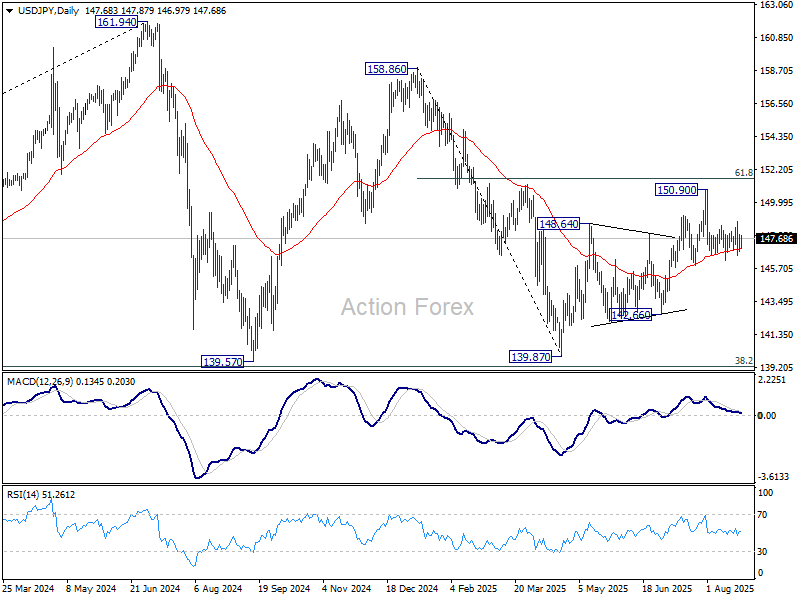
In the bigger picture, price actions from 161.94 (2024 high) are seen as a corrective pattern to rise from 102.58 (2021 low). Decisive break of 61.8% retracement of 158.86 to 139.87 at 151.22 will argue that it has already completed with three waves at 139.87. Larger up trend might then be ready to resume through 161.94 high. In case the corrective pattern extends with another fall, strong support is expected from 38.2% retracement of 102.58 to 161.94 at 139.26 to bring rebound.
USD/CHF Daily Outlook
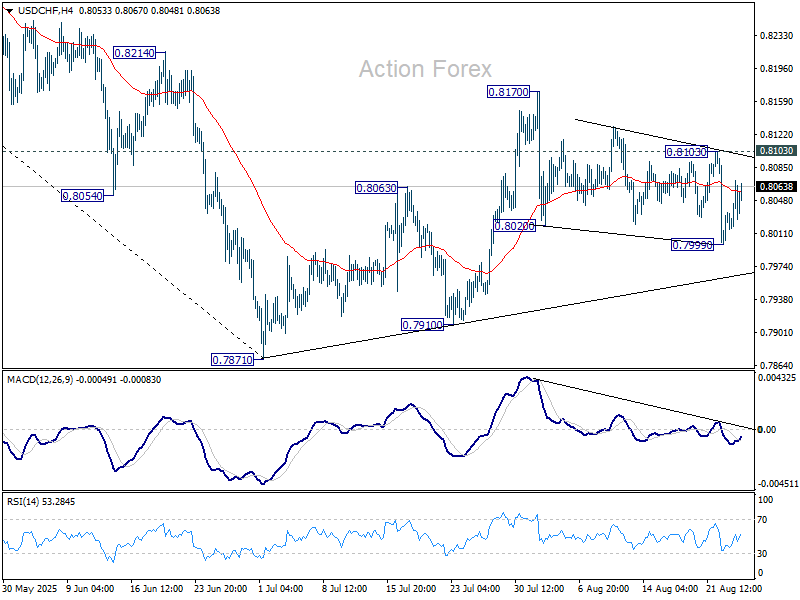
Daily Pivots: (S1) 0.8019; (P) 0.8045; (R1) 0.8084; More….
Intraday bias in USD/CHF is turned neutral first with current recovery. Another fall is in favor as long as 0.8103 resistance holds. Below 0.7999 will target a retest on 0.7871 low. However, break of 0.8103 will turn bias to the upside, and target 0.8170, to extend the corrective pattern from 0.7871.
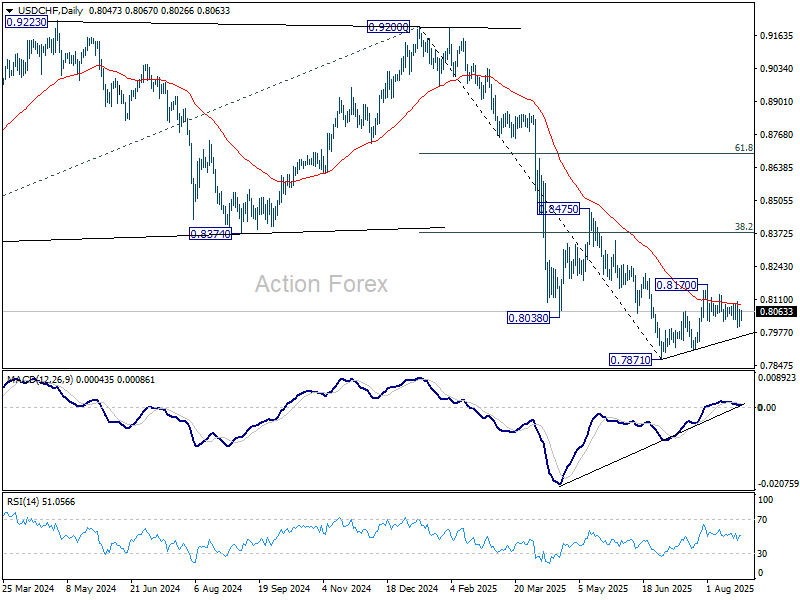
In the bigger picture, long term down trend from 1.0342 (2017 high) is still in progress. Next target is 100% projection of 1.0146 (2022 high) to 0.8332 from 0.9200 at 0.7382. In any case, outlook will stay bearish as long as 0.8475 resistance holds.
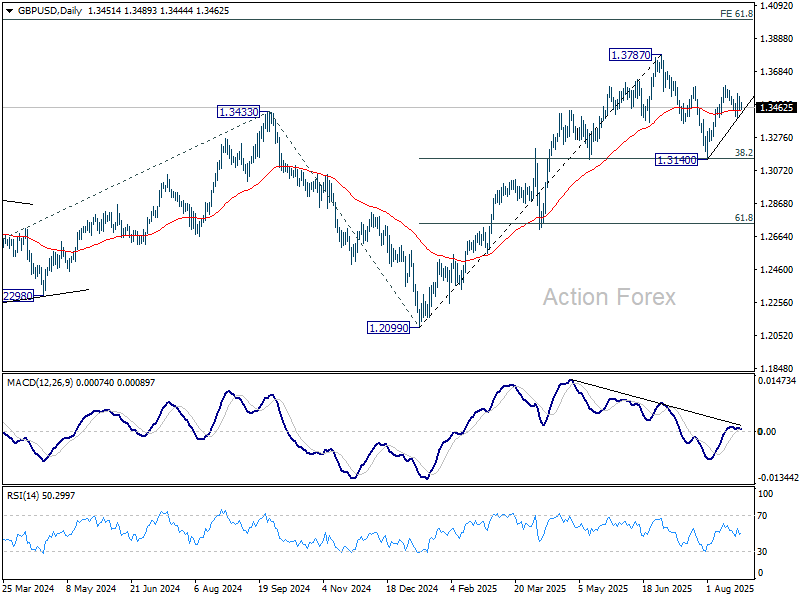
GBP/USD Daily Outlook
Daily Pivots: (S1) 1.3422; (P) 1.3478; (R1) 1.3510; More...
Range trading continues in GBP/USD inside 1.3389/3594 and intraday bias stays neutral. Overall, price actions from 1.3787 high are seen as a corrective pattern. On the upside, break of 1.3594 will resume the rebound from 1.3140 to retest 1.3787 high. Firm break there will resume the larger up trend. However, break of 1.3389 will bring deeper fall towards 1.3140 to extend the corrective pattern.
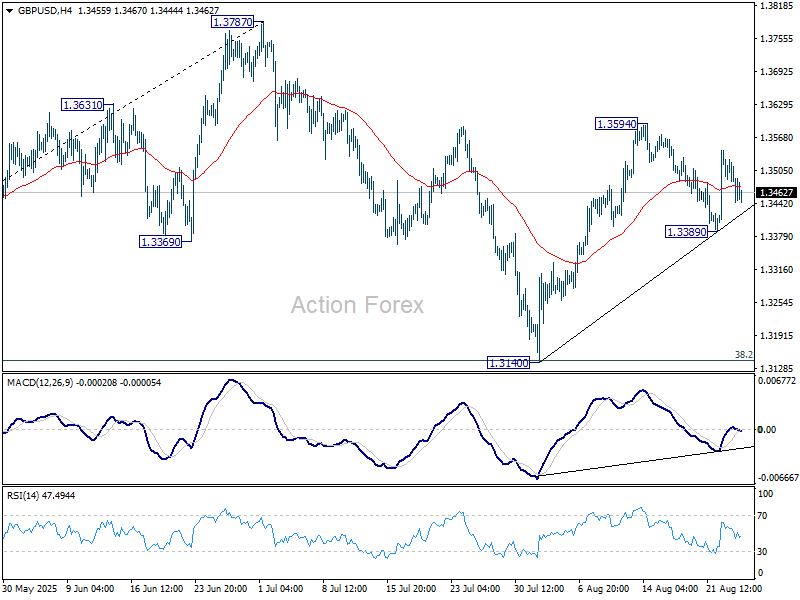
In the bigger picture, up trend from 1.3051 (2022 low) is in progress. Next medium term target is 61.8% projection of 1.0351 to 1.3433 from 1.2099 at 1.4004. Outlook will now stay bullish as long as 55 W EMA (now at 1.3073) holds, even in case of deep pullback.
Dollar Lost Some Ground Overnight After Trump Fires Fed Governor Cook
Markets
The single currency’s short-term fortunes took a dramatic turn yesterday following a surprise announcement by French PM Bayrou. He asked back French parliament by September 8 instead of October 1st and immediately tabled a confidence vote in his minority government on fiscal plans (outlined in July) to bring bloated public finances back on a sustainable trajectory. Bayrou’s government is at huge risk of collapsing. If a vote of no confidence is called by the opposition, abstaining (eg Socialists) equals supporting the government. If the confidence vote is called by the government, abstaining doesn’t count as a valid vote. So the majority of voting members decides the outcome with the extreme right Rassemblement National and far-left leader Mélenchon already calling to vote against PM Bayrou. RN Le Pen suggested early elections to break the deadlock from the current hung parliament. EUR/USD dropped from 1.17+ levels to the low 1.16 area after the announcement, erasing USD-losses triggered by Powell’s dovish pivot in Jackson Hole on Friday. EUR/USD that way risks becoming a balance of weakness with the euro held back by rising French risk premia and the greenback vulnerable to loss of interest rate support in case of disappointing US eco data. Durable goods orders, housing data, the Richmond Fed manufacturing index and the conference board’s consumer confidence are on tap today. The pair could as a result extend its stay in this Summer’s trading range between 1.1392 and 1.1829. The French 10y swap spread added 5 bps yesterday (80 bps) with this year’s high (88 bps) being the next target before possibly taking aim at the all-time (2011) high at 120 bps. German Bunds outperformed intraday, drawing safe haven flows when news broke. German yields still added 2.3 bps (30-yr) to 3.8 bps (5-yr) on a daily basis. Risk assets corrected following Friday’s (exaggerated) enthusiasm with key US and European indices losing up to 0.75% and the French CAC40 (-1.60%) underperforming.
The US dollar lost some ground overnight (EUR/USD 1.1640) after US President Trump fired Fed governor Cook effective immediately saying that false statement on mortgage agreements give him cause to fire her. Cook later disputed his authority, saying she won’t quit. The episode is a new low point in the president’s attacks on the independent central bank. It risks hurting the Fed’s credibility if Trump manages to pack the Fed with people wanting to implement his low interest rate agenda. US Treasuries briefly spiked higher on the publication of Trump’s letter. Dallas Fed President Logan said that US money markets could face temporary pressures around quarter-end next month suggesting that investors will likely tap the Fed’s overnight facilities again as they did in June. She nevertheless believes that the Fed still has more room to reduce reserves (via balance sheet reduction).
News & Views
UK BRC shop price inflation increased from 0.7% Y/Y in July to 0.9% Y/Y in August, the fastest pace since March last year and well above the 3-m moving average of 0.6%. Non-food prices fell 0.8% Y/Y (from -1% in July), but food price inflation accelerated to 0.4% M/M and 4.2% Y/Y (from 4% in July). The Bank of England earlier this month indicated that higher food prices are a potentially important driver for consumers’ inflation expectations. According to BRC, aside from an unfavorable supply-demand balance, the rise in shop prices is still driven by the cost of government measures flowing through to prices of households. Markets question whether there will be room for the BoE to continue its gradual pace of quarterly rate cuts this year.
Belgian business leaders turned more optimistic in August. The business climate improved in the manufacturing and building industries but weakened slightly in the trade and business-related services sectors. Business leaders in manufacturing (-10.5 from -13.5) assessed order books more positively, were more optimistic about demand expectations and for the third consecutive survey expect a rise in employment. Leaders in the building industry (-9.4 from -10.0) were more upbeat about the recent trend in equipment use and orders. Order books were assessed as being significantly weaker when considering the season, but they expect demand to pick up. A slight downturn for business-related services (-1.5 from -1.2) was due to softer expectations for both activity and general market demand, but the current level of activity was seen as more favorable than last month. Sentiment in trade also eased (-8.3 from -7.2). The overall synthetic smoothed curve, which reflects the underlying economic trend, remains on an upward trajectory (-8.9 from -10.8).
Another Day, Another Drama
This week could have started calmly, with investors digesting Friday’s policy shift at the Federal Reserve (Fed), consolidating recent gains and repositioning ahead of the all-important Nvidia earnings due Wednesday. But instead, Donald Trump chose to keep markets on edge by announcing the dismissal of Fed Governor Lisa Cook over alleged mortgage fraud.
The mortgage fraud allegations are unlikely to be the real reason Cook is in the firing line. She has been outspoken about the inflationary impact of tariffs, warning last June that “Trump-style tariffs” would complicate the Fed’s job by pushing up prices and forcing policymakers to keep interest rates higher for longer. That is precisely the message Trump does not want to hear. Cook said she will not step down, but this latest episode of American political drama reignites concerns about the independence of the Fed, and by extension undermines confidence in the US as the global benchmark for transparent and rules-based capital markets.
The dollar halted its Monday rebound, the two-year Treasury yield eased on expectations that Cook will eventually be replaced by someone aligned with Trump’s push for rate cuts regardless of the economic backdrop, while the thirty-year yield erased its Jackson Hole decline. The result is a steepening curve, built on the view that near-term rate cuts will translate into higher long-term inflation. Combined with heavy debt issuance, this dynamic is hardly reassuring for risk sentiment. The thirty-year bond is now yielding close to 5%, raising the opportunity cost of investing in riskier assets. Meanwhile, the technology-heavy S&P 500 and Nasdaq remain stretched, with valuations looking historically expensive. The S&P 500 trades at more 3X sales, the highest level on record. But past peaks have not always prevented momentum from building further, and the combination of strong earnings and dovish Fed expectations is, for now, offsetting the political, trade and geopolitical risks.
In Japan, government bond yields fell for a second consecutive session. At Jackson Hole, Bank of Japan (BoJ) Governor Ueda stressed that rising wages were laying the groundwork for further rate increases. Yet this morning’s inflation data showed an unexpected easing in the BoJ’s preferred metric, giving dollar-yen more room to push above 148 before a significant reversal in favour of the yen becomes likely.
The euro, meanwhile, found support near the 1.16 level on broad dollar weakness but failed to break decisively above its 50-day moving average amid renewed political turbulence in France. Prime Minister François Bayrou has called a confidence vote in his minority government to push through budget cuts. But opposition parties already ruling out support. Hence, the risk of another government collapse is rising. French spreads widened sharply, with the ten-year yield gap versus Bunds hitting the highest in more than a year. The pressure has spilled into equities, weighing on the CAC 40 and on the broader Stoxx 600.
The European index also felt the weight of a 16% plunge in Ørsted. Shares of Denmark’s offshore wind champion slumped after reports that one of its nearly completed projects in the US Northeast could be halted by the Trump administration. The episode highlights the political risk facing renewable energy firms with US exposure. Equinor encountered similar difficulties in the past but found a resolution through high-level negotiations. Ørsted may yet secure a reprieve if officials argue that the project’s output — enough to power some 350,000 homes — is needed. Still, Ørsted’s chart looks far from enticing. Clean energy equities have long since deflated from bubble-like valuations, with Fidelity’s Clean Energy ETF staging a 60% rebound from its April lows but still trading well below past peaks. The long-term demand story for renewables remains intact given surging energy needs from AI and technology applications, but nuclear power has also re-emerged as a controversial “clean” alternative. For now, green energy valuations remain depressed, potentially offering long-term opportunity once political headwinds ease.
With Fed uncertainty, French political risks and geopolitical concerns simmering, safe havens are back in demand. The euro-franc, which had enjoyed a solid rebound in August, slipped back below its 200-day moving average and is now testing the 50-day to the downside. Gold is better bid above its own 50-day moving average. US crude, meanwhile, is testing resistance at $65pb as Ukraine peace talks stall. A clear break higher would put crude back into geopolitically stressed territory and could trigger further near-term spikes, though such rallies may open up attractive selling opportunities for longer-term investors positioning for a supply glut in the second half of the year.
Fed Governor Cook Fights Back Against Trump’s Removal Attempt
In focus today
In the US, Conference Board's August consumer sentiment survey is due for release. We will keep a close eye on consumers' inflation expectations after the latest round of tariff announcements, as well as their perception of labour markets following the weak NFP data.
In Sweden, the minutes from the Riksbank's meeting will be released, offering valuable insights into the board members' thoughts. While the overall tone of the press conference was dovish and they kept their downside bias from the June MPR, Governor Thedéen has since adopted a slightly more hawkish stance in the media. It will be interesting to see if Deputy Governor Bunge and Deputy Governor Breman express any concerns about the high inflation observed over the summer, as they were the most dovish members in the minutes from June.
In Hungary, the central bank (MNB) will announce their key rate decision. Recently, inflation has accelerated and currently runs above the top end of the MNB's tolerance band (4%). Meanwhile, GDP growth has disappointed and the MNB foresees a meagre 0.8% growth for the full year of 2025. With the stagflation-esque tendencies putting the MNB in a tough spot, we expect them to leave the key rate unchanged at 6.50% for the time being, matching Romania for the highest key rate within the EU.
Economic and market news
What happened overnight
In the US, President Donald Trump has attempted to remove Federal Reserve Governor Lisa Cook, citing alleged improprieties in mortgage applications from 2021. Cook, however, denies the claims and argues Trump lacks the legal authority to dismiss her. Legal experts note her actions predate her appointment, raising doubts about the validity of "for cause" removal. This unprecedented move could test the Fed's independence and Cook's removal would allow Trump to reshape the Fed board further, potentially influencing future monetary policy. Markets responded with shifts in Treasury yields, reflecting potential policy changes and uncertainty over the Fed's future direction. See our FI and FX section below for more details.
What happened yesterday
In Germany, the IFO index rose more than expected in August to 89.0 (cons: 88.8) from 88.6 in July like the PMIs last week. The rise was due to higher expectations for the economic outlook while the current situation disappointed with a decline. The assessment of the current economic situation fell to 86.4 from 86.5 falling short of an expected rise to 86.7. In contrast, expectations rose more than expected to 91.6 (cons: 90.5) from 90.7. Hence, the economic situation remains very weak while expectations are improving significantly. The divergence between the current situation and expectations aligns with our view of the economy, as we expect the German economy to remain close to stagnation for the rest of the year. However, growth is expected tick up markedly next year as fiscal easing starts to influence the economy.
In the US, President Trump announced plans to pursue deals like the recent Intel agreement, where the government acquired a 10% stake in the chipmaker for USD 8.9bn. The deal, funded by grants from the CHIPS Act and the Secure Enclave program, aims to bolster domestic chip production and create jobs. Trump praised the move for boosting Intel's stock price and strengthening the US economy.
In France, Prime Minister François Bayrou faces a confidence vote on 8 September that could bring down his minority government. With major opposition parties pledging to vote against him, the government's future looks uncertain. Bayrou's austerity-focused budget plans have sparked criticism, market jitters and calls for protests, reminiscent of the 2018 Yellow Vest movement.
In geopolitics, tensions between the US and South Korea surfaced as President Trump criticised Seoul ahead of a high-stakes summit with President Lee Jae Myung. With South Korea's economy heavily reliant on US trade and security guarantees, Lee faces the challenge of balancing these ties while avoiding friction with China. Key topics at the summit include defence spending, trade, and North Korea.
In tech, Elon Musk's xAI filed a lawsuit against Apple and OpenAI, accusing them of monopolistic practices that suppress competition in the AI market. The suit claims Apple's exclusive integration of ChatGPT disadvantages rivals like xAI by limiting app visibility in the App Store. Musk, who is seeking billions in damages, also continues to challenge OpenAI's shift to a for-profit model in a separate case. The dispute underscores broader tensions over AI market dominance and platform control.
Equities: Equities were lower yesterday. US retreated after the strong run on Friday. More surprisingly was that the equity rally in the US session failed to spill over to European and Nordic markets. Instead, Stoxx 600 was -0.4% lower with a defensive bias in its sector performance. In a way, it makes sense to see US equities outperforming Europe as rate cuts will lower financial costs, that is especially true for small caps that are the most sensitive to changes to the interest rate. US equities were also underperforming Europe last week and so, the rebound on Friday was just as much a correction after trading down equities on hawkish Fed expectations than the news itself. Yet, with all of this in mind, on top of stronger European PMIs than expected last week, it is surprising to see such a weak equity performance yesterday. For the US, it was not a risk-off session. Instead, declines were most notable in the defensive space, with consumer stapels and health care selling off the most. For big tech, Fed guidance came just in time. Lower yields is typically a driver for these names, which proved to be the case again yesterday with Nvidia, Tesla and Alphabet all up 1-2%. Emerging markets and especially China worth a mention. Shenzhen index is rising 0.7% this morning and has been on fire lately; onshore stocks are up over 10% the last two weeks. This is strange, as economic data and stimulus measures have been disappointing lately. Tech and chip producers hold some of the explanation, but it could also be markets running ahead on stimulus expectations.
FI and FX: The broad USD started the week on a firm footing and US yields rose during Monday's session as market euphoria over imminent Fed cuts slightly faded. France widened against Germany with the French PM Bayrou calling for a confidence vote on 8 September. Overnight, President Donald Trump announced that he will seek to remove Fed Governor Lisa Cook, alleged by the Trump administration of mortgage fraud. The dollar weakened and US front-end rates dropped initially but recovered as markets are likely anticipating that Cook can win her legal challenge and be reinstated. The highlight in Scandi markets today will be the Riksbank minutes from last week's decision.
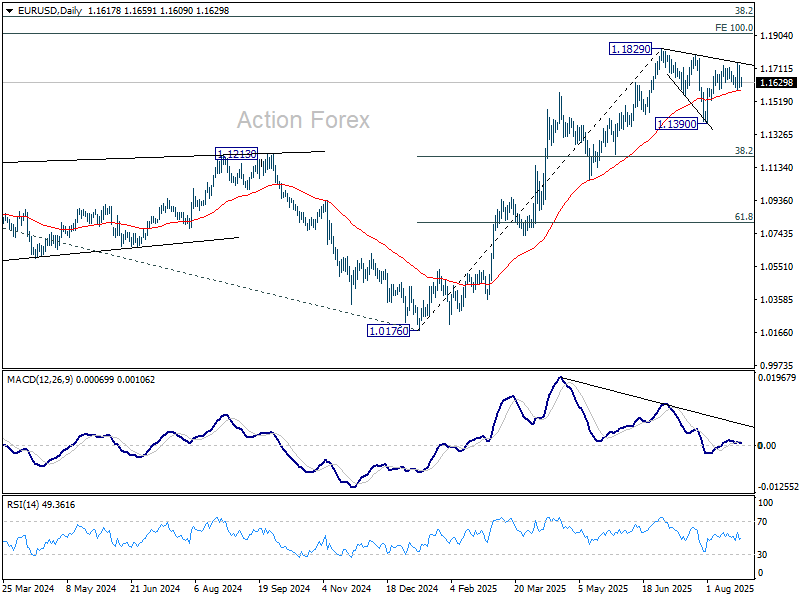
EUR/USD Daily Outlook
Daily Pivots: (S1) 1.1572; (P) 1.1650; (R1) 1.1697; More...
Intraday bias in EUR/USD is turned neutral again with current retreat. Further rise is expected as long as 1.1582 support holds. Above 1.1741 will resume the rally from 1.1390 to retest 1.1829 high. Firm break there will extend larger up trend. However, decisive break of 1.1582 will extend the corrective pattern from 1.1829 with another downleg, and target 1.1390.
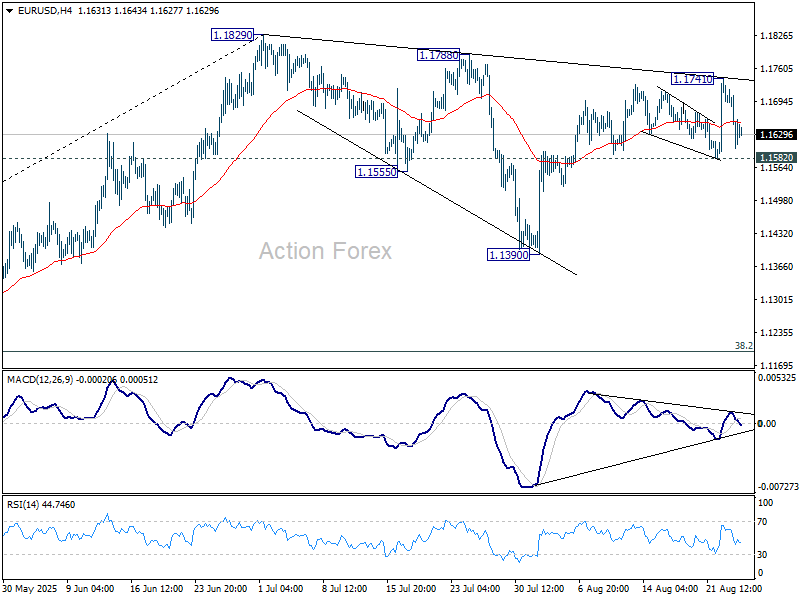
In the bigger picture, rise from 0.9534 long term bottom could be correcting the multi-decade downtrend or the start of a long term up trend. In either case, further rise should be seen to 100% projection of 0.9534 to 1.1274 from 1.0176 at 1.1916. This will remain the favored case as long as 1.1604 support holds.
Fed Drama and Fresh Tariff Threats Sour Risk Mood
Markets turned risk-averse again overnight, with Wall Street weakness spilling into Asia as political and trade developments rattled sentiment. Expectations that the Fed will cut rates in September remain intact, but investors are struggling to look past threats to central bank independence and a fresh wave of tariff risks.
The flashpoint came Monday when US President Donald Trump announced he had fired Federal Reserve Governor Lisa Cook, citing alleged misconduct related to mortgage applications. Cook immediately rejected the move, saying the president had “no authority” to dismiss her and pledging to remain in her post. The confrontation has cast a cloud over the Fed just as it prepares for a pivotal September policy meeting.
The optics are striking: Cook, the first Black woman to serve on the Fed board, has become the focal point of a legal and political dispute that could test the institution’s autonomy. For markets, the drama only adds to uncertainty at a time when Fed credibility and consistency are paramount.
At the same time, Trump sharpened his trade rhetoric. He warned that countries imposing digital services taxes would face “substantial” new tariffs on exports to the U.S., along with restrictions on U.S. chip supplies. The warning targeted dozens of nations, reopening old disputes that many investors had assumed were on hold.
China was also singled out in particularly blunt terms. Trump threatened that the U.S. would impose another 200% tariff on Chinese exports if Beijing restricted shipments of rare-earth magnets to the U.S. He also boasted that U.S. withholding of Boeing aircraft parts had already grounded hundreds of Chinese planes. The comments risk destabilizing a fragile trade truce between the two economies.
In currency markets, Dollar regained its lead, emerging as the strongest currency so far this week. Aussie and Loonie followed, while the Euro, Yen, and Swiss Franc fell to the bottom of the rankings. Sterling and Kiwi traded mid-pack. Yet, despite heightened rhetoric, most major pairs remain trapped within last week’s ranges. Markets appear unwilling to chase moves until clearer direction emerges, whether from hard data or further political escalation.
In Asia, at the time of writing, Nikkei is down -0.92%. Hong Kong HSI is down -0.22%. China Shanghai SSE is down -0.21%. Singapore Strait Times is down -0.26%. Japan 10-year JGB yield is up 0.002 at 1.623. Overnight, DOW fell -0.77%. S&P 500 fell -0.43%. NASDAQ fell -0.22%. 10-year yield rose 0.015 to 4.275.
RBA minutes: Not yet possible to decide pace of further easing
Minutes of RBA’s August 11–12 meeting showed policymakers unanimously backed the 25bps cut to 3.60%, citing stronger evidence that inflation is heading sustainably toward the midpoint of the 2–3% target range. The Board agreed that full employment can be preserved while inflation continues easing, though members noted risks remain in both directions.
The central bank noted that some further reduction in cash rate likely to be needed "in the coming year". But it also stressed that the pace of further reductions will be determined “meeting by meeting” as new data emerges. While some indicators still suggest a tight labor market and inflation projected to stay slightly above target in the medium term, private demand is recovering, supporting the case for a "gradual pace".
At the same time, the minutes noted conditions that could justify a"slightly faster" pace of easing. If the labor market is already "in balance", or if risks shift more clearly to the downside—whether through weaker global growth or slower employment handover—then a quicker reduction in the cash rate could be warranted to avoid undershooting inflation.
Overall, members concluded it is “not yet possible” to judge whether easing will be gradual or slightly faster. RBA left the door open for both paths, emphasizing that data will drive the speed of policy adjustments in the months ahead.
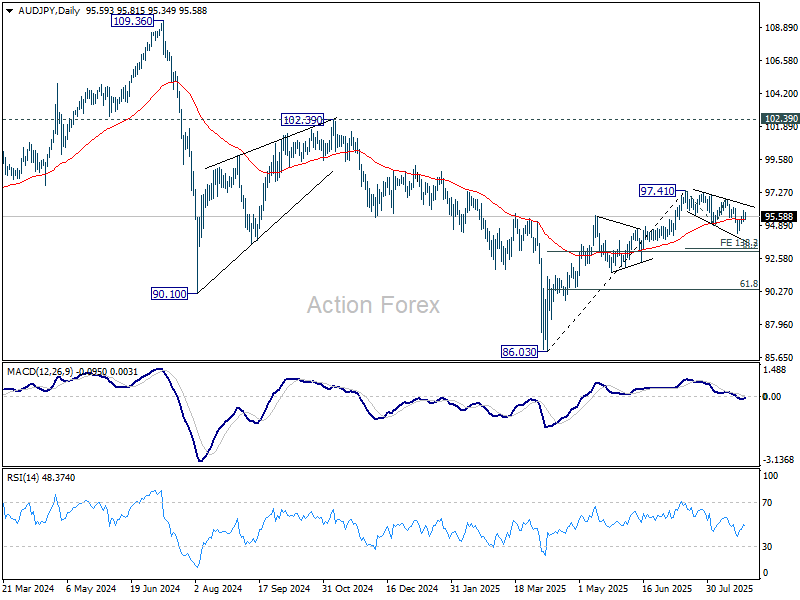
AUD/JPY's corrective fall intact for another leg through 94.38
AUD/JPY dipped mildly after RBA’s August minutes affirmed that further easing is likely over the coming year. While the Board leaned toward a gradual pace of cuts, it made clear that a faster reduction path is possible if the labor market continues to rebalance.
RBA suggested it would not require material deterioration to quicken the pace; rather, once the job market shifts to a more balanced state, it would be appropriate to cut faster to avoid inflation undershooting target.
Technically, AUD/JPY’s pullback from 97.41, as a correction of the broader rise from 86.03, remains in motion. The rebound from 94.38 has lost momentum after stalling at 95.94, with the falling trend line (now at 96.40) likely to cap further upside attempts.

Break below 95.12 minor would signal the correction entering a fresh leg lower, with 94.38 next support. Breaking that level would extend the correction toward 138.2% projection of 97.41 to 94.88 from 96.81 at 93.31.
Though, strong support should emerge from 38.2% retracement of 86.03 to 97.41 at 93.06 to complete the correction, and bring resumption of rise form 86.03.
EUR/USD Daily Outlook
Daily Pivots: (S1) 1.1572; (P) 1.1650; (R1) 1.1697; More...
Intraday bias in EUR/USD is turned neutral again with current retreat. Further rise is expected as long as 1.1582 support holds. Above 1.1741 will resume the rally from 1.1390 to retest 1.1829 high. Firm break there will extend larger up trend. However, decisive break of 1.1582 will extend the corrective pattern from 1.1829 with another downleg, and target 1.1390.
In the bigger picture, rise from 0.9534 long term bottom could be correcting the multi-decade downtrend or the start of a long term up trend. In either case, further rise should be seen to 100% projection of 0.9534 to 1.1274 from 1.0176 at 1.1916. This will remain the favored case as long as 1.1604 support holds.
WTI Crude Oil Eyes Recovery Move, Can Bulls Turn Tables Now?
Key Highlights
- WTI Crude Oil prices started a recovery wave from the $62.00 support.
- The price surpassed a declining channel with resistance at $63.50 on the 4-hour chart.
- Gold is showing positive signs and might gain pace if it clears the $3,375 resistance.
- Bitcoin is trimming gains and might even decline below $110,000.
WTI Crude Oil Price Technical Analysis
WTI Crude Oil price remained supported above $62.00 against the US Dollar. A base was formed, and the price started a recovery wave above $63.20.
Looking at the 4-hour chart of XTI/USD, the price surpassed a declining channel with resistance at $63.50. The price climbed above the 23.6% Fib retracement level of the downward move from the $71.19 swing high to the $62.08 low.
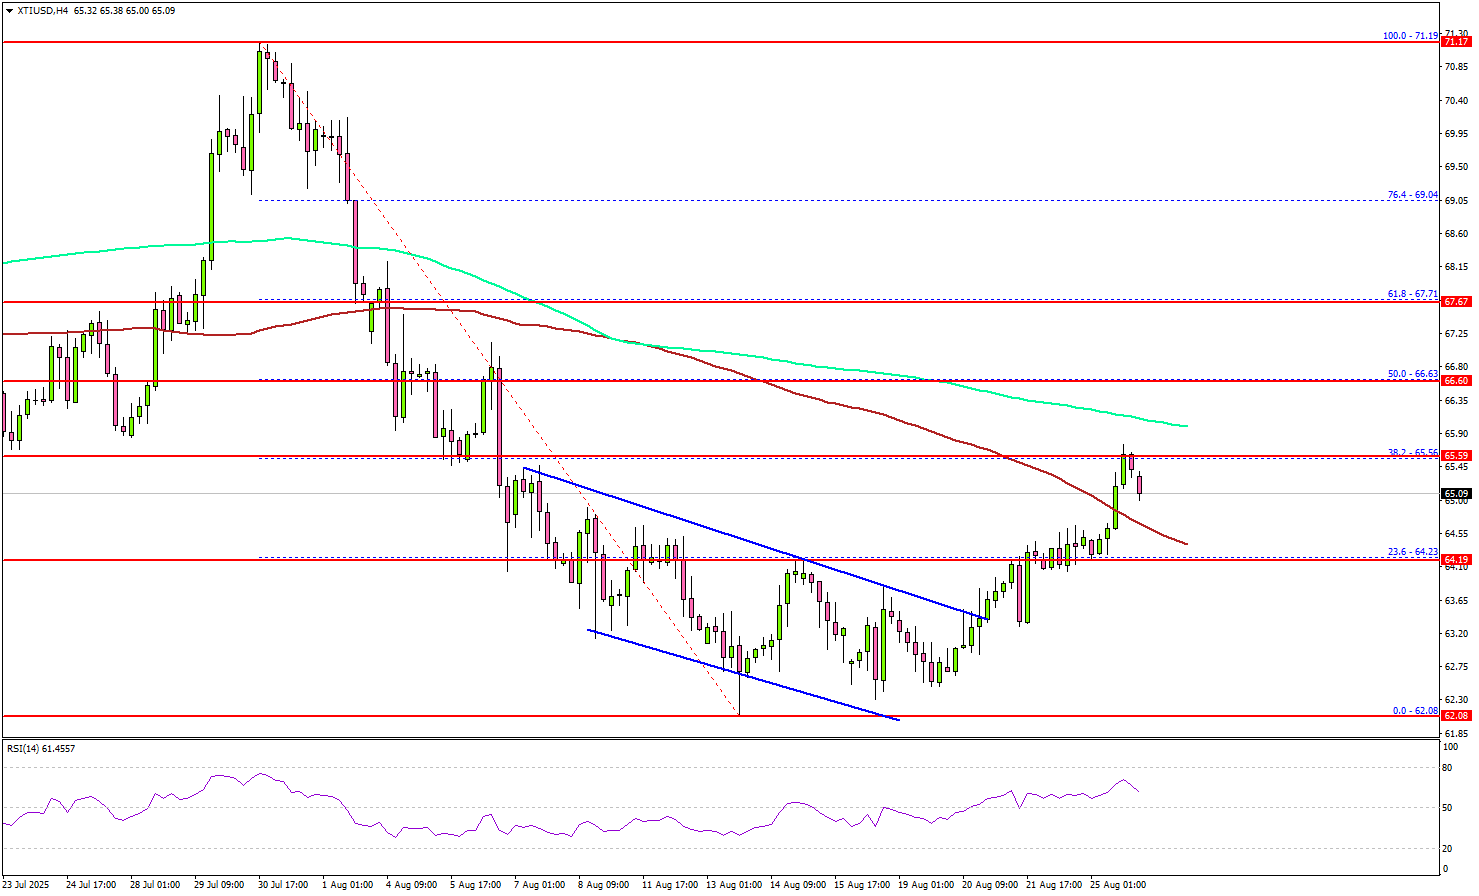
The price is now trading above the 100 simple moving average (red, 4-hour). On the upside, immediate resistance is near the $65.50 level. The first key hurdle for the bulls could be near the 200 simple moving average (green, 4-hour) at $65.90.
A close above $65.90 might send Oil prices toward the 50% Fib retracement level of the downward move from the $71.19 swing high to the $62.08 low at $66.60.
Any more gains might call for a test of $68.00 in the near term. On the downside, the first major support sits near the $64.20 zone. The next support could be $63.50. A daily close below $63.50 could open the doors for a larger decline.
In the stated case, the bears might aim for a drop toward $62.00. Any more losses could open the doors for a test of the $60.00 handle.
Looking at Gold, the bulls are slowly regaining strength and might soon aim for a move above the $3,380 pivot level.
Economic Releases to Watch Today
- US Durable Goods Orders for July 2025 – Forecast -4.0% versus -9.3% previous.
- US House Price Index for June 2025 (MoM) - Forecast 0%, versus -0.2% previous.
- S&P/Case-Shiller Home Price Indices for June 2025 (YoY) - Forecast +2.2%, versus +2.8% previous.
AUD/JPY’s corrective fall intact for another leg through 94.38
AUD/JPY dipped mildly after RBA’s August minutes affirmed that further easing is likely over the coming year. While the Board leaned toward a gradual pace of cuts, it made clear that a faster reduction path is possible if the labor market continues to rebalance.
RBA suggested it would not require material deterioration to quicken the pace; rather, once the job market shifts to a more balanced state, it would be appropriate to cut faster to avoid inflation undershooting target.
Technically, AUD/JPY’s pullback from 97.41, as a correction of the broader rise from 86.03, remains in motion. The rebound from 94.38 has lost momentum after stalling at 95.94, with the falling trend line (now at 96.40) likely to cap further upside attempts.
Break below 95.12 minor would signal the correction entering a fresh leg lower, with 94.38 next support. Breaking that level would extend the correction toward 138.2% projection of 97.41 to 94.88 from 96.81 at 93.31.
Though, strong support should emerge from 38.2% retracement of 86.03 to 97.41 at 93.06 to complete the correction, and bring resumption of rise form 86.03.