
Sample Category Title
USD/JPY Mid-Day Outlook
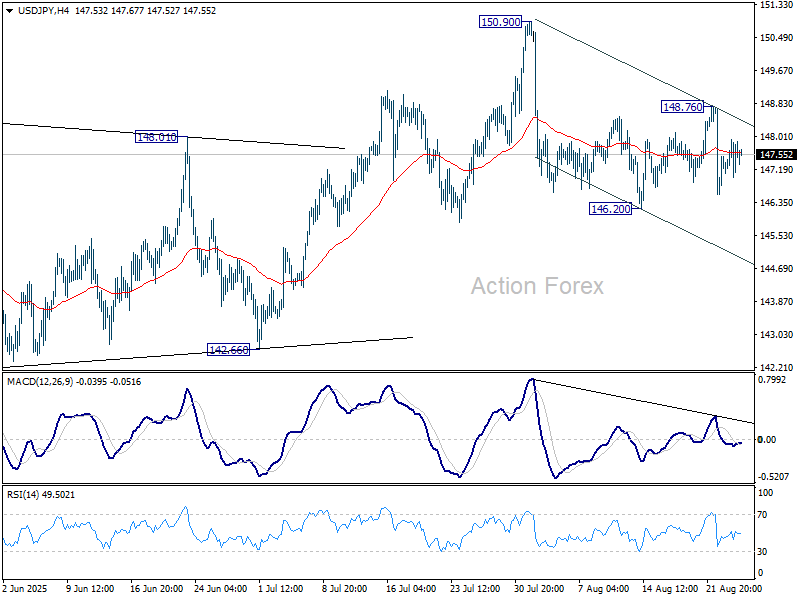
Daily Pivots: (S1) 147.06; (P) 147.50; (R1) 148.19; More...
Range trading continues in USD/JPY and intraday bias remains neutral. On the downside, firm break of 146.20 will resume the fall from 150.90. Also, that would argue that rebound from 139.87 has completed as a corrective move to 150.90. Deeper fall should be seen to 142.667 support for confirmation. On the upside, above 148.76 will bring another rise to retest 150.90 instead.
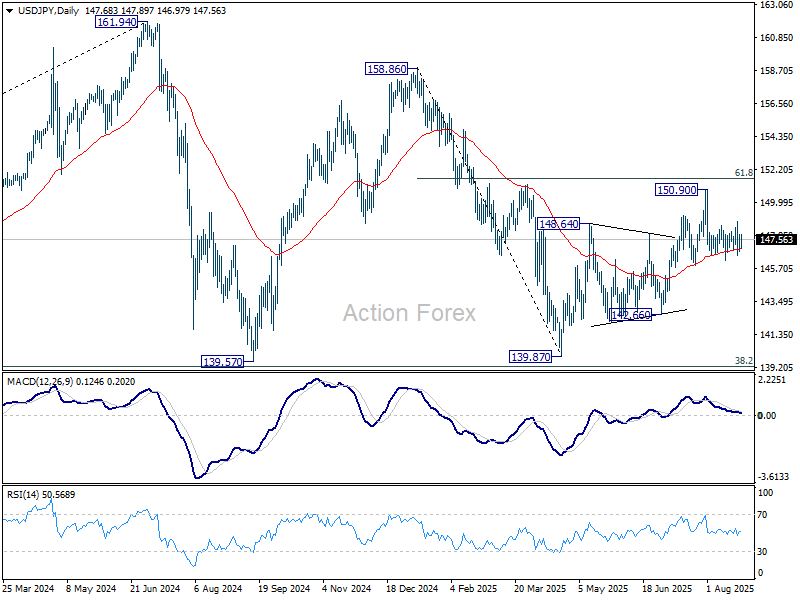
In the bigger picture, price actions from 161.94 (2024 high) are seen as a corrective pattern to rise from 102.58 (2021 low). Decisive break of 61.8% retracement of 158.86 to 139.87 at 151.22 will argue that it has already completed with three waves at 139.87. Larger up trend might then be ready to resume through 161.94 high. In case the corrective pattern extends with another fall, strong support is expected from 38.2% retracement of 102.58 to 161.94 at 139.26 to bring rebound.
GBP/USD Mid-Day Outlook
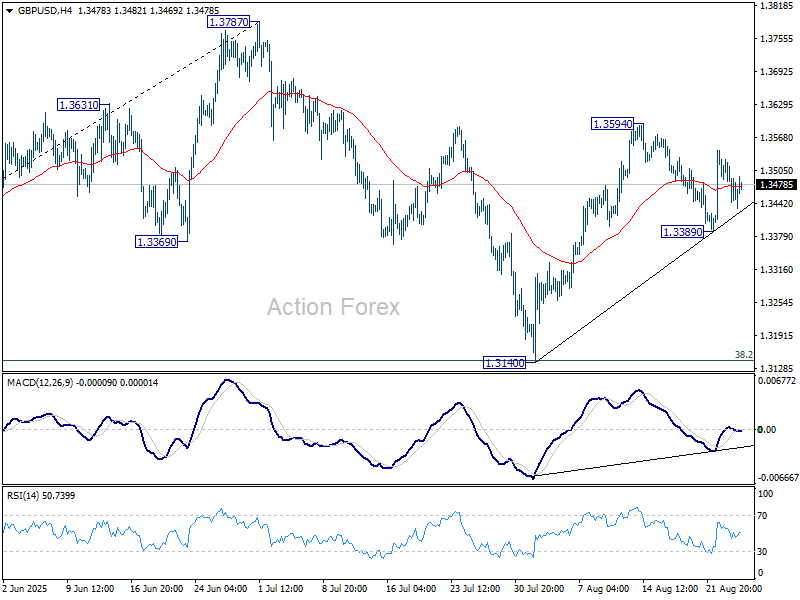
Daily Pivots: (S1) 1.3422; (P) 1.3478; (R1) 1.3510; More...
Intraday bias in GBP/USD remains neutral as sideway trading continues. Overall, price actions from 1.3787 high are seen as a corrective pattern. On the upside, break of 1.3594 will resume the rebound from 1.3140 to retest 1.3787 high. Firm break there will resume the larger up trend. However, break of 1.3389 will bring deeper fall towards 1.3140 to extend the corrective pattern.
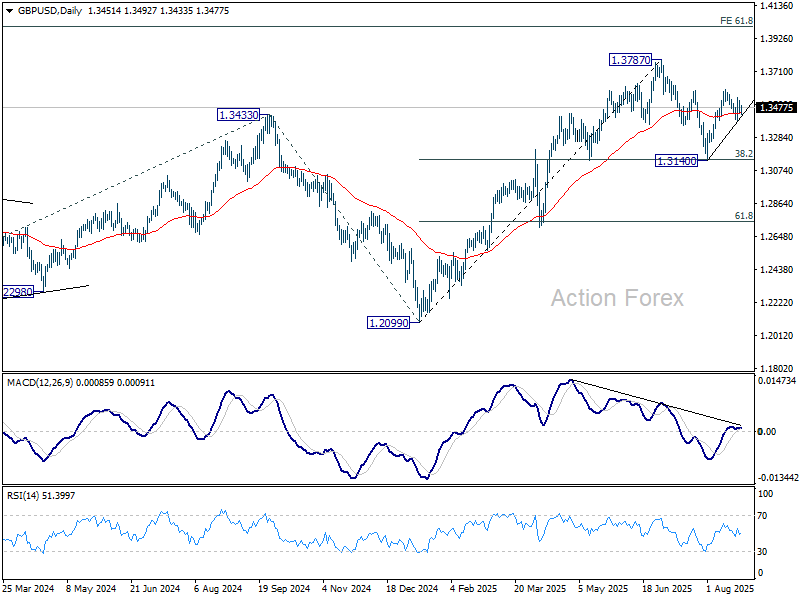
In the bigger picture, up trend from 1.3051 (2022 low) is in progress. Next medium term target is 61.8% projection of 1.0351 to 1.3433 from 1.2099 at 1.4004. Outlook will now stay bullish as long as 55 W EMA (now at 1.3073) holds, even in case of deep pullback.
EUR/USD Mid-Day Outlook
Daily Pivots: (S1) 1.1572; (P) 1.1650; (R1) 1.1697; More...
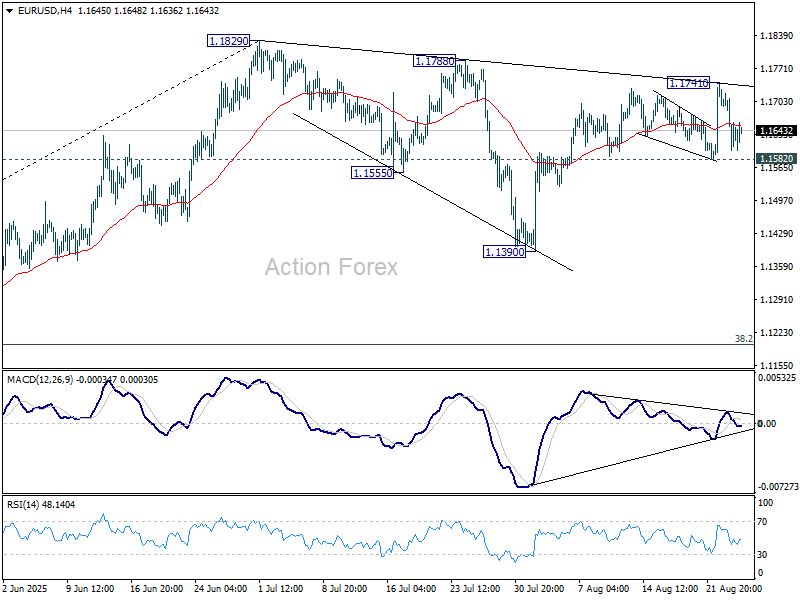
EUR/USD is holding above 1.1582 support despite current retreat. Intraday bias remains neutral and further rise is in favor. Above 1.1741 will resume the rally from 1.1390 to retest 1.1829 high. Firm break there will extend larger up trend. However, decisive break of 1.1582 will extend the corrective pattern from 1.1829 with another downleg, and target 1.1390.
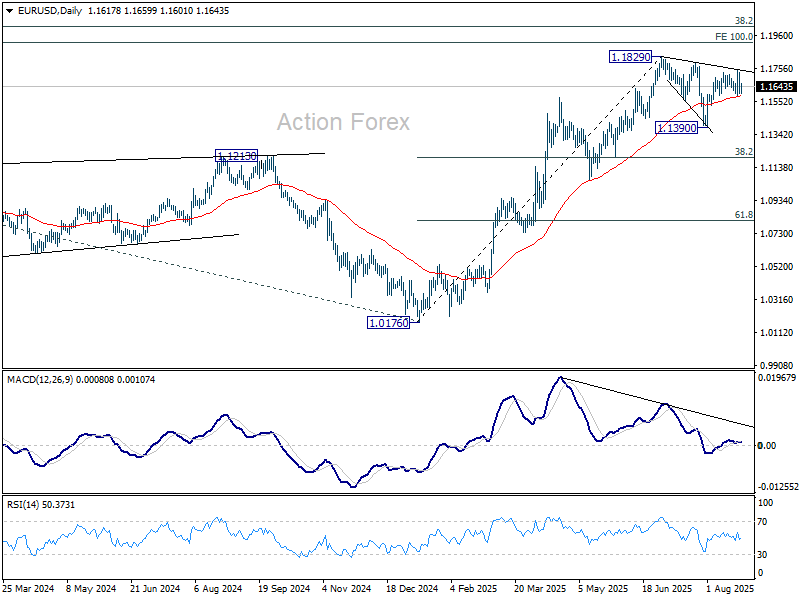
In the bigger picture, rise from 0.9534 long term bottom could be correcting the multi-decade downtrend or the start of a long term up trend. In either case, further rise should be seen to 100% projection of 0.9534 to 1.1274 from 1.0176 at 1.1916. This will remain the favored case as long as 1.1604 support holds.
French Politics Weighs on Euro, But Selling Fails to Gain Momentum
Currency markets stayed quiet overall, even though French politics briefly unsettled sentiment. French stocks dropped sharply as Prime Minister Francois Bayrou’s government looked increasingly at risk ahead of a September 8 confidence vote on his proposed budget cuts. Euro softened in response, though losses were limited.
Bayrou’s chances of survival are slim after three main opposition parties — the National Rally, Greens, and Socialists — confirmed they would not back him. Should the government lose the vote, President Emmanuel Macron would have to either name a new prime minister, keep Bayrou in a caretaker role, or call snap elections, all scenarios that would extend political uncertainty.
In the broader FX market, Dollar is the strongest performer for the day so far, followed by Aussie and Loonie. Euro lagged most, with Yen and Swiss Franc also soft, while Sterling and the Kiwi traded mid-pack.
Attention now shifts to Australia, where July CPI is due in the upcoming Asian session. Headline inflation is forecast to rise to 2.3% yoy from 1.9% yoy, though the increase largely reflects statistical effects from the expiry of electricity rebates.
Focus now shifts to the upcoming Australian monthly CPI release. Inflation is expected to jump from 1.9% yoy to 2.3% yoy, largely due to the unwinding of electricity rebates. A softer reading would provide some relief for the RBA but is unlikely to accelerate its easing timeline.
As highlighted in today’s RBA minutes, policymakers will need clearer evidence of labor market slack before considering faster rate cuts. Until then, the central bank appears content with a gradual pace of easing.
US durable goods fall -2.8% mom, but core orders show resilience
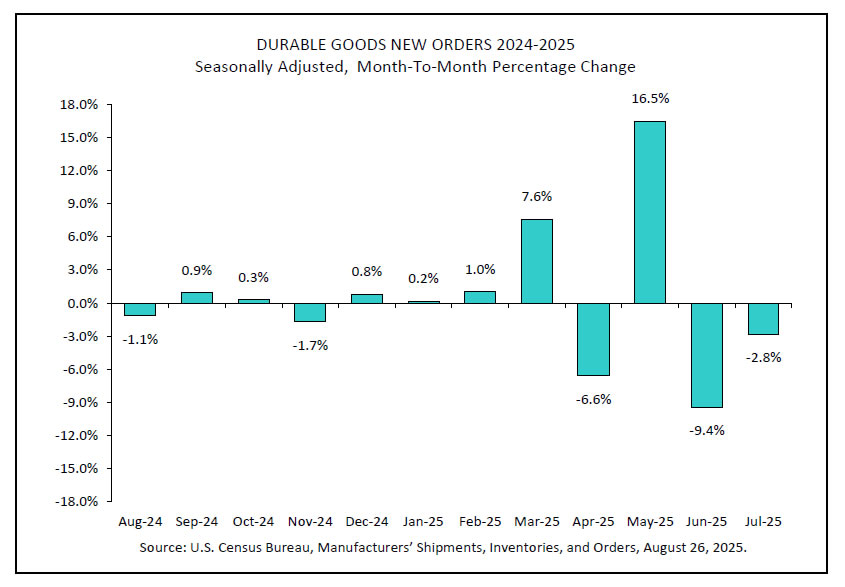
U.S. durable goods orders fell -2.8% mom to USD 302.8B in July, marking the third decline in four months but performing better than forecasts of -4.0% mom. Transportation equipment, also down in three of the past four months, was the main drag, plunging -9.7% mom to USD 101.7B. Ex-defense orders also slipped -2.5% to USD 284.5B.
Stripping out the volatile transport sector, however, orders rose 1.1% mom to USD 201.1B, far stronger than the 0.3% mom expected. The positive core reading suggests that underlying business investment remains more stable than the headline figure implies, limiting concerns of a broader manufacturing downturn.
RBA minutes: Not yet possible to decide pace of further easing
Minutes of RBA’s August 11–12 meeting showed policymakers unanimously backed the 25bps cut to 3.60%, citing stronger evidence that inflation is heading sustainably toward the midpoint of the 2–3% target range. The Board agreed that full employment can be preserved while inflation continues easing, though members noted risks remain in both directions.
The central bank noted that some further reduction in cash rate likely to be needed "in the coming year". But it also stressed that the pace of further reductions will be determined “meeting by meeting” as new data emerges. While some indicators still suggest a tight labor market and inflation projected to stay slightly above target in the medium term, private demand is recovering, supporting the case for a "gradual pace".
At the same time, the minutes noted conditions that could justify a"slightly faster" pace of easing. If the labor market is already "in balance", or if risks shift more clearly to the downside—whether through weaker global growth or slower employment handover—then a quicker reduction in the cash rate could be warranted to avoid undershooting inflation.
Overall, members concluded it is “not yet possible” to judge whether easing will be gradual or slightly faster. RBA left the door open for both paths, emphasizing that data will drive the speed of policy adjustments in the months ahead.
Gold bounces as Trump escalates clash with Fed, but gains lack follow-through
Gold bounced modestly this week as markets digested U.S. President Donald Trump’s unprecedented attempt to fire Fed Governor Lisa Cook. The move marked a sharp escalation in Trump’s long-running feud with the central bank, where he has repeatedly pressed for faster rate cuts but stopped short of threatening Chair Jerome Powell before his term expires next year.
Investors interpreted the move as an effort to reshape the Fed’s balance, raising the risk of a more politically driven policy stance. That uncertainty spurred some safe-haven demand for Gold, but follow-through buying has been limited. The metal remains confined within this month’s 3,300–3,400 range.

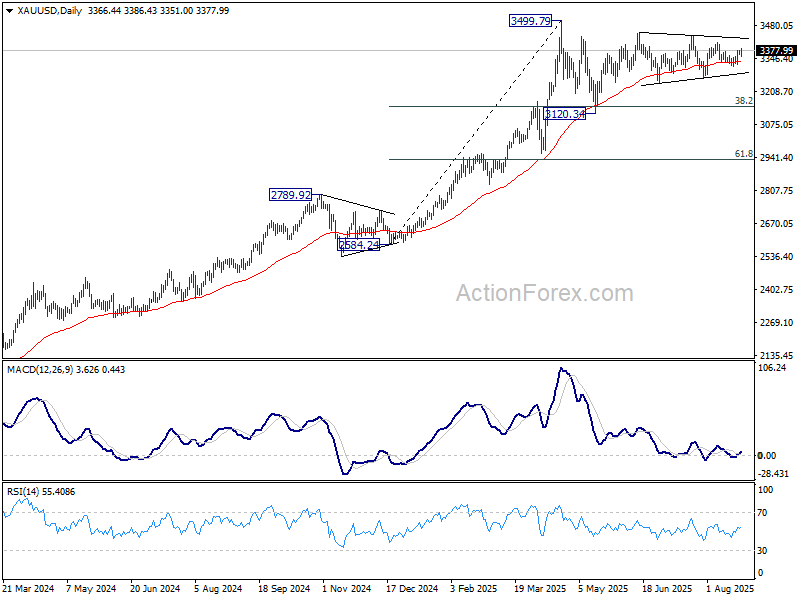
In the bigger picture, Gold has been trapped between 3,100 and 3,500 for more than three months. The long-term uptrend remains intact, but it's unsure whether another leg down will unfold before the market finally tests resistance at the 3,500 threshold.
For now, break above near-term resistance at 3,408.21 is needed to signal momentum is turning higher. Without that, Gold’s outlook stays neutral, with sideways trading likely to dominate in the days ahead.
EUR/USD Mid-Day Outlook
Daily Pivots: (S1) 1.1572; (P) 1.1650; (R1) 1.1697; More...
EUR/USD is holding above 1.1582 support despite current retreat. Intraday bias remains neutral and further rise is in favor. Above 1.1741 will resume the rally from 1.1390 to retest 1.1829 high. Firm break there will extend larger up trend. However, decisive break of 1.1582 will extend the corrective pattern from 1.1829 with another downleg, and target 1.1390.
In the bigger picture, rise from 0.9534 long term bottom could be correcting the multi-decade downtrend or the start of a long term up trend. In either case, further rise should be seen to 100% projection of 0.9534 to 1.1274 from 1.0176 at 1.1916. This will remain the favored case as long as 1.1604 support holds.
XAU/USD: Gold Rises After Trump’s Latest Move to Fire Fed Governor Deepened Uncertainty
Gold rose to two-week high on Tuesday, driven by fresh wave of risk aversion sparked by growing uncertainty on decision of President Trump to fire a Fed Governor Cook.
Trump’s conflict with the US policymakers is escalating again, after a campaign to remove Fed Chair Powell, which Trump eventually sidelined, but remained on track to secure dovish majority in the FOMC after failing to convince them for more radical rate cuts.
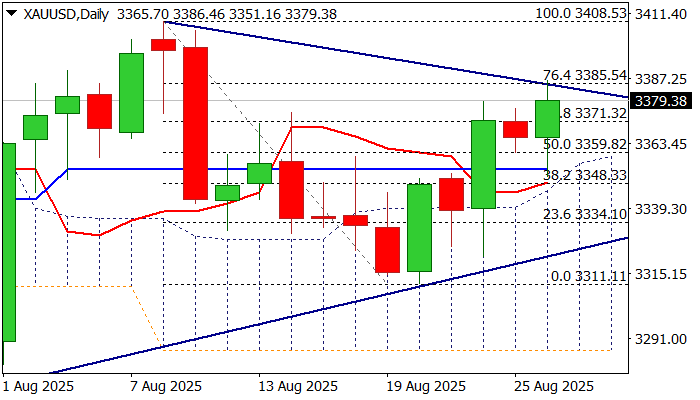
Fresh strength cracked important barrier at $3385 (upper triangle boundary / Fibo 76.4% of $3408/$331 bear-leg) but was so far unable to break higher.
Technical picture on daily chart is still mixed with positive signals from today’s formation of bullish engulfing pattern (still to be confirmed) and price action being underpinned by thick daily cloud, while neutral momentum studies and overbought Stochastic offset positive impact.
Repeated daily close above broken Fibo 50% ($3360) will be a minimum requirement to keep near-term bias with bulls, while close above $3371 (broken Fibo 61.8%) would boost optimism for push through triangle’s upper trendline and expose key resistances at $3400/08 (psychological / Aug 8 top).
Res: 3385; 3400; 3408; 3431.
Sup: 3371; 3360; 3353; 3348.
US durable goods fall -2.8% mom, but core orders show resilience
U.S. durable goods orders fell -2.8% mom to USD 302.8B in July, marking the third decline in four months but performing better than forecasts of -4.0% mom. Transportation equipment, also down in three of the past four months, was the main drag, plunging -9.7% mom to USD 101.7B. Ex-defense orders also slipped -2.5% to USD 284.5B.
Stripping out the volatile transport sector, however, orders rose 1.1% mom to USD 201.1B, far stronger than the 0.3% mom expected. The positive core reading suggests that underlying business investment remains more stable than the headline figure implies, limiting concerns of a broader manufacturing downturn.
Reversal of Trend in Crypto Has Been Confirmed
Market Overview
The crypto market has been on a downward trend for the last 12 days, falling to $3.76 trillion on Tuesday morning and later stabilising at $3.79 trillion. Capitalisation fell below the 50-day moving average and the area of recent lows, giving a technical signal of a change in the trend from growth to decline. The declines in this area over the past three months have been close to the bottom of local corrections.
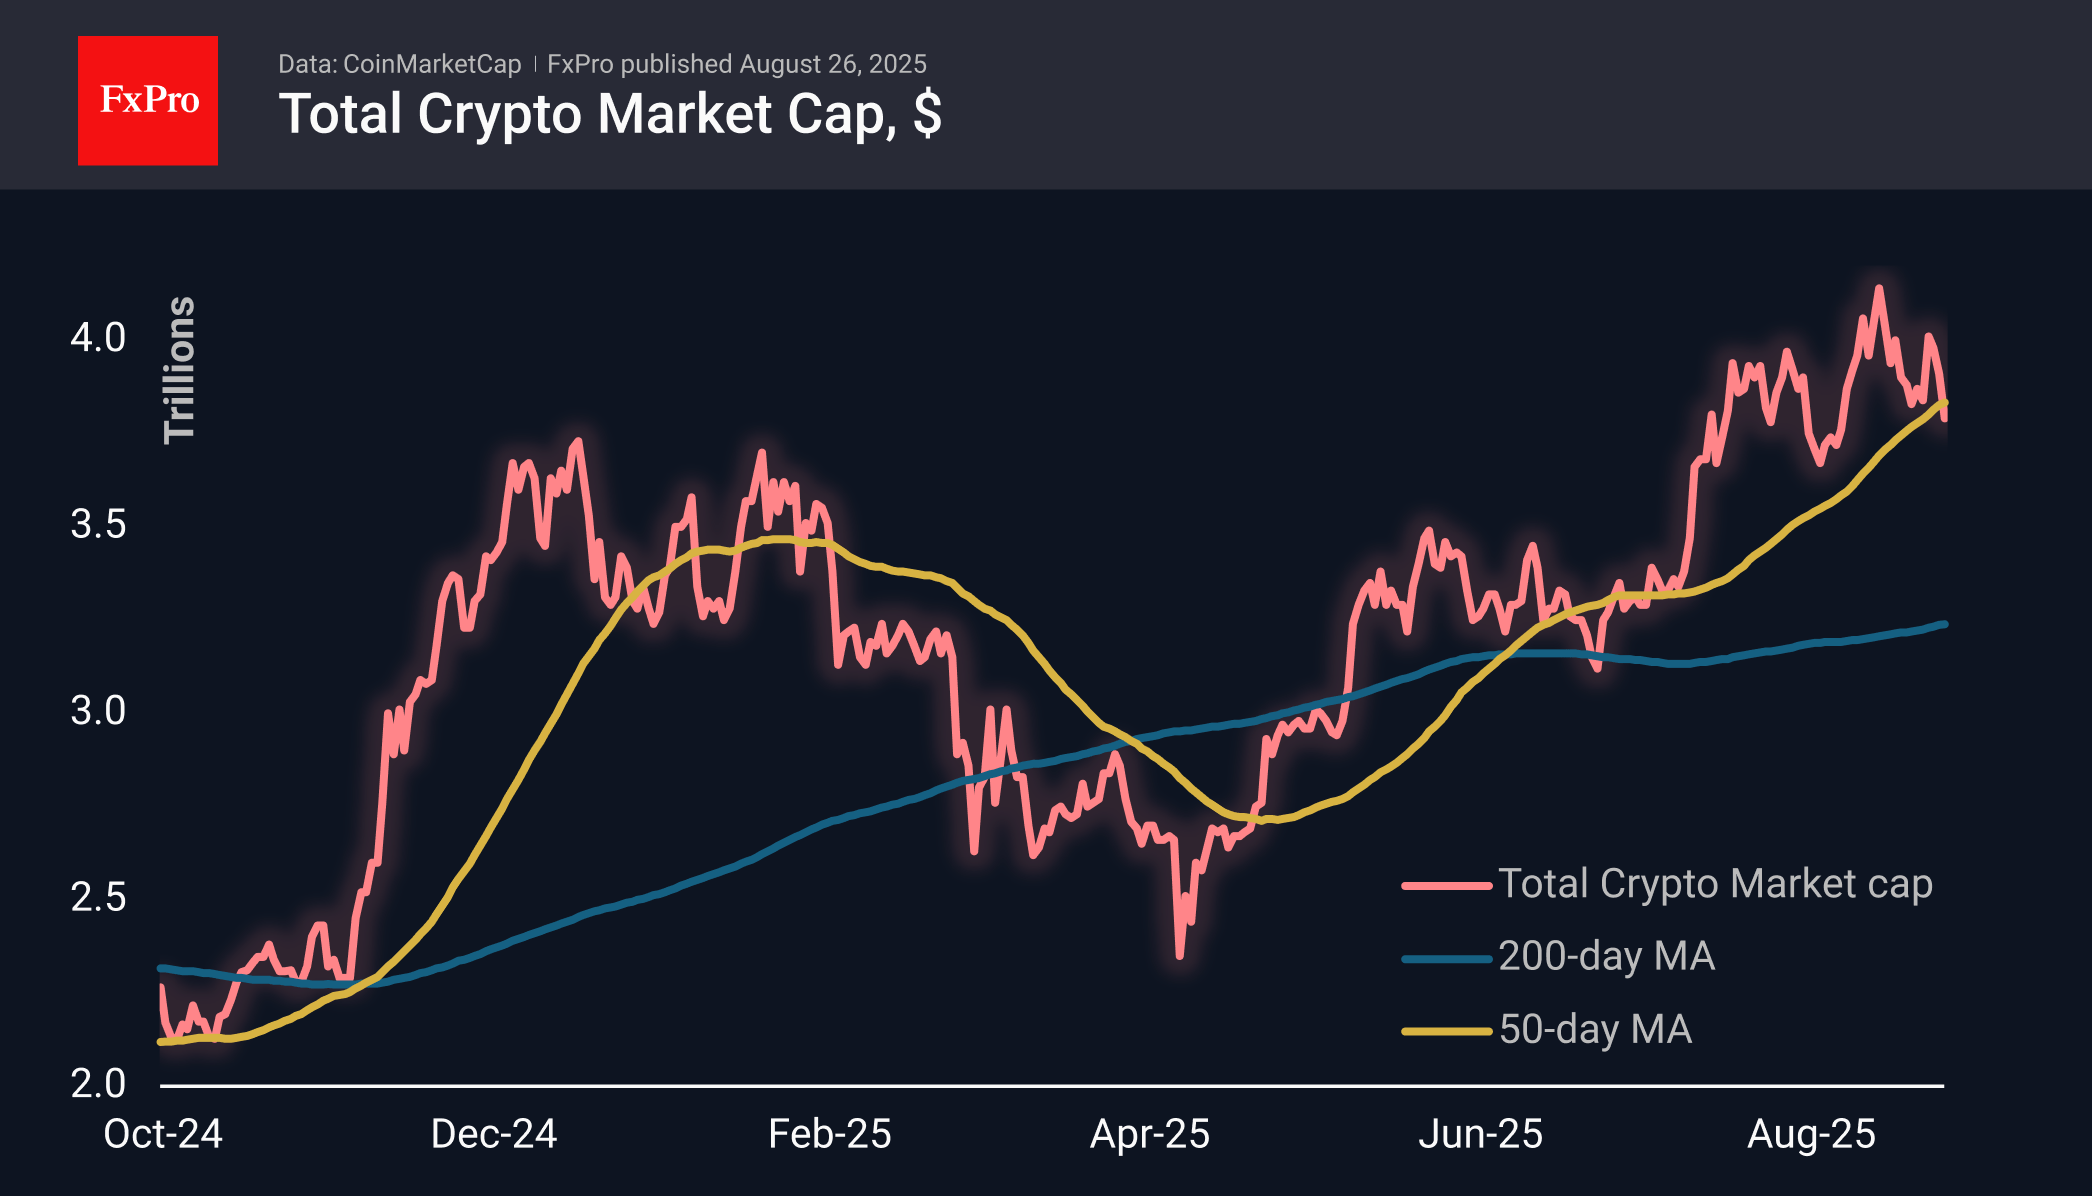
The sentiment index remains fairly stable in neutral territory (48 versus 47 the day before). Declines in this area over the last three months have been close to the bottom of local corrections.
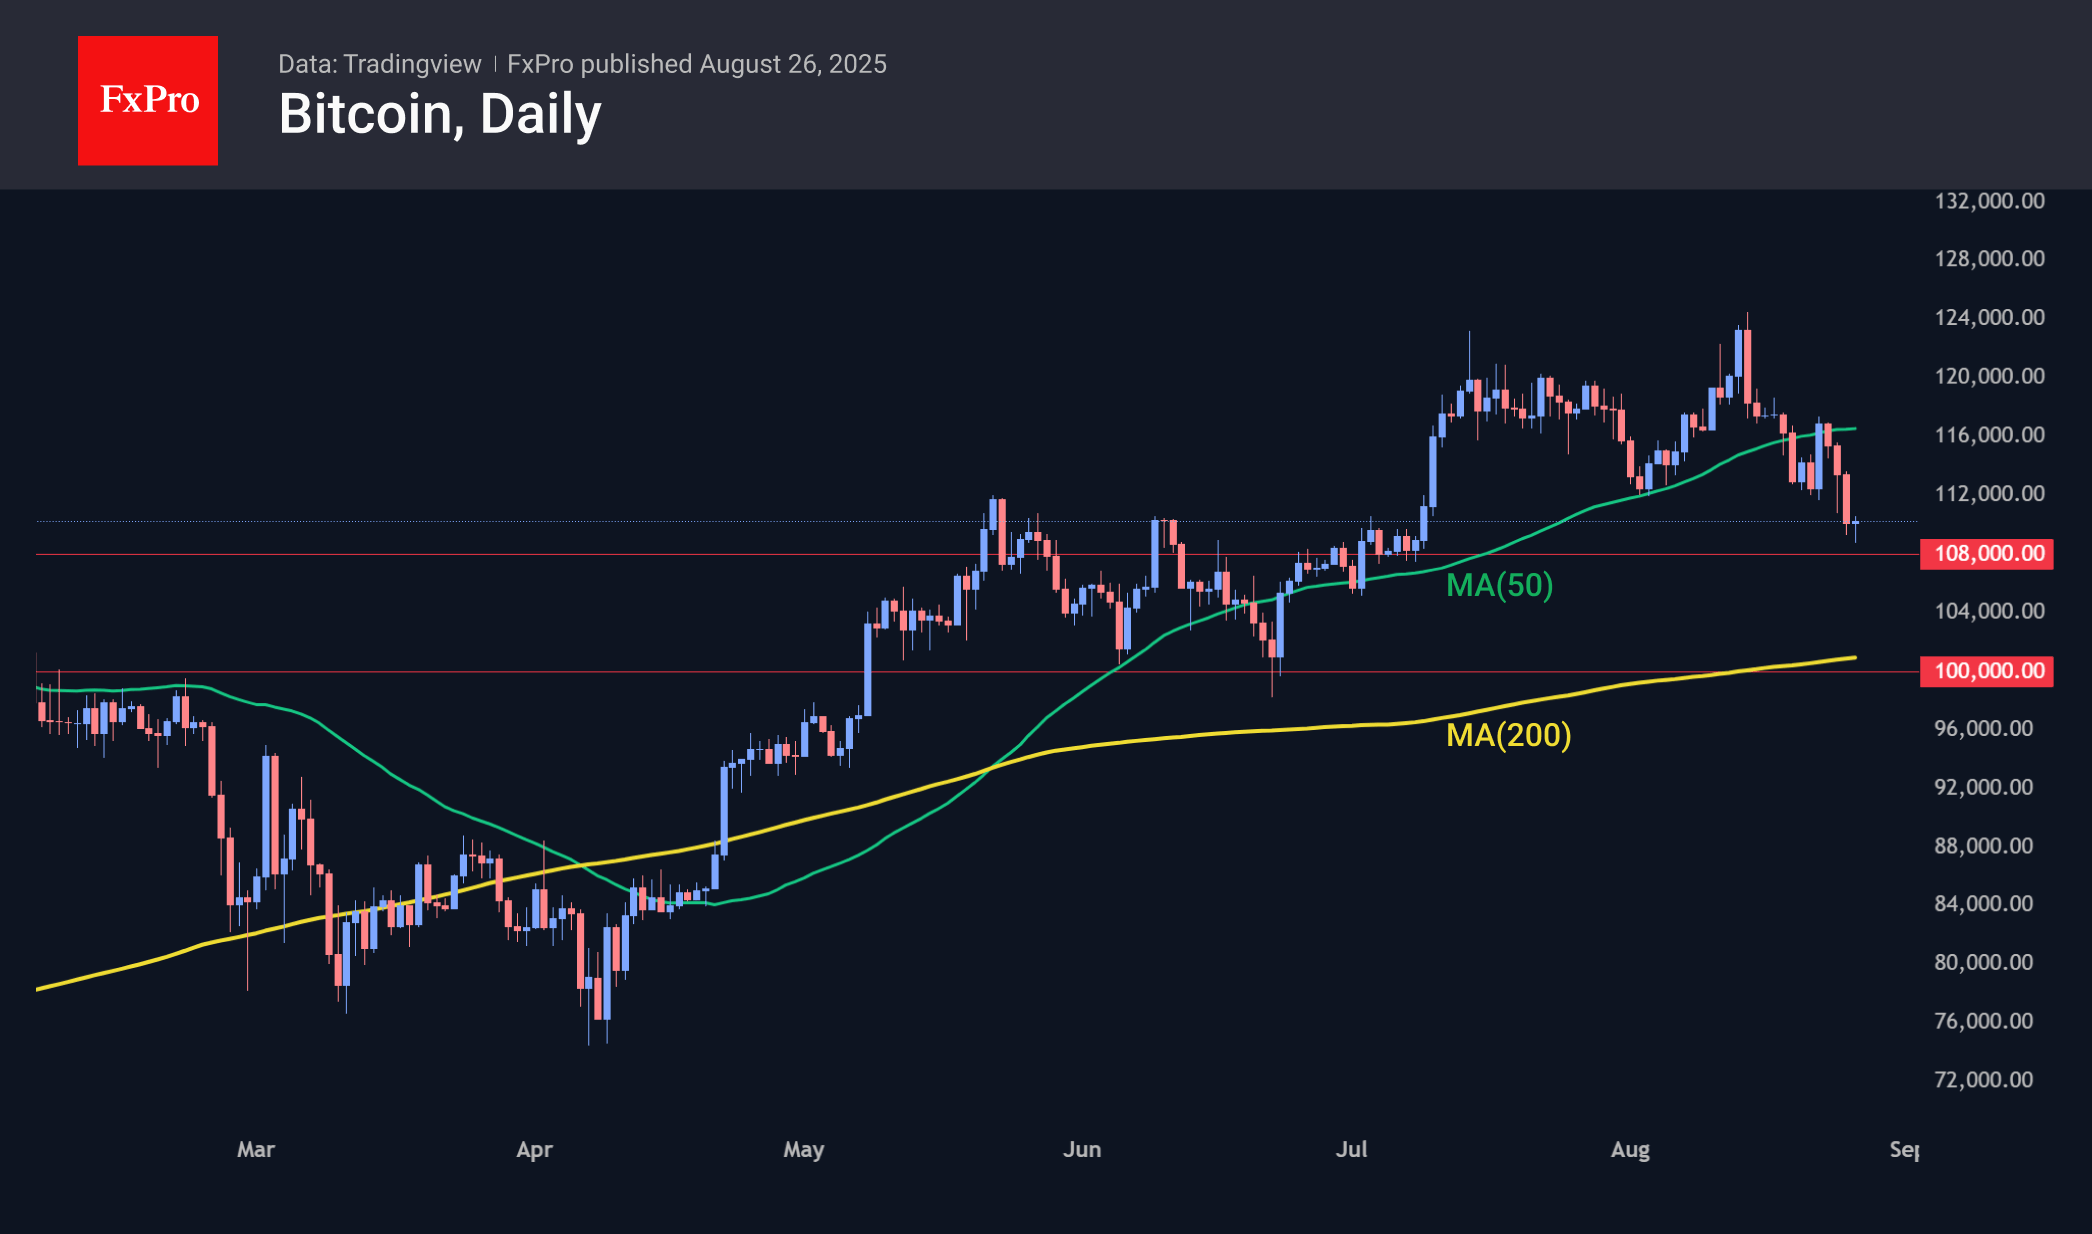
Bitcoin is trading near $110K, dropping to a low of $108.5K. Local attempts to stabilise in BTC are being replaced by even greater sell-offs, leading to new lows in recent days. Bitcoin encountered resistance near current levels in January, May and June. As expected, the former strong resistance is becoming an important support. A failure below it will open the way to $100K. The ability to hold on now will inspire the bulls to make a new push towards the highs.
News Background
Information appeared on X about a large Bitcoin whale that allegedly sold more than 24,000 BTC in a few days, leading to a sharp drop in its price. However, Kronos Research believes that it is difficult to pinpoint a single culprit for the fall in BTC and that it is the result of the actions of several whales.
According to WhaleWire, most of the proceeds were moved to Ethereum. The slow growth of Bitcoin in the current cycle is associated with sales by ‘old whales,’ according to analyst Willy Woo.
The Philippine parliament has proposed creating a strategic reserve of 10,000 BTC. If the bill is passed, the country’s central bank will purchase 2,000 BTC annually for five years.
Japan’s finance minister said that cryptocurrencies could become part of diversified portfolios thanks to the creation of a suitable investment environment. However, he acknowledged that such assets carry high volatility risks.
Economist Harry Dent said that three charts — Bitcoin, Nasdaq 100 and Nvidia — show signs of an impending crash in the next couple of years.
Gold bounces as Trump escalates clash with Fed, but gains lack follow-through
Gold bounced modestly this week as markets digested U.S. President Donald Trump’s unprecedented attempt to fire Fed Governor Lisa Cook. The move marked a sharp escalation in Trump’s long-running feud with the central bank, where he has repeatedly pressed for faster rate cuts but stopped short of threatening Chair Jerome Powell before his term expires next year.
Investors interpreted the move as an effort to reshape the Fed’s balance, raising the risk of a more politically driven policy stance. That uncertainty spurred some safe-haven demand for Gold, but follow-through buying has been limited. The metal remains confined within this month’s 3,300–3,400 range.
In the bigger picture, Gold has been trapped between 3,100 and 3,500 for more than three months. The long-term uptrend remains intact, but it's unsure whether another leg down will unfold before the market finally tests resistance at the 3,500 threshold.
For now, break above near-term resistance at 3,408.21 is needed to signal momentum is turning higher. Without that, Gold’s outlook stays neutral, with sideways trading likely to dominate in the days ahead.
Australian CPI Expected to Jump, Aussie Steady
The Australian dollar is showing limited movement on Tuesday. In the European session, AUD/USD is trading at 0.6482, down 0.01% on the day.
Australian CPI expected to jump to 2.3%
The markets are bracing for an acceleration in Australian CPI on Wednesday. The market estimate stands at 2.3% y/y, compared to 1.9% on June which was the lowest level in over three years. The 1.9% gain was below the Reserve Bank of Australia's 2-3% target range and enabled the RBA to lower rates earlier this month.
If inflation does rise as expected, it would complicate the central bank's plans to continue lowering rates in order to boost economic growth. The RBA minutes from the August meeting noted that inflation remains a concern with risks to inflation in "both directions".
The minutes indicated that members were in agreement that further rate cuts were needed this year but were unclear as to the extent of the easing. Members said that a faster pace of cuts would be appropriate if the labor market softened more quickly than expected or if there were negative developments in the global economy.
The minutes said that upcoming rate decisions would be data-dependent. Investors will be keeping a close eye on employment and inflation data, which are the most critical factors for the central bank in determining its rate path.
The Federal Reserve is widely expected to lower rates at the September meeting, after holding rates since December 2024. Federal Chair Powell's speech at Jackson Hole essentially confirmed a September cut and the US dollar responded with sharp losses against the major currencies. The key question is whether the Fed will cut again in December - that decision will be heavily influenced by the employment and inflation reports.
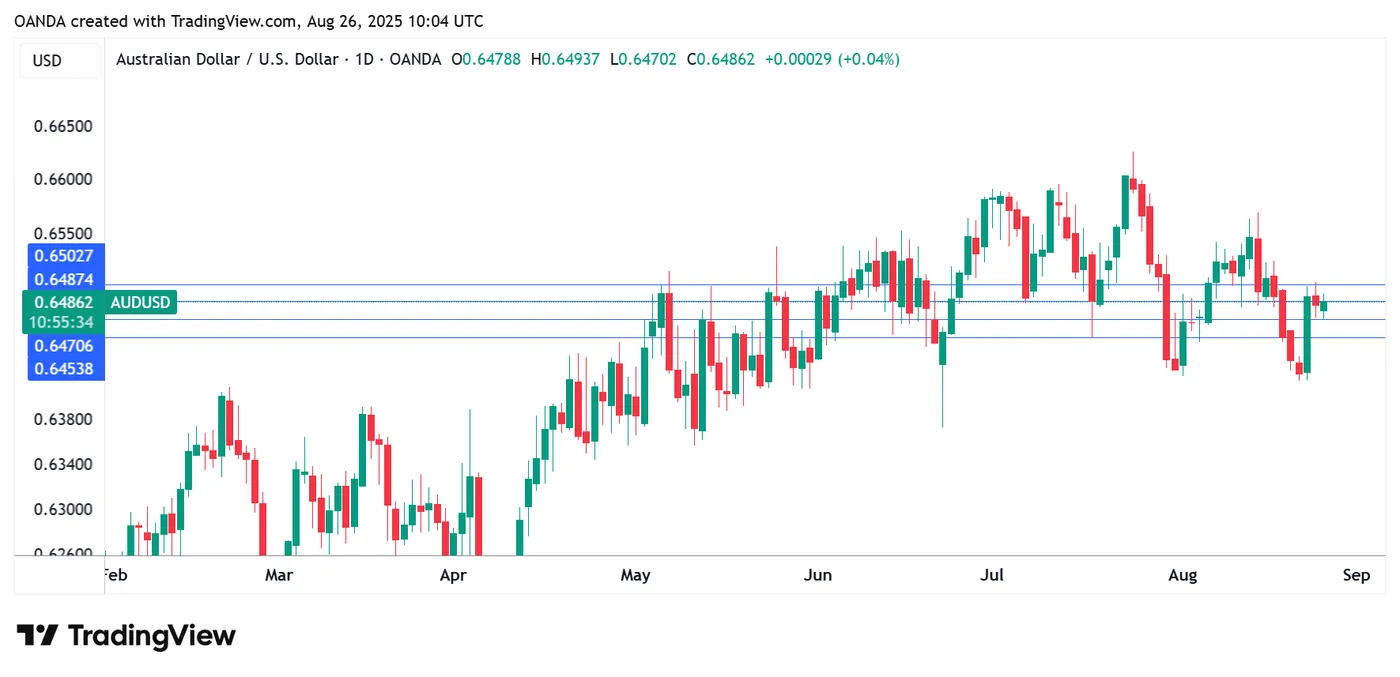
AUDUSD 1-Day, August 26, 2025
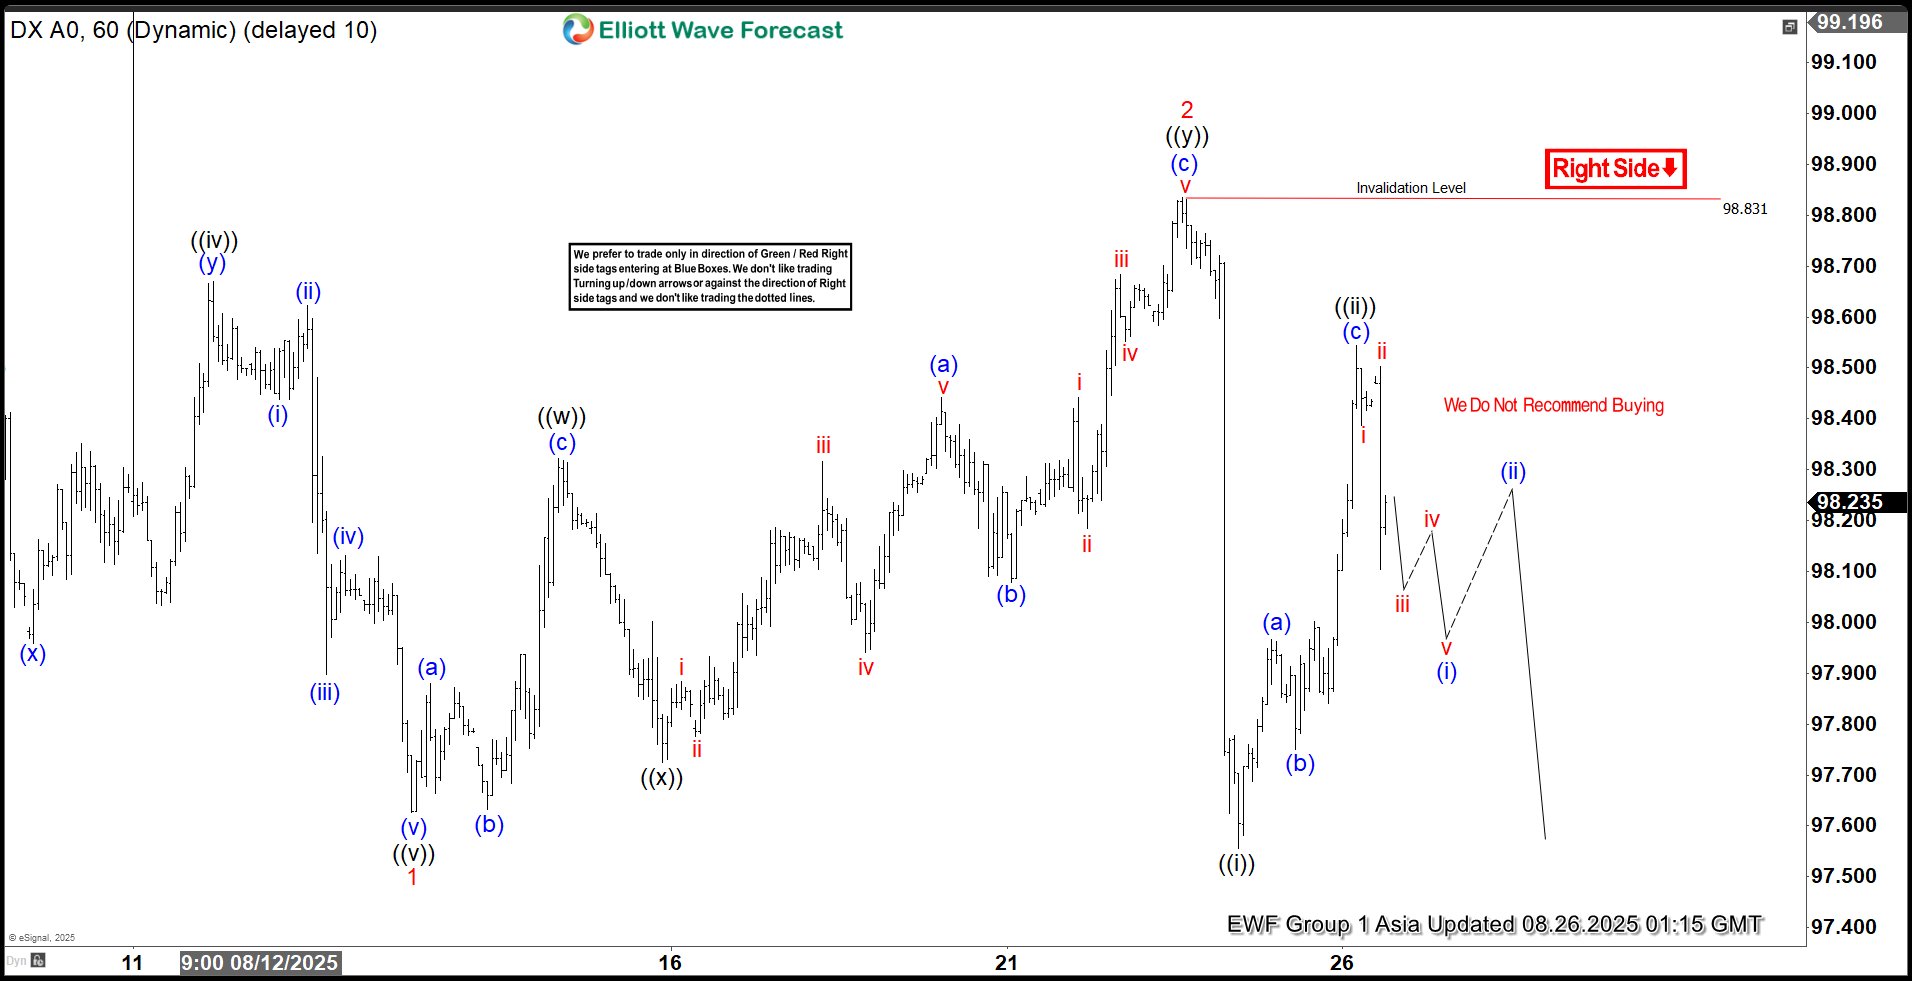
Dollar Index (DXY) Elliott Wave Outlook: Bearish Impulse Aims for 97.3
The Dollar Index (DXY) displays a bearish sequence with lower lows since its August 1, 2025 peak, signaling further downside. The decline from this high unfolds as a five-wave impulsive Elliott Wave structure. From the August 1 top, wave ((i)) concluded at 98.6, followed by a wave ((ii)) rally peaking at 99.07. The Index then dropped in wave ((iii)) to 97.94, with a corrective wave ((iv)) reaching 98.67. The final leg, wave ((v)), completed at 97.62, marking the end of wave 1 in a higher degree.
A corrective wave 2 emerged as a double three Elliott Wave pattern. From the wave 1 low, wave ((w)) climbed to 98.32, followed by a pullback in wave ((x)) to 97.72. The subsequent wave ((y)) peaked at 98.83, finalizing wave 2. The Index has since resumed its decline in wave 3, structured as another five-wave sequence in a lesser degree. From the wave 2 high, wave ((i)) fell to 97.55, and a wave ((ii)) rally reached 98.54. As long as the pivot at 98.83 holds, the DXY should extend lower, targeting 97.3 in the near term. Traders should monitor this pivot for confirmation of the bearish trend.
Dollar Index (DXY) – 60 Minute Elliott Wave Technical Chart:
DXY – Elliott Wave Technical Video:
https://www.youtube.com/watch?v=X035fgSZUps