Sample Category Title
Crypto Markets Enjoy a Bullish Session – ETH, BTC and SOL Technical Outlook
Cryptocurrencies have been a nice way to gauge market mood for the session amid nonexistent volatility in FX and unchanged Equity indices.
And to be honest, it has not been easy to make much of the rangebound action since last Friday's moves failed to continue.
With yesterday's selling in risk assets not being pursued and Cryptos being subject to a decent rebound in today's session, the mood is pretty strong today.
A tone of caution could still be valid, with the current rebound not bringing digital assets to their recent highs, but it is still better than continued downside, at least for crypto aficionados.
Markets could be awaiting Thursday's US GDP release before the next pump, but the real waiting game might be until September 5th, for the upcoming Non-Farm Payrolls figure.
Consolidating at relative highs is still far from a bearish sign, as zig-zagging action would imply indecision, not precisely the same as Market fear.
Let's see where this takes Ethereum, Bitcoin and Solana through their own multi-timeframe chart analyses.
An overlook on the Crypto Market
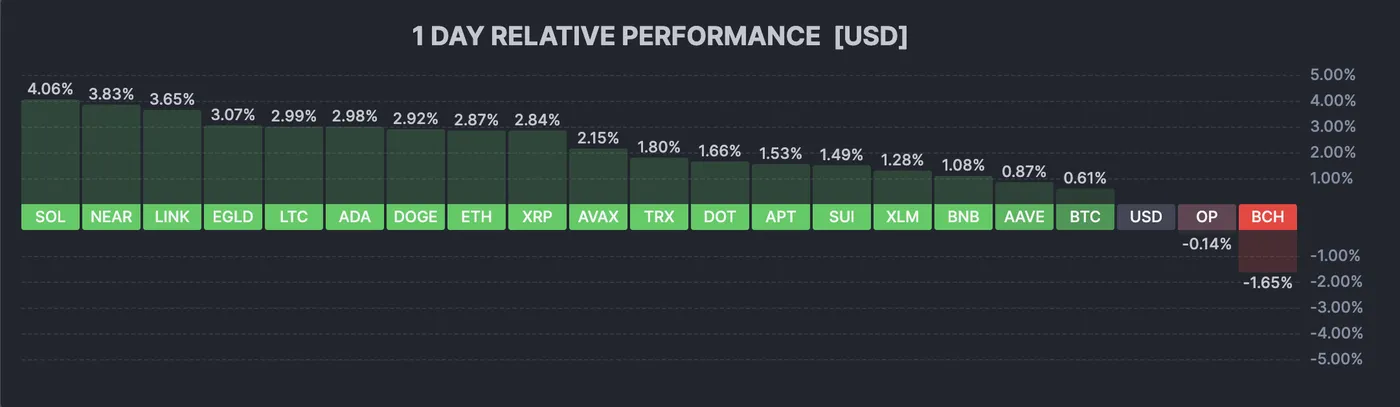
Crypto Market overview, August 26, 2025 – Source: Finviz
The picture is mostly green but it seems that a few altcoins have started to retract from their recent highs – Still, minor coins are leading the upside with Solana up above 4% (chart below) and LINK, EGLD and XRP to name a few are up between 2.5% to 3.5.%
Ethereum, Bitcoin and Solana technical analyses
Ethereum (ETH) 4H Chart
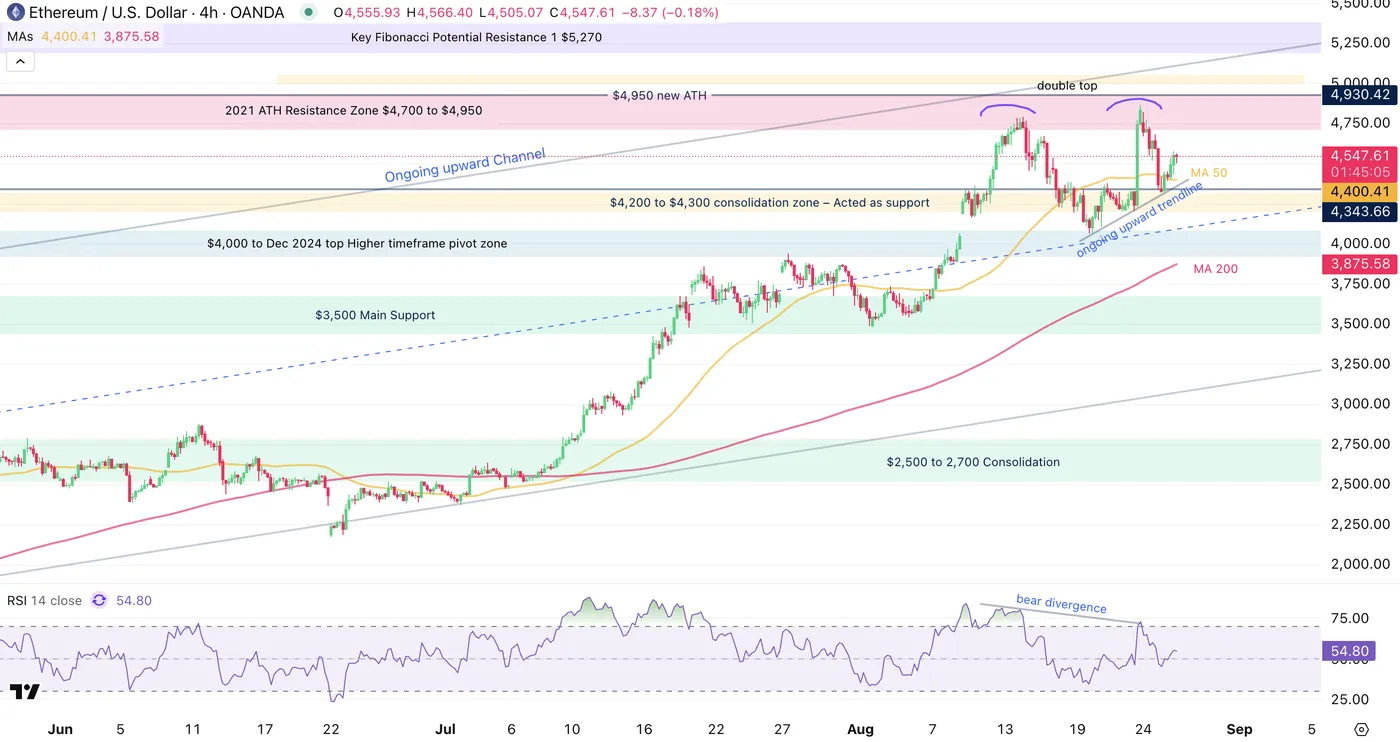
Ethereum 4H Chart, August 26, 2025 – Source: TradingView
Bulls are holding a decent move, supported by a short-timeframe upward trendline – Current trading is stepping against the 50% fibonacci of yesterday's retracements.
For a better long-term outlook, it would be better for this current move to retest the previous highs.
If not, the scenarios are either for consolidation (between $4,000 to $4,700 highest probability) or an actual lower retracement to retest the up-trend (which could lead the Top #2 crypto to $3,500).
For now, the action is balanced and bulls have the control for the session.
Levels of interest for ETH trading:
Support Levels:
- $4,200 to $4,300 consolidation Zone (most recent rebound)
- $4,000 to $4,095 Main Long-run Pivot
- $3,500 Main Support Zone
Resistance Levels:
- $4,950 Current new All-time highs
- $4,700 to $4,950 All-time high resistance zone
- Potential main resistance $5,230 Fibonacci extension.
Bitcoin (BTC) 4H Chart
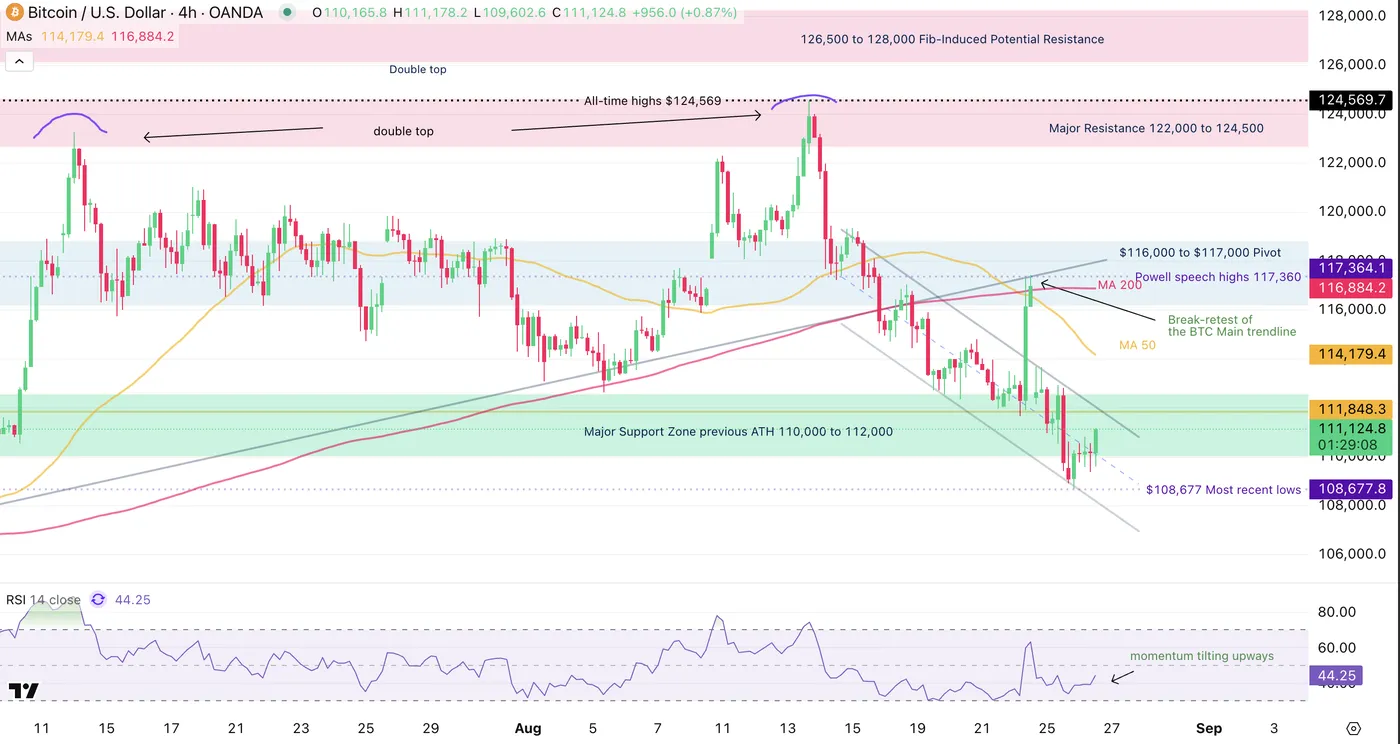
Bitcoin 4H Chart, August 26, 2025 – Source: TradingView
The most recent correction did print below the Support Zone, marking lows at 108,677, but bulls are reacting to it and trying to push the Main Crypto back upwards.
However, the price action is still evolving within a short-term descending channel (see on chart) after a break-retest of the main upward trendline.
Overall, the picture is mixed, therefore the most impatient participants will want to look at where the market closes at the end of the week – Staying around or above the 110,000 to $112,000 support zone is the most favorable case for the Crypto market.
Below would suggest a continued correction.
Levels of interest for BTC trading:
Support Levels:
- $110,000 to $112,000 previous ATH support zone (currently tested)
- $106,000 Minor support
- $100,000 Main support at psychological level
Resistance Levels:
- $115,000 to $117,000 Pivot Zone (most recent rejection)
- Major Resistance $122,000 to $124,500
- Current all-time high $124,596
Solana (SOL) 4H Chart
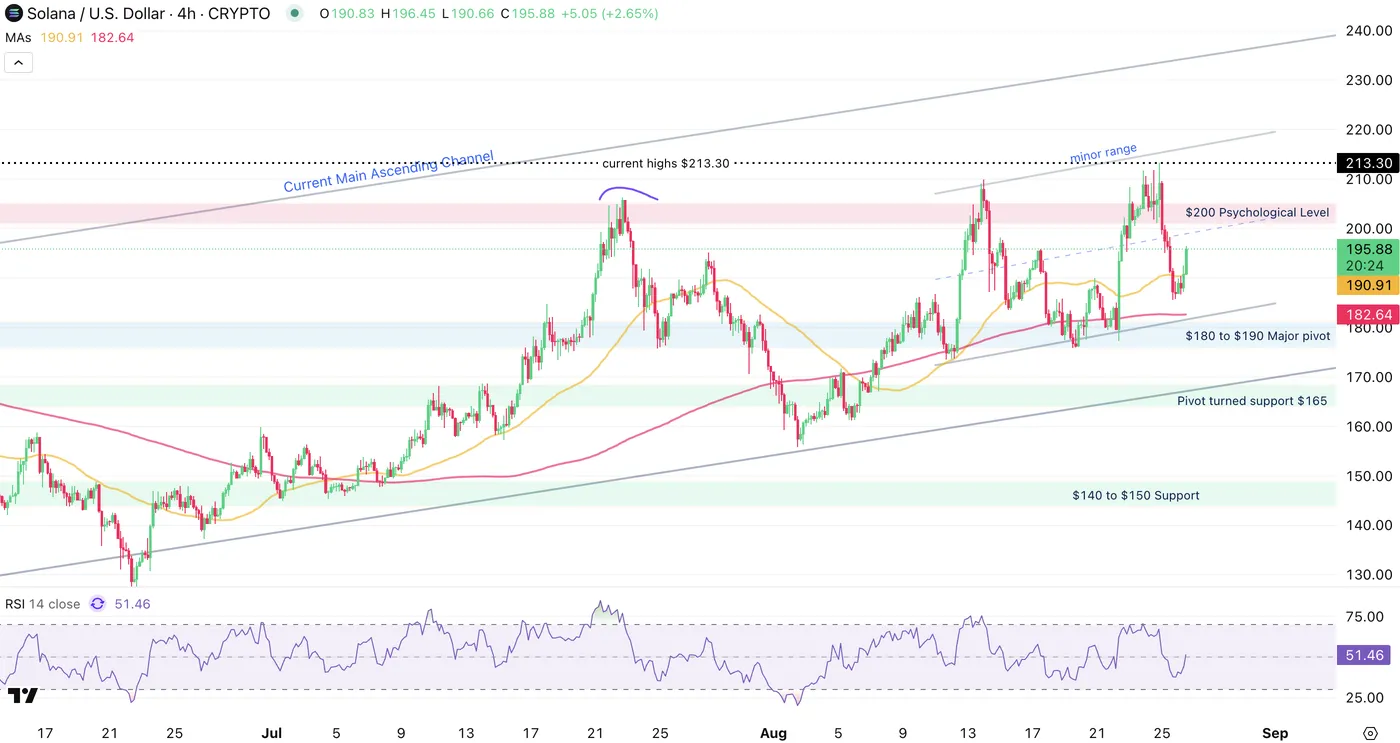
Solana 4H Chart, August 26, 2025 – Source: TradingView
Momentum is decent with the 4H RSI going above neutral for the top #3 Coin.
The altcoin is leading its colleagues and going towards the $200 level at a confluence with the middle of the higher timeframe upward chanel, with the short-term action evolving in a minor range.
Switches to momentum are swift in cryptos and particularly Solana (as other altcoins), so keep an eye at Market reactions when prices reach the high of the minor channel ($215 to $220.
Levels of interest for SOL trading:
Support Levels:
- $186 most recent swing lows
- $180 to $190 Major pivot
- Key support $160 to $165
Resistance Levels:
- $200 Psychological Level and middle of higher timeframe upward channel
- current highs $213 and top of Minor range
- Current all-time high $295
Safe Trades!
BTCUSD: Holding Below Daily Cloud Base to Keep Bears in Play for Further Weakness
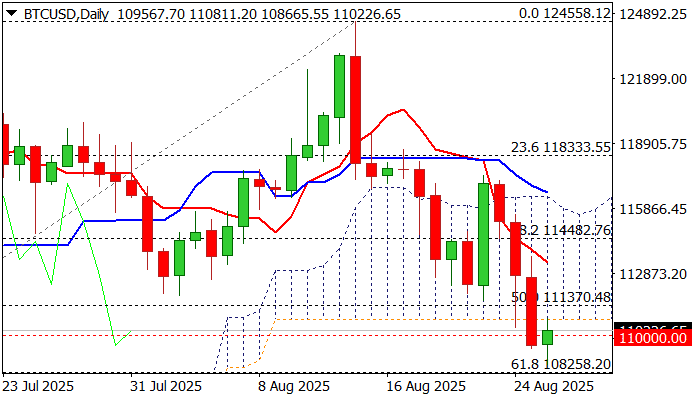
BTCUSD is consolidating after a sharp fall in past three days (down over 6%), mainly driven by strong institutional selling.
The price edged higher after hitting six-week low today, although the upside remains limited and warning of persisting downside pressure.
The latest fall broke through key supports at 111370 (50% of 98182/124558 rally / 100DMA), 110722 (base of thick daily cloud) and 110000 (psychological).
Violation of these levels generated strong bearish signal, with repeated daily close below, to validate signal and risk deeper correction from new all-time high.
Bears eye initial target at 108258 (Fibo 61.8%), with stronger acceleration to target 105097 (July 2 higher low) and 104407 (Fibo 76.4%).
Daily studies remain firmly bearish, with thick daily cloud weighing on price action, MA’s in full bearish configuration and very strong bearish momentum, with oversold Stochastic to partially counter pressure.
Ideally, consolidation should stay under the cloud, before larger bears regain full control again.
Only sustained break above 100DMA would diminish downside risk and allow for stronger correction of 117169/108665 bear-leg.
Res: 110000; 110370; 110772; 111634
Sup: 109379; 108665; 108258; 107419
Gold Wave Analysis
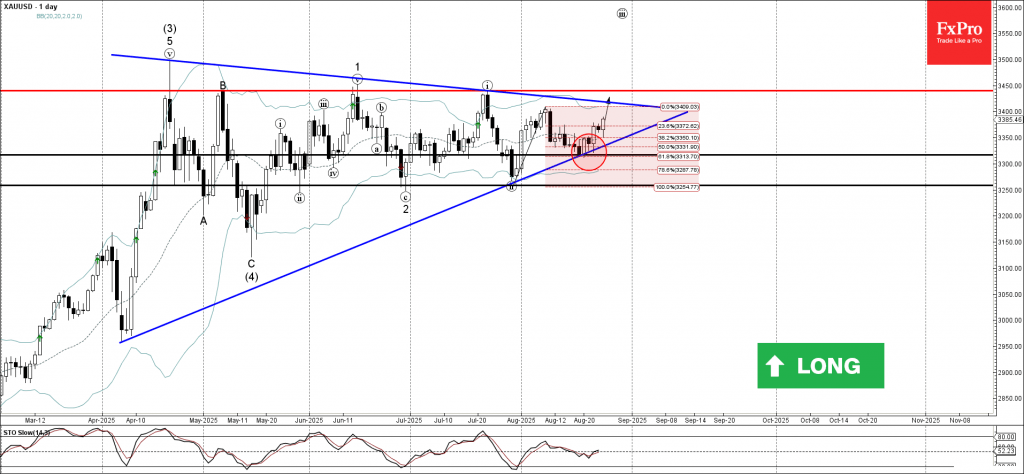
Gold: ⬆️ Buy
- Gold reversed from the key support level 3315.00
- Likely to rise to resistance level 3450.00
Gold recently reversed up from the key support level 3315.00, intersecting with the support trendline of the daily Triangle from April.
The upward reversal from the support level 3315.continues the active short-term impulse wave iii of the higher order impulse waves 3 and (5), from May.
Given the clear daily uptrend, Gold can be expected to rise to the next resistance level of 3450.00 (the former monthly high from July).
AUDUSD Wave Analysis
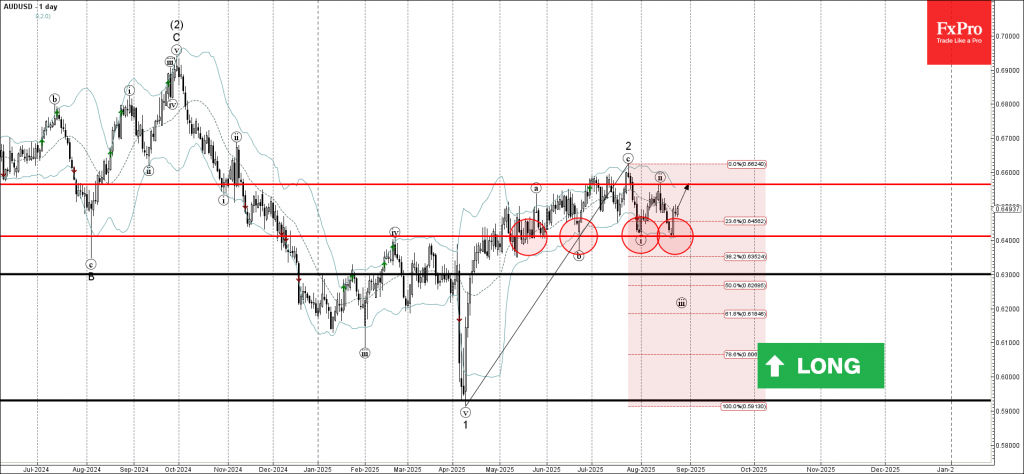
AUDUSD: ⬆️ Buy
- AUDUSD reversed from key support level 0.6400
- Likely to rise to resistance level 0.6565
AUDUSD currency pair recently reversed up from the key support level 0.6400 (which has been reversing the price from May) standing near the lower daily Bollinger Band.
The upward reversal from the support level 0.6400 created the daily Japanese candlesticks reversal pattern Morning Star Doji.
AUDUSD currency pair can be expected to rise to the next resistance level 0.6565 (top of the previous minor correction ii).
What’s driving the US Dollar after Powell’s Friday remarks? Dollar Index (DXY) outlook
The US Dollar has been in a weird trading zone since the contradicting NFP report from the beginning of the month (forcing a dovish hand) and the strong PPI report that has shown the appearance of tariff effects (forcing a hawkish hand).
Since, the odds for a September cut have held tight, despite regressing slightly (was up to 97% before the PPI report but re-corrected back to around 87% currently).
The confusion stands from a FED Chair having changed his tone at his Jackson Hole speech last Friday, which tends to be considered a pre-emptive sign of a cut approaching sooner than later.
However, Market reactions may have been exaggerated for the little advances he mentioned towards a larger Sep cut or even a prolonged/fast-pace cut cycle.
Hence, the US Dollar caved on the Friday session before rebounding yesterday.
The past two weeks of Forex trading have pretty much dawdled around with no direction found – The September Cut is almost a sure thing by now, particularly after US President Trump fired another Federal Reserve governor Lisa Cook, who was appointed by President Biden in 2022.
But these questions remains:
How much can the FED really cut to avoid inflation coming back?
Inflation expectations are high and the warning from PPI wasn't one to neglect.
Is it already too late to prevent a Job market harsh slowdown?
The previous Non-Farm Payrolls report was a scary one, with job creation already slowing down (despite demand also slowing down). The next one is coming up on September 5th.
Dollar Index multi-timeframe Analysis
US Dollar Daily Chart
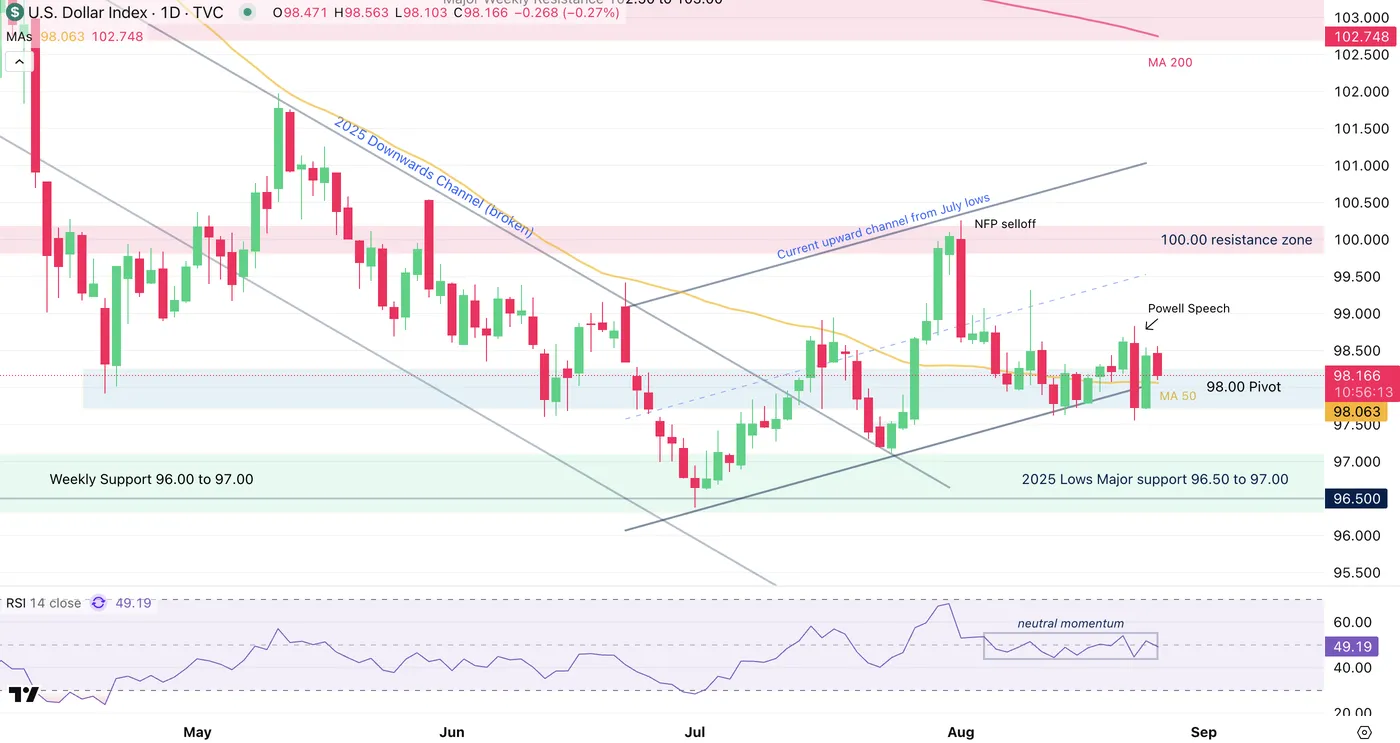
Dollar Index (DXY) Daily Chart, August 26, 2025 – Source: TradingView
The Greenback has been held in a 1000 pip consolidation since the past 10 sessions.
One would have thought that it was the end for the USD after Friday's reactions to Powell, but as explained in the introduction, it seems that Markets have backed up on their Friday ecstatic reactions – This can be seen in Cryptos and Equities not continuing their up-moves and even retracting.
Consolidating around the 98.00 Pivot, a key milestone for the current trading, Markets will await further data to try to find direction.
Look at how flat the RSI has been since the 13th of August.
US Dollar 4H Chart
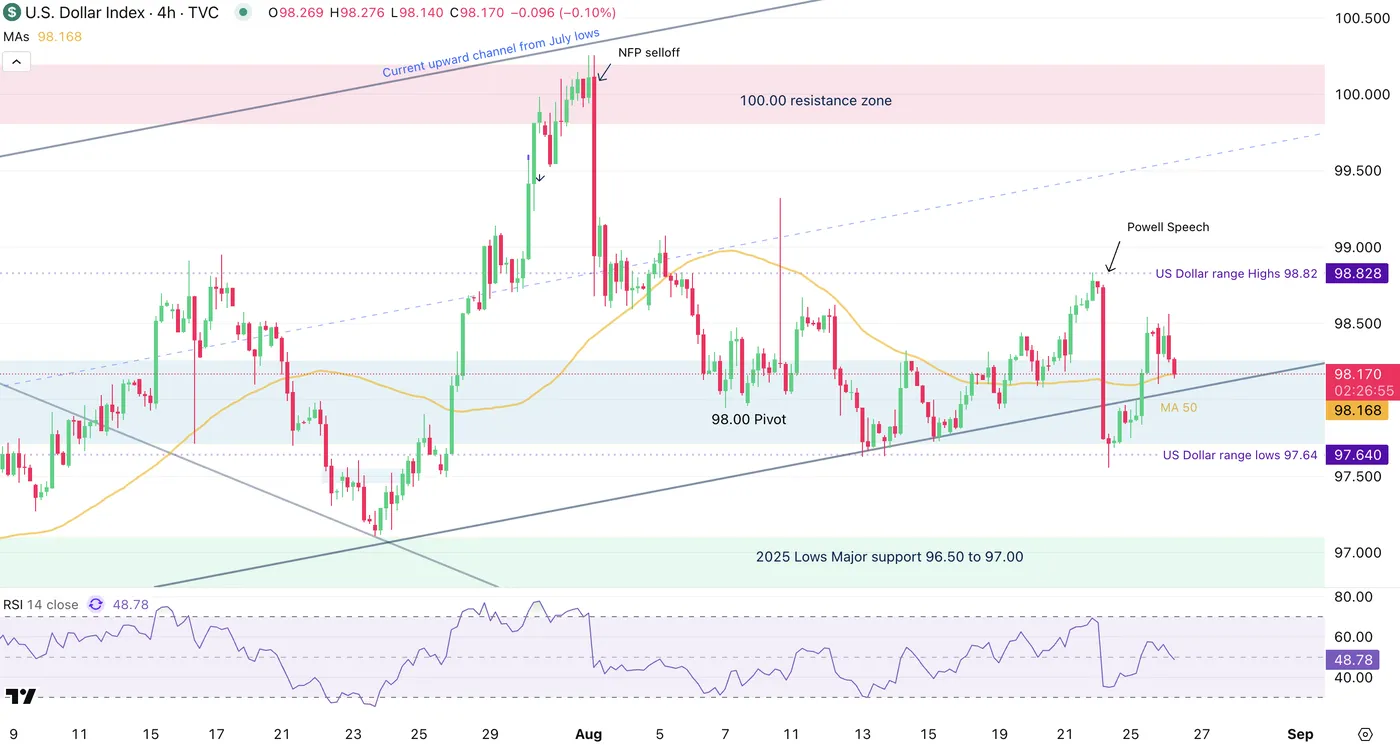
Dollar Index (DXY) 4H Chart, August 26, 2025 – Source: TradingView
The US Dollar is still holding its low-slope ascending channel despite having reasons to break out from it.
As seen on the chart, the DXY is held between 98.80 range highs and 97.60 range lows, with the 50-period MA just holding in the middle of the range (98.17)
The narrative would imply downward movement to the USD but the move may have happened throughout the first part of 2025! In case you forgot, the DXY was at 110.00 just in January.
So that leaves the overall direction subject to change, where data slowing down the extent of cuts pricing in would make the US Dollar rebound.
Levels of interest for the Dollar Index:
Support Levels:
- 50-period MA acting as immediate support (98.17)
- Lower bound of the upward channel and low of 98.00 pivot zone (97.60)
- 2025 Lows Major support 96.50 to 97.00
Resistance Levels:
- US Dollar range Highs 98.82
- Mid-line of the ascending channel and psychological level 99.50
- 100.00 Main resistance zone
You may expect further consolidation in FX and other markets in the waiting of more data (Core PCE is approaching on Friday).
Safe Trades!
WTI Oil Retreats From Near Three-Week Highs as Pessimism Grows Around Russia/Ukraine Deal
Oil prices dropped by over 1% after they had risen by almost 2% on Monday to start the week on the front foot. Traders are watching the war in Ukraine and the possibility of interruptions to Russia's oil supply.
Brent crude oil fell by $1.08, or 1.57%, to $67.72 per barrel. It had reached its highest price since early August just a day earlier. West Texas Intermediate (WTI) crude oil also dropped, losing $1.13, or about 1.74%, to $63.67.
The rally yesterday was largely driven by Russian supply fears as Ukraine struck Russian energy infrastructure. Add to this the rhetoric by President Donald Trump in which he adopted a rather pessimistic tone regarding a Russia/Ukraine peace deal and the perfect conditions were created for a short-term rally.
US President Donald Trump has again threatened to impose sanctions on Russia if a peace deal isn't made in the next two weeks.
However, sources have told Reuters that U.S. and Russian officials have been discussing energy deals on the side during recent peace talks about Ukraine.
This is in stark contrast to the US rhetoric against India over its continued purchases of Russian Oil. India remains the third largest buyer of Russian crude oil with a potential 50% tariff being levied by the US as a result.
Oil market Facing a Host of Challenges
Market participants are hesitant to make long-term commitments in the oil market. This is because there is so much uncertainty due to the conflict in Ukraine and the trade disputes.
There are still concerns around how tariffs and trade deals will impact Oil demand in Q3 and Q4 of 2025 and this could leave Oil prices in limbo with a lot of choppy price action for the foreseeable future.
US API Data Up Next
The American Petroleum Institute (API) will release its latest inventory data later today.
This comes after the API reported that U.S. crude stocks fell by 2.4 million barrels two weeks ago, more than the expected 1.2 million-barrel drop, showing stronger demand. Official data from the U.S. Energy Information Administration (EIA) will be released tomorrow as well.
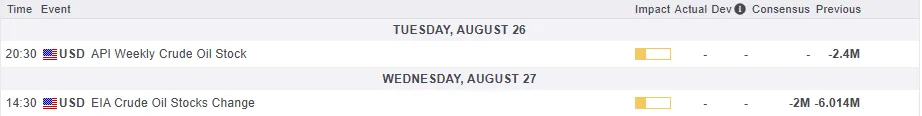
For all market-moving economic releases and events, see the MarketPulse Economic Calendar. (click to enlarge)
Technical Analysis - WTI
From a technical analysis standpoint, Oil has retested the triangle pattern which it broke out of on August 6.
WTI is also back below the 100-day MA with a four-hour candle close below the MA taking place.
The four-hour candle closed with no wick to the downside, a sign of the momentum?
Oil has recorded a change in structure following the recent bullish rally and as long as price holds above the swing low at 62.50, bulls will remain hopeful of further upside potential.
Immediate resistance rests at the 65.00 handle before the 65.50 and 67.00 handles come back into focus.
A move lower from her will need to record a four-hour candle close below the 62.50 handle which could open up a retest of the August 20 lows around the 61.80 and potentially even lower.
WTI Oil Daily Chart, August 26, 2025
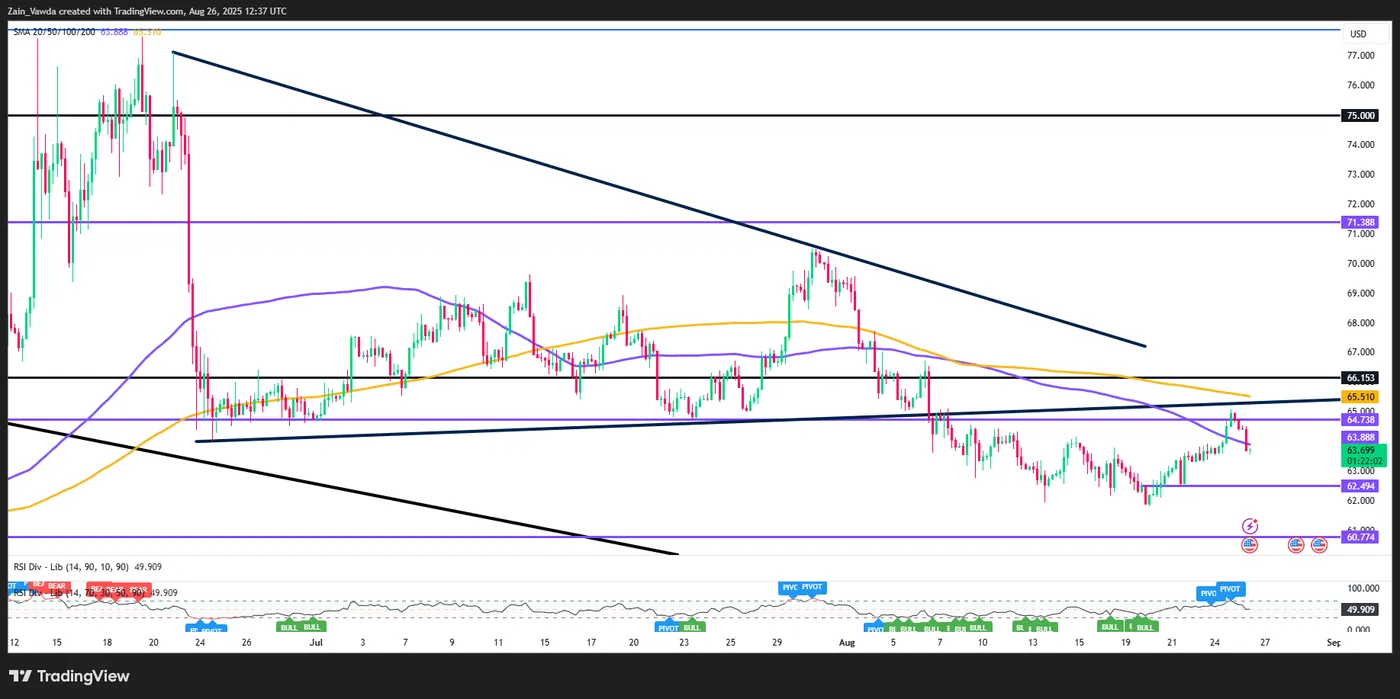
Source: TradingView (click to enlarge)
Sunset Market Commentary
Markets
One day after calling a no-confidence vote (September 8) in his government, the dies for French PM Bayrou have already been cast. All main opposition parties (stretching from far left over Socialists to the extreme right RN) said that they would vote against the minority centrist government looking for support on their proposed fiscal tightening plans. And while Socialists said that they would still come up with their own, less stringent, budget proposal (think >= 5% of GDP deficit instead of the 4.6% target from Bayrou) ahead of the vote, it’s very unlikely that they’ll be able to gather sufficient support for it, not least because of the short deadline aside from ideological differences. If Bayrou loses the confidence vote he can still stay on as a caretaker PM given difficulties to find a successor in the country’s hung parliament. French political parties are on top wary not get punished in local elections (March 2026) for the current institutional/budgetary crisis. A new parliamentary ballot ahead of year-end is therefore gaining traction as most likely scenario out (?) of this mess. Election polls and the French two-round voting systems suggest no clear winner at the moment, nor left, nor right. With the early October budget deadline rapidly approaching, any caretaker government can vote to prolong the current budget (even into 2026) awaiting more political clarity. The 10-yr French swap spread touched 83 bps this morning, before slightly falling back to 81 bps (from 76 bps yesterday). French stocks underperform (-1.5%), dragging down EU stock markets with them (-0.75%). The country is at risk of falling into single “A” category at credit rating agency Fitch early September. EUR/USD trades up and down between 1.16 and 1.1650 with US president Trump’s call for the resignation of Fed governor Cook (effective immediate) being a new low point in the political campaign which is putting the credibility of the US central bank at stake. US eco data published so far (better core goods orders in July; falling but near consensus US housing prices) didn’t leave a trace on markets. Long end of core bond yield curves underperform today. The damage in Europe is smallest (30-yr flat) with the US 30-yr and UK 30-yr yield (who else?) adding 2.6 bps (2-yr) and 6.8 bps (30-yr) respectively. Later today, the US Treasury kicks off its end-of-month refinancing operation with a $69bn 2-yr Note auction.
News & Views
In Japan’s next financial year budget draft seen by Reuters, the finance ministry is asking for a record 32.4tn JPY (around $220bn) for debt servicing costs. The numbers are a chill reminder of how the interest rate environment fundamentally changed in Japan and beyond. Japan is carrying a debt load more than twice the size of its economy after decades of very loose fiscal policy that was basically bankrolled by the central bank through quantitative easing and ultralow interest rates. The draft budget now assumes a 2.6% (long-term) interest rate, up from 2% in the current year’s budget and the highest in 17 years.
The Hungarian central bank (NBH) kept the policy rate steady at 6.5% today. It said that price stability, ie inflation sustainably returning to the 3% mid-point target can only be achieved by ensuring tight monetary conditions given buoyant consumption, volatile commodity prices and strong wage dynamics. Inflation eased to 4.3% in July (4% for core measures) and is expected to remain above the NBH’s tolerance band (3% +1 ppt) for the rest of the year. Household inflation expectations, meanwhile, remained at a high level and the decrease in short-term corporate price expectations slowed last month. The NBH continues to assume economic growth to pick up from next year, thanks to stronger consumption dynamics and increasing exports against the backdrop of a broader European economic recovery. Today’s decision including the hawkish statement was widely expected, resulting in a stoic HUF reaction. EUR/HUF trades marginally weaker on the day around 397.
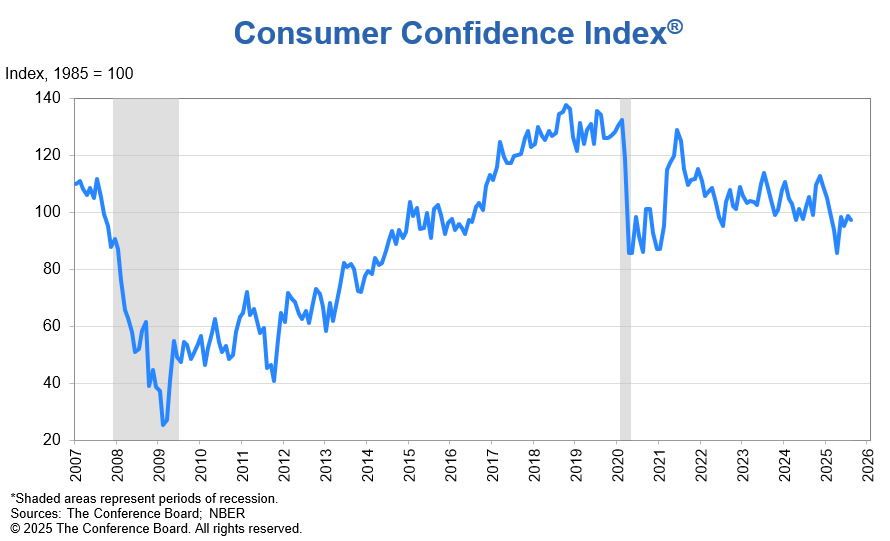
US consumer confidence edges up to 97.4, inflation expectations rise to 6.2%
U.S. Conference Board Consumer Confidence rose slightly in August, edging up to 97.4 from 97.2, beating expectations of 96.3. The modest gain masked underlying weakness, however, with Present Situation Index slipping to 131.2. Expectations Index fell to 74.8, staying well below the 80 threshold that typically signals a recession ahead.
The details showed consumers were less upbeat about the labor market, with job availability perceptions declining for an eighth straight month. At the same time, optimism about future income faded, even as expectations for future business conditions improved modestly. The Conference Board noted that consumer confidence has effectively plateaued at recent levels.
Inflation expectations added a note of caution, rising to 6.2% in August from 5.7% in July after three months of declines. While still below April’s 7.0% peak, the uptick underscores persistent concerns about price pressures.
USD/CHF Mid-Day Outlook
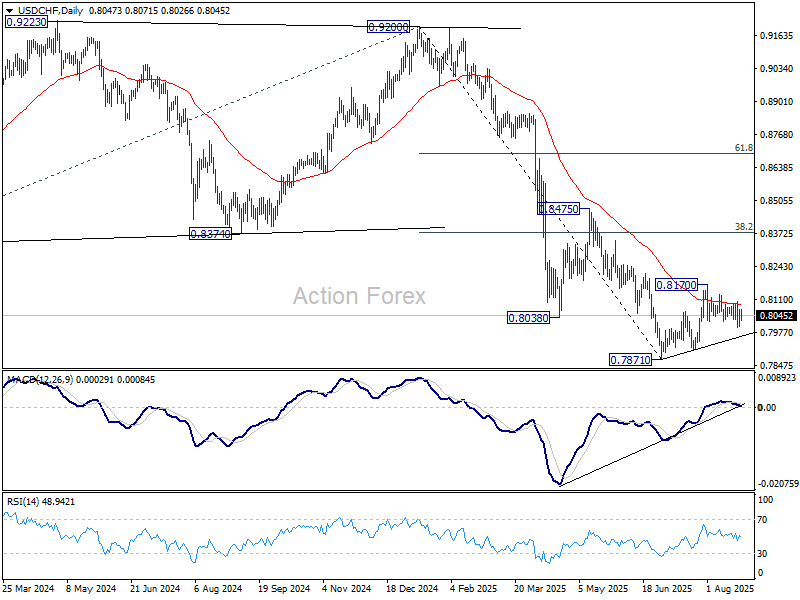
Daily Pivots: (S1) 0.8019; (P) 0.8045; (R1) 0.8084; More….
Intraday bias in in USD/CHF stays neutral at this point. Another fall is in favor as long as 0.8103 resistance holds. Below 0.7999 will target a retest on 0.7871 low. However, break of 0.8103 will turn bias to the upside, and target 0.8170, to extend the corrective pattern from 0.7871.
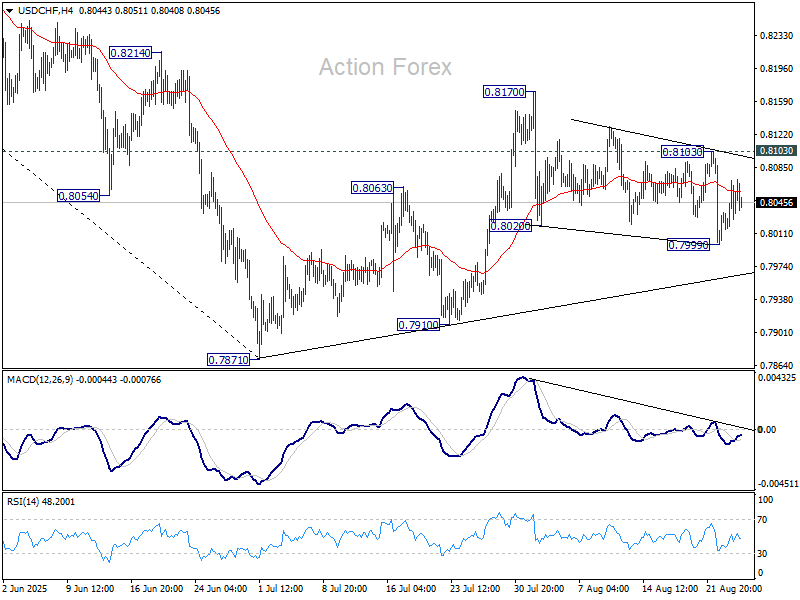
In the bigger picture, long term down trend from 1.0342 (2017 high) is still in progress. Next target is 100% projection of 1.0146 (2022 high) to 0.8332 from 0.9200 at 0.7382. In any case, outlook will stay bearish as long as 0.8475 resistance holds.