Sample Category Title
GBP/JPY Daily Outlook
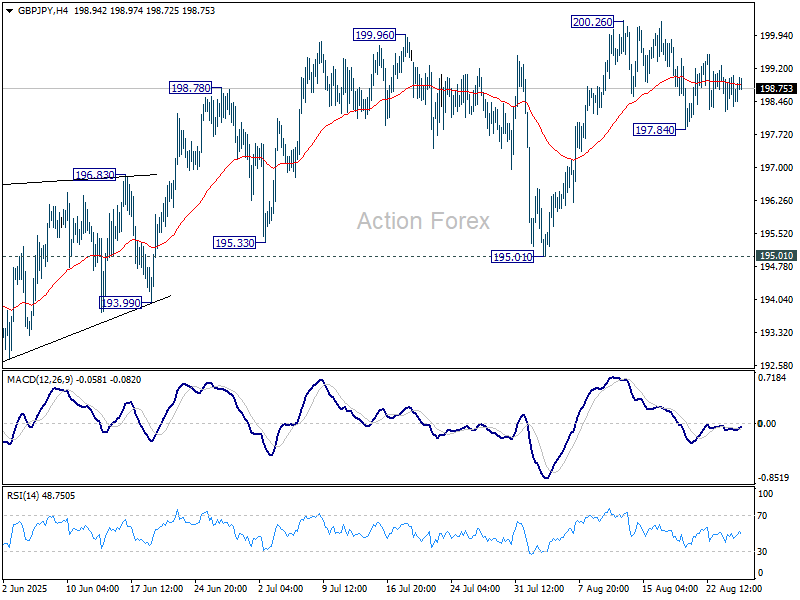
Daily Pivots: (S1) 198.18; (P) 198.80; (R1) 199.33; More...
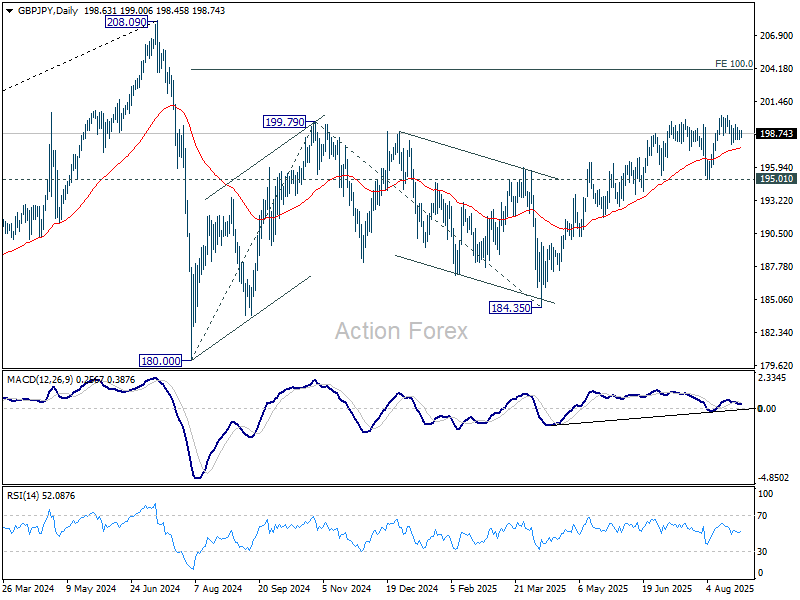
Range trading continues in GBP/JPY and intraday bias remains neutral. While another fall cannot be ruled out, near term outlook will stay bullish as long as 195.01 support holds. On the upside, firm break of 2002.6 will resume the whole rise from 184.35 to 100% projection of 180.00 to 199.79 from 184.35 at 204.14.
In the bigger picture, price actions from 208.09 (2024 high) are seen as a correction to rally from 123.94 (2020 low). The pattern might still extend with another falling leg. But in that case, strong support should be seen from 38.2% retracement of 123.94 to 208.09 at 175.94 to contain downside. Meanwhile, decisive break of 208.09 will confirm long term up trend resumption.
EUR/JPY Daily Outlook
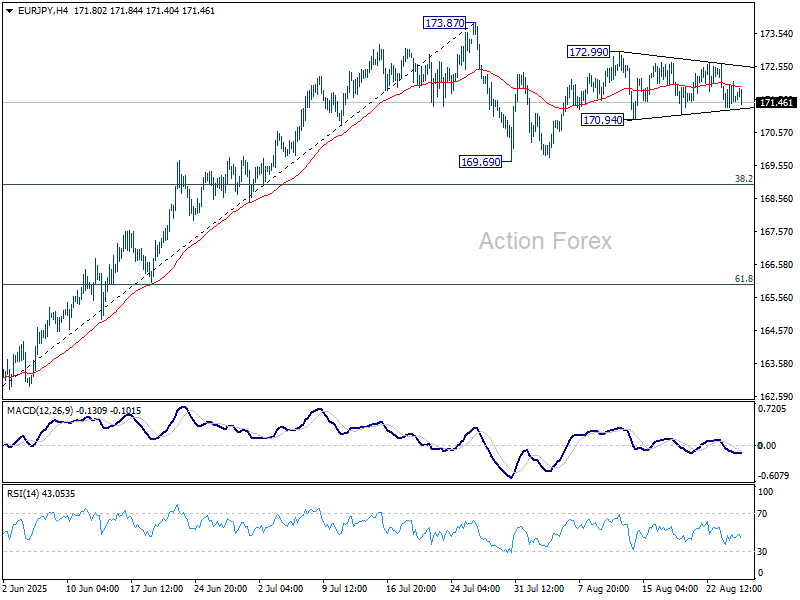
Daily Pivots: (S1) 171.27; (P) 171.69; (R1) 172.06; More...
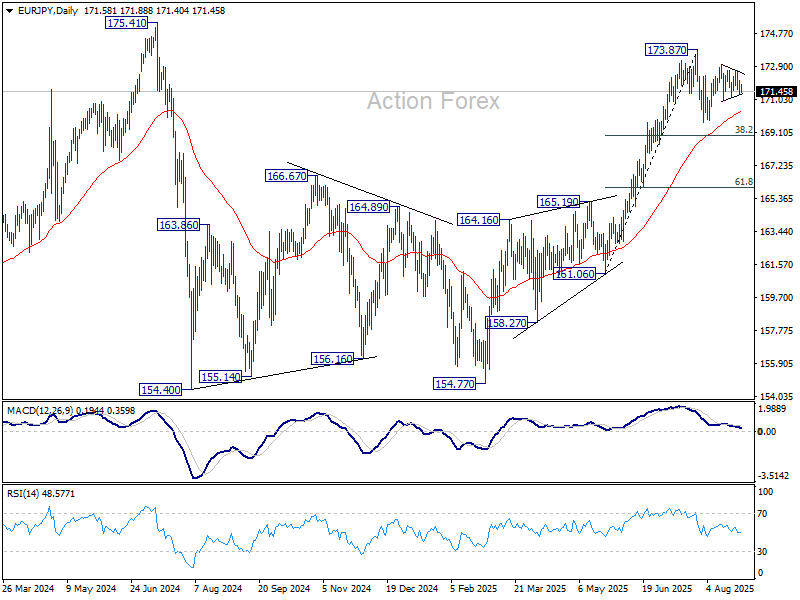
Sideway trading continues in EUR/JPY and intraday bias remains neutral. Overall price actions from 173.87 are seen as a corrective pattern. On the downside, below 170.94 support will bring deeper fall to 169.69 and possibly below. But downside should be contained by 38.2% retracement of 161.06 to 173.87 at 168.97 to bring rebound. On the upside, above 172.99 will bring retest of 173.87.
In the bigger picture, considering current strong momentum as seen in the rally from 154.77, corrective pattern from 175.41 could have already completed. Decisive break of 154.77 will confirm long term up trend resumption. Next target is 61.8% projection of 124.37 to 175.41 from 154.77 at 186.31. However, rejection by 175.41, followed by firm break of 55 D EMA (now at 170.23) will delay this bullish case.
EUR/GBP Daily Outlook
Daily Pivots: (S1) 0.8615; (P) 0.8632; (R1) 0.8656; More...
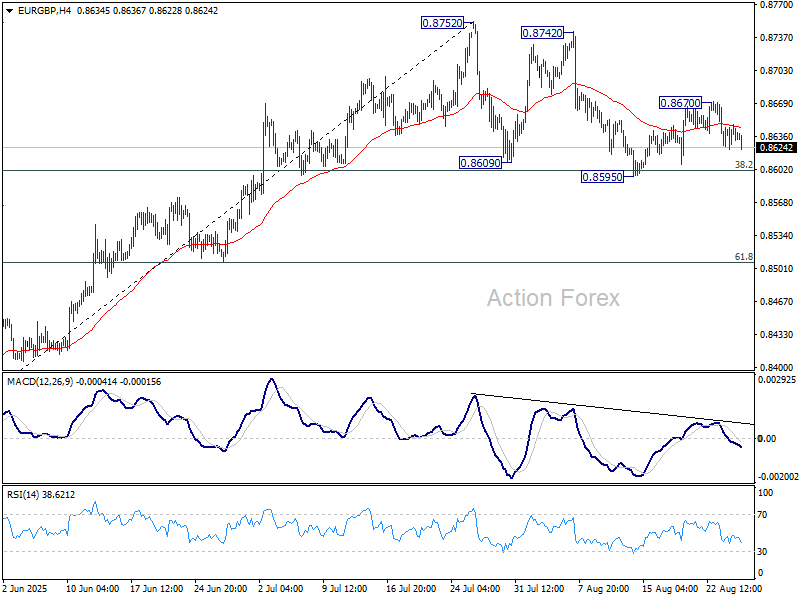
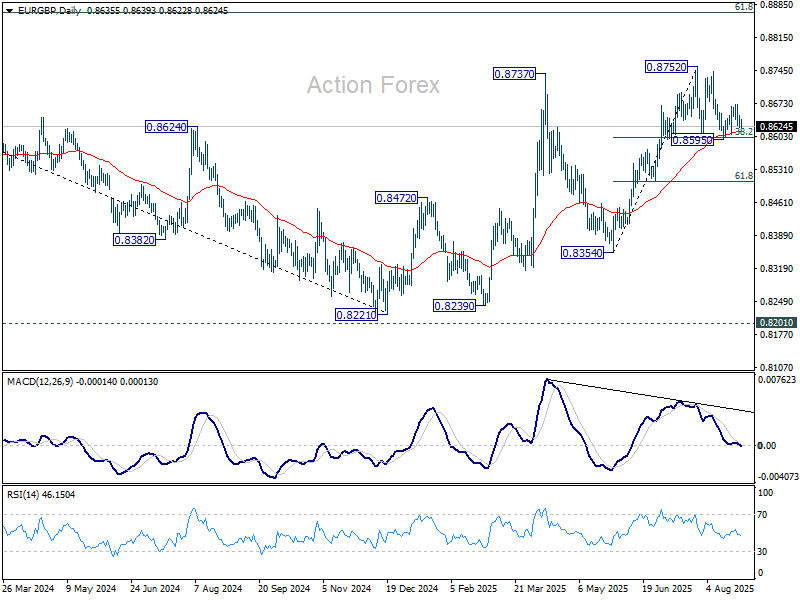
Intraday bias in EUR/GBP stays neutral for the moment. On the downside, sustained trading below 38.2% retracement of 0.8354 to 0.8752 at 0.8600 will indicate near term bearish reversal and target 61.8% retracement at 0.8506. On the upside, above 0.8670 will resume the rebound from 0.8595 to retest 0.8752 high.
In the bigger picture, the structure from 0.8221 medium term bottom are not impulsive enough to suggest that it's reversing the down trend from 0.9267 (2022 high). But even if it's a correction, further rise is expected to 61.8% retracement of 0.9267 to 0.8221 at 0.8867. This will remain the favored case as long as 55 W EMA (now at 0.8508) holds.
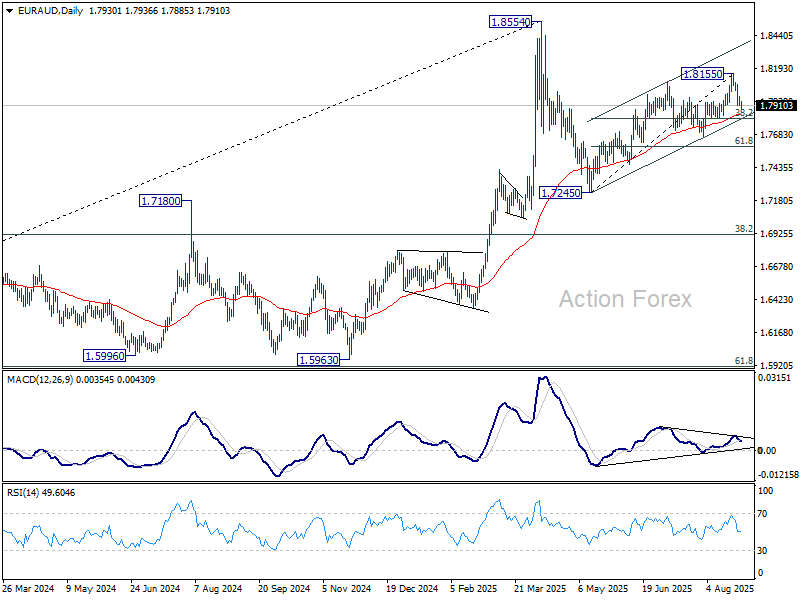
EUR/AUD Daily Outlook
Daily Pivots: (S1) 1.7902; (P) 1.7942; (R1) 1.7967; More...
Intraday bias in EUR/AUD remains on the downside at this point. Fall from 1.8155 short term top should target. r 38.2% retracement of 1.7245 to 1.8155 at 1.7807. That is close to channel support (now at 1.7816), and 55 D EMA (now at 1.7841). Sustained break of this cluster support zone should confirm that whole rise from 1.7245 has completed. Corrective pattern from 1.8554 should then be in its third leg. In this case, bring deeper fall to 61.8% retracement at 1.7593. On the upside, above 1.7979 minor resistance will turn intraday bias neutral first.
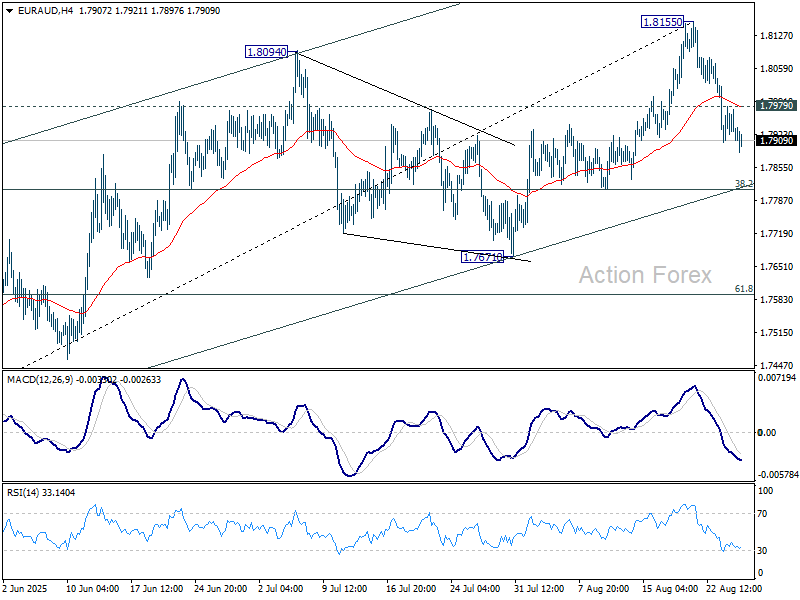
In the bigger picture, price actions from 1.8554 medium term top are seen as a corrective pattern. Such pattern could extend further with another falling leg. But even in that case, downside should be contained by 38.2% retracement of 1.4281 (2022 low) to 1.8554 at 1.6922 to bring rebound. Uptrend from 1.4281 is expected to resume at a later stage.
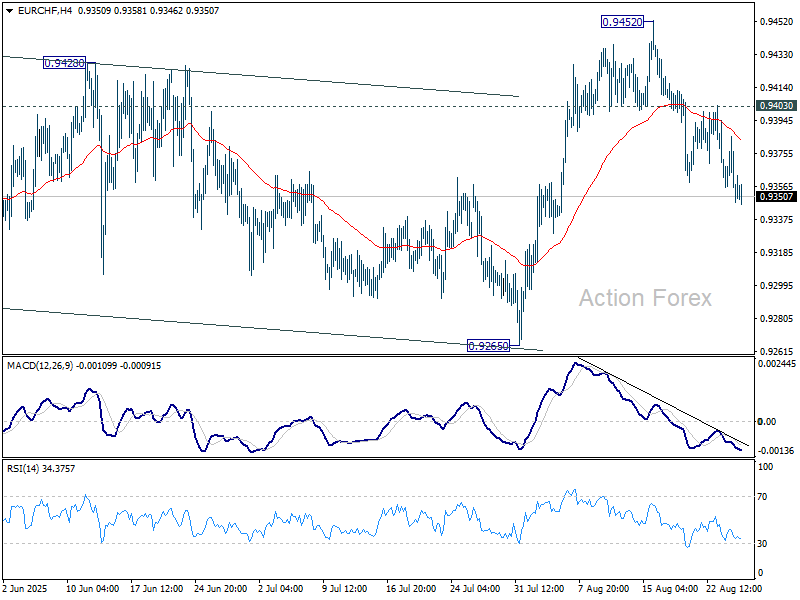
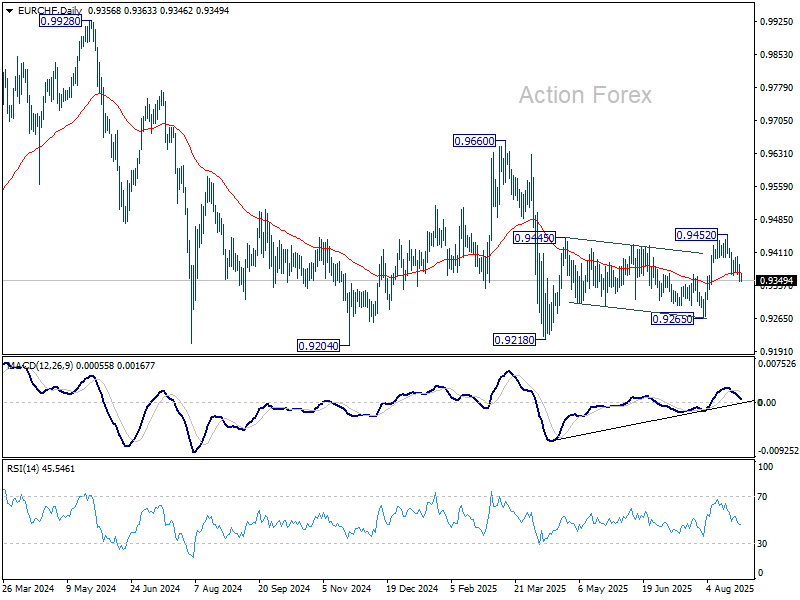
EUR/CHF Daily Outlook
Daily Pivots: (S1) 0.9340; (P) 0.9364; (R1) 0.9376; More....
Intraday bias in EUR/CHF stays on the downside as fall from 0.9452 is extending. Sustained trading below 55 D EMA (now at 0.9366) will argue that the rebound from 0.9128 has completed as a corrective move. Deeper fall would then be seen to 0.9265 support for confirmation. On the upside, above 0.9403 resistance will bring stronger rise to retest 0.9452 instead.
In the bigger picture, the down trend from 0.9204 (2018 high) might still be in progress considering that EUR/CHF is staying well inside the long term falling channel. However, with bullish convergence condition in W MACD, downside potential should be limited in case of another fall. Instead, firm break of 0.9660 resistance will be an important sign of medium term bullish trend reversal.
USD/CAD Daily Outlook
Daily Pivots: (S1) 1.3819; (P) 1.3843; (R1) 1.3865; More...
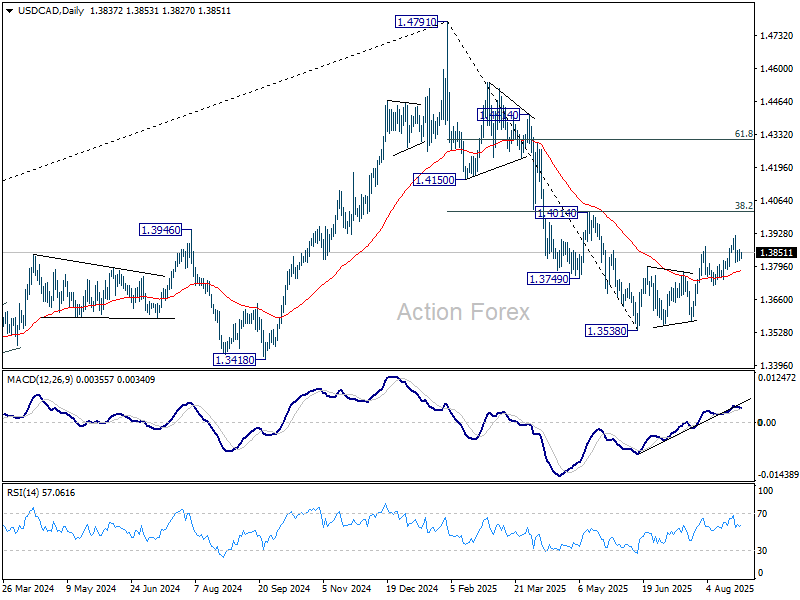
Intraday bias remains neutral for the moment. Price actions from 1.3538 are seen as a corrective pattern. As long as 1.3720 support holds, another rise could still be seen. However, upside should be limited by 1.4014 cluster resistance (38.2% retracement of 1.4791 to 1.3538 at 1.4017). Meanwhile, firm break of 1.3720 will argue that the corrective bounce has already completed, and bring retest of 1.3538 low.
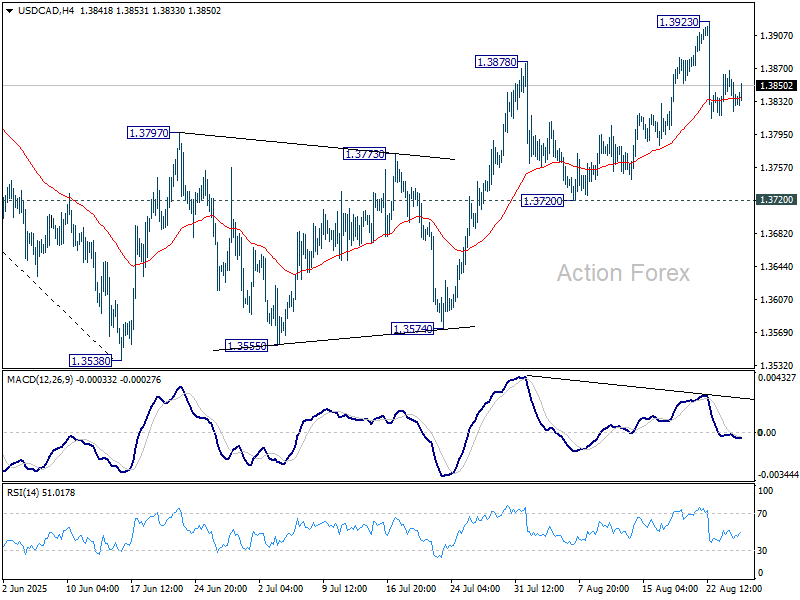
In the bigger picture, price actions from 1.4791 medium term top could either be a correction to rise from 1.2005 (2021 low), or trend reversal. In either case, further decline is expected as long as 1.4014 resistance holds. Next target is 61.8% retracement of 1.2005 (2021 low) to 1.4791 at 1.3069.
AUD/USD Daily Report
Daily Pivots: (S1) 0.6476; (P) 0.6488; (R1) 0.6507; More...
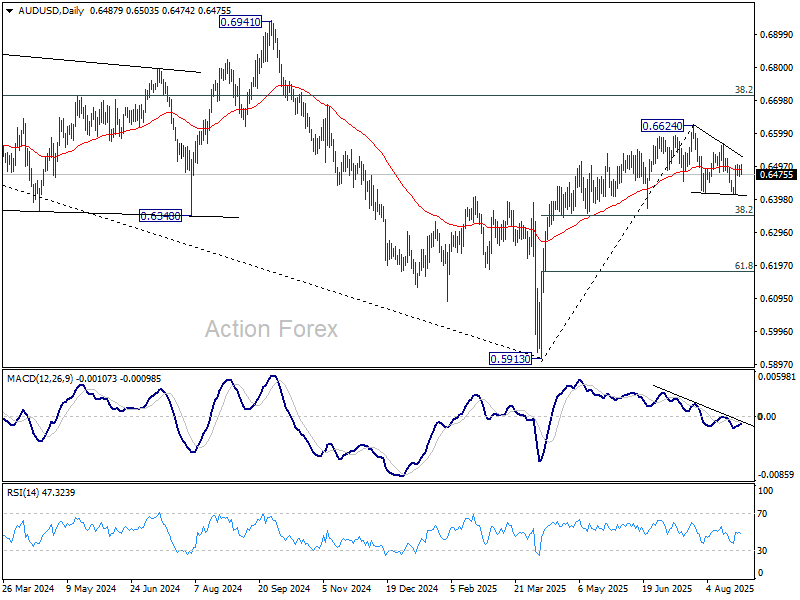
No change in AUD/USD's outlook as corrective pattern from 0.6624 is still extending. Intraday bias remains neutral for the moment. On the upside, firm break of 0.6567 will argue that the correction has completed and bring retest of 0.6624 high. However, break of 0.6413 will extend the correction lower towards 38.2% retracement of 0.5913 to 0.6624 at 0.6352.
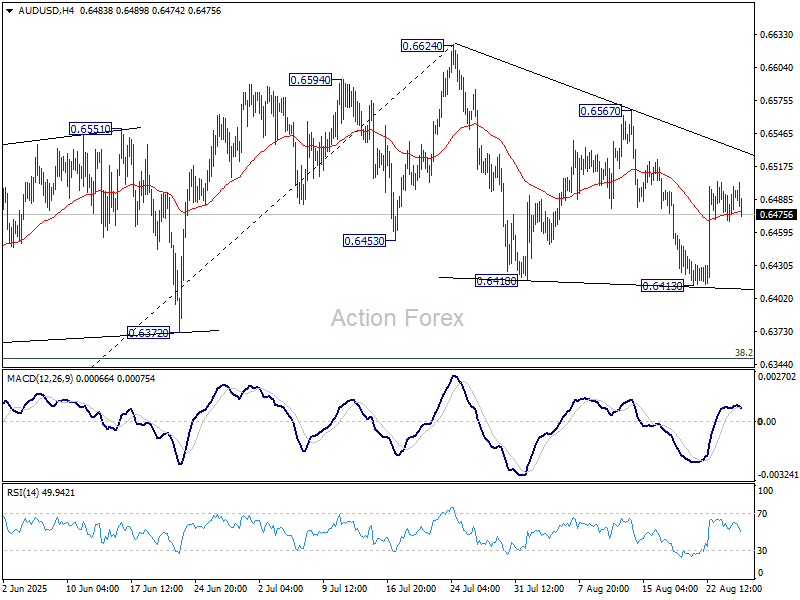
In the bigger picture, there is no clear sign that down trend from 0.8006 (2021 high) has completed. Rebound from 0.5913 is seen as a corrective move. While stronger rally cannot be ruled out, outlook will remain bearish as long as 38.2% retracement of 0.8006 to 0.5913 at 0.6713 holds. Nevertheless, considering bullish convergence condition in W MACD, even in case of another fall through 0.5913, downside should be contained above 0.5506 (2020 low).
EUR/USD Daily Outlook
Daily Pivots: (S1) 1.1607; (P) 1.1636; (R1) 1.1670; More...
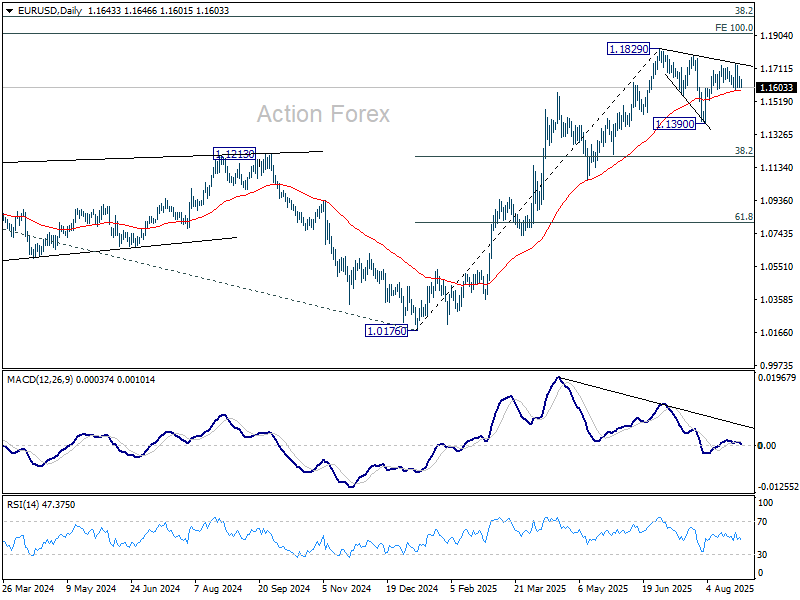
Intraday bias in EUR/USD remains neutral at this point. With 1.1582 support intact, further rise is still in favor. On the upside, above 1.1741 will resume the rally from 1.1390 to retest 1.1829 high. Firm break there will extend larger up trend. However, decisive break of 1.1582 will extend the corrective pattern from 1.1829 with another downleg, and target 1.1390.
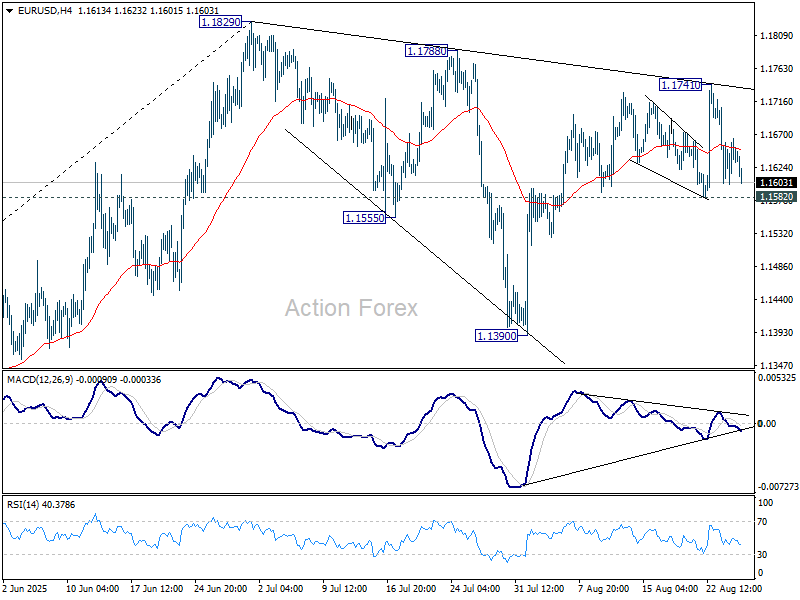
In the bigger picture, rise from 0.9534 long term bottom could be correcting the multi-decade downtrend or the start of a long term up trend. In either case, further rise should be seen to 100% projection of 0.9534 to 1.1274 from 1.0176 at 1.1916. This will remain the favored case as long as 1.1604 support holds.
GBP/USD Daily Outlook
Daily Pivots: (S1) 1.3444; (P) 1.3469; (R1) 1.3504; More...
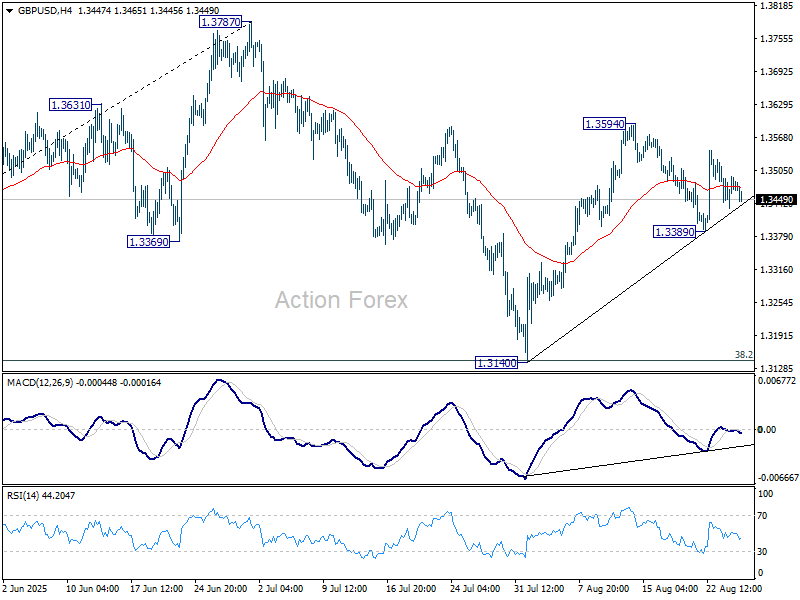
Range trading continues in GBP/USD and intraday bias remains neutral at this point. Overall, price actions from 1.3787 high are seen as a corrective pattern. On the upside, break of 1.3594 will resume the rebound from 1.3140 to retest 1.3787 high. Firm break there will resume the larger up trend. However, break of 1.3389 will bring deeper fall towards 1.3140 to extend the corrective pattern.
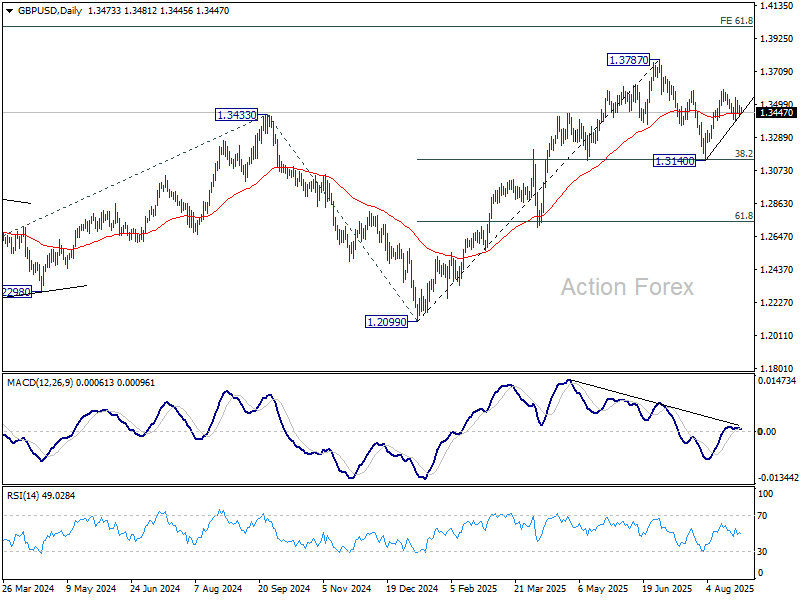
In the bigger picture, up trend from 1.3051 (2022 low) is in progress. Next medium term target is 61.8% projection of 1.0351 to 1.3433 from 1.2099 at 1.4004. Outlook will now stay bullish as long as 55 W EMA (now at 1.3073) holds, even in case of deep pullback.
USD/CHF Daily Outlook
Daily Pivots: (S1) 0.8016; (P) 0.8045; (R1) 0.8063; More….
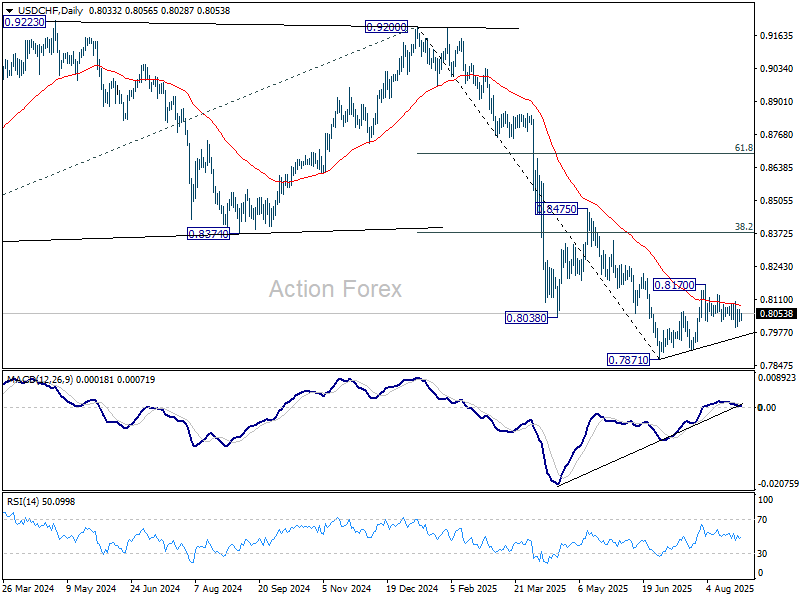
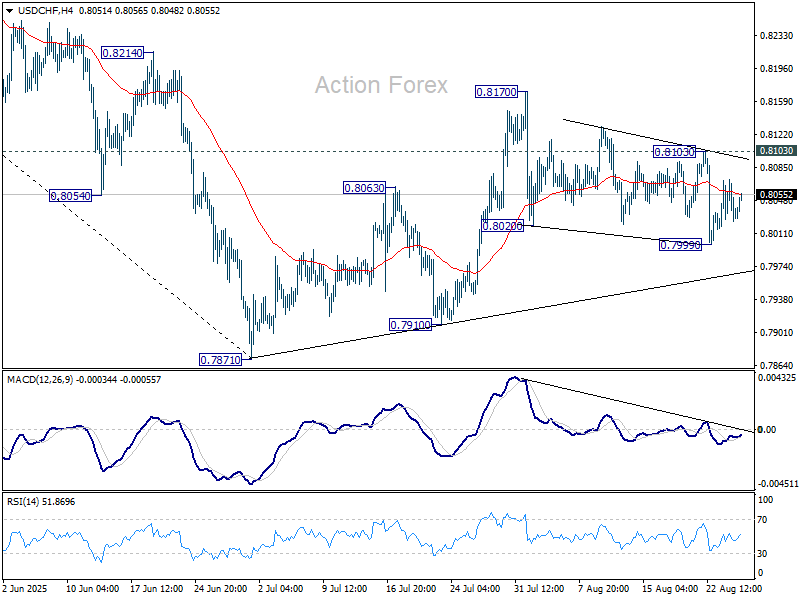
Range trading continues in USD/CHF inside 0.7999/8103 and intraday bias remains neutral. Another fall is in favor as long as 0.8103 resistance holds. Below 0.7999 will target a retest on 0.7871 low. However, break of 0.8103 will turn bias to the upside, and target 0.8170, to extend the corrective pattern from 0.7871.
In the bigger picture, long term down trend from 1.0342 (2017 high) is still in progress. Next target is 100% projection of 1.0146 (2022 high) to 0.8332 from 0.9200 at 0.7382. In any case, outlook will stay bearish as long as 0.8475 resistance holds.