
Sample Category Title
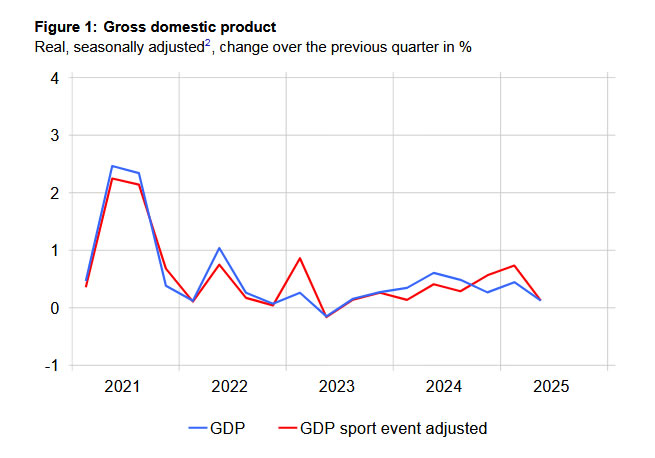
Switzerland posts 0.1% Q2 GDP growth, SECO cuts forecasts on US tariffs, rules out deep recession
Switzerland’s economy grew just 0.1% qoq in Q2, in line with expectations, as SECO noted that the “anticipated correction” followed above-average growth earlier this year. Industrial output and exports contracted sharply, while services posted broad-based gains.
SECO also issued an updated scenario reflecting the drag from new U.S. tariffs on Swiss imports, warning the economy is now likely to expand more slowly than previously projected.
The Federal Government’s June forecast had already pointed to below-average growth, with GDP seen at 1.3% in 2025 and 1.2% in 2026. The revised simulation now pegs growth at just 1.2% in 2025 and 0.8% in 2026, citing the August introduction of higher tariffs.
While a severe recession is not anticipated, SECO warned that the impact could be significant for exporters and certain industries exposed to U.S. demand.
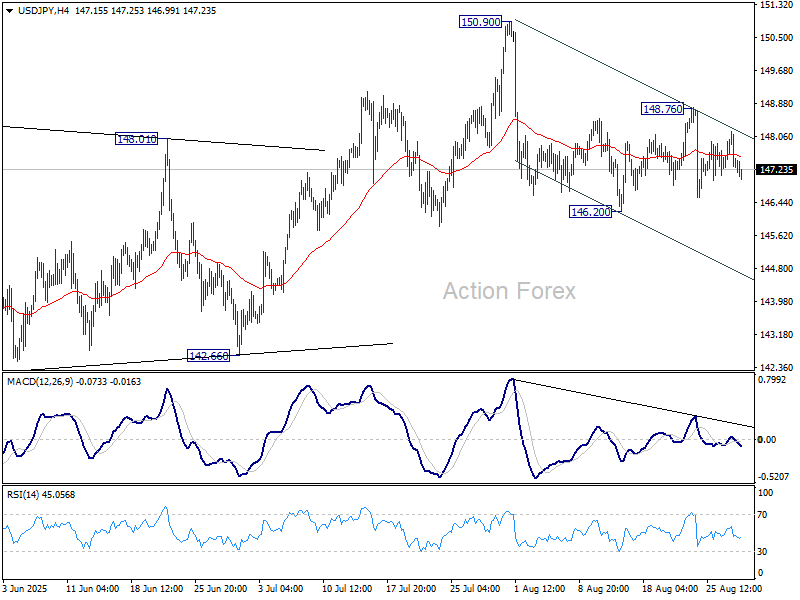
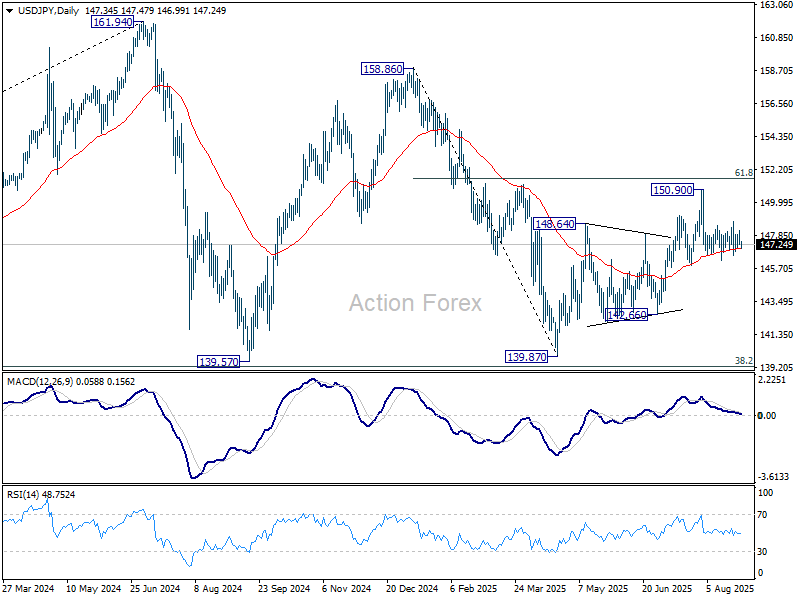
USD/JPY Daily Outlook
Daily Pivots: (S1) 147.08; (P) 147.63; (R1) 147.97; More...
USD/JPY dips mildly today but stays in range of 146.20/148.76 and intraday bias stays neutral first. On the downside, firm break of 146.20 will resume the fall from 150.90. Also, that would argue that rebound from 139.87 has completed as a corrective move to 150.90. Deeper fall should be seen to 142.667 support for confirmation. On the upside, above 148.76 will bring another rise to retest 150.90 instead.
In the bigger picture, price actions from 161.94 (2024 high) are seen as a corrective pattern to rise from 102.58 (2021 low). Decisive break of 61.8% retracement of 158.86 to 139.87 at 151.22 will argue that it has already completed with three waves at 139.87. Larger up trend might then be ready to resume through 161.94 high. In case the corrective pattern extends with another fall, strong support is expected from 38.2% retracement of 102.58 to 161.94 at 139.26 to bring rebound.
Dollar Softens, Yen Leads as Markets Eye ECB Minutes
U.S. equities closed higher overnight, but Asian markets turned mixed on Thursday as risk sentiment remained muted. Nvidia’s stronger-than-expected earnings beat on both revenue and profit dominated headlines but failed to deliver a sustained boost to risk appetite.
In currency markets, Dollar softened as this week’s rebound lost steam. Overall trading remained subdued with no major catalysts. Yen led gains on the day, followed by Loonie and Swiss Franc. On the downside, Euro lagged most, trailed by Dollar and Kiwi, while Sterling and Aussie held middle ground.
Focus in Europe was on the release of the ECB’s July meeting minutes. Policymakers left rates unchanged at 2.00% and subsequent data has pointed to stronger-than-expected growth alongside inflation holding near the 2% target. That combination has reduced the urgency for further easing in the near term.
Trump’s imposition of a 15% tariff on most EU goods has so far tracked with ECB assumptions, averting worst-case outcomes. As a result, markets now largely expect the ECB to stand pat again on September 11, barring sharp downside surprises in upcoming flash inflation and survey data. The debate has shifted toward whether there will be a case for more easing later in the year, but for now the bar remains high.
On the trade front, Japan’s top negotiator Ryosei Akazawa canceled a trip to Washington that was intended to cover tariff issues. Chief Cabinet Secretary Yoshimasa Hayashi said technical disagreements had surfaced, requiring continued talks at the administrative level instead.
Kyodo News reported no decision has been made on rescheduling, while Reuters suggested Akazawa could head to Washington next week. Tokyo has made clear it will press the U.S. to revise its reciprocal tariff order and seek lower duties on autos and parts. The delay highlights the fragility of trade talks even between close partners.
In Asia, at the time of writing, Nikkei is up 0.69%. Hong Kong HSI is down -1.12%. China Shanghai SSE is down -0.22%. Singapore Strait Times is down -0.03%. Japan 10-year JGB yield is flat at 1.626. Overnight, DOW rose 0.32%. S&P 500 rose 0.24%. NASDAQ rose 0.21%. 10-year yield fell -0.020 to 4.238.
NZ ANZ business confidence rises to 49.7, weak spots reinforce RBNZ’s dovish tilt
New Zealand’s ANZ Business Confidence index improved modestly in August, rising to 49.7 from 47.8. However, firms’ Own Activity Outlook slipped to 38.7 from 40.6. Sector pressures also persisted, with reported employment in construction falling sharply.
Inflation indicators eased further. The share of firms expecting to raise prices in the next three months fell to 43%, while cost expectations edged down to 74%. One-year inflation expectations also dipped to 2.63% from 2.68%. Wage growth expectations 12 months out softened to 2.4% from 2.5%.
ANZ said the survey aligns with the RBNZ’s updated view that the economy requires “a little more support” to ward off downside risks. While confidence is stabilizing, the recovery will unfortunately "not come soon enough for some".
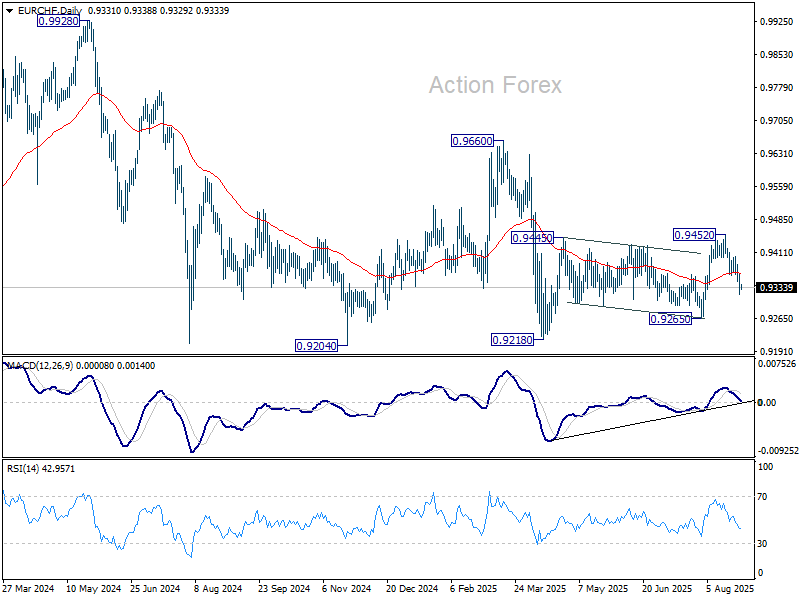
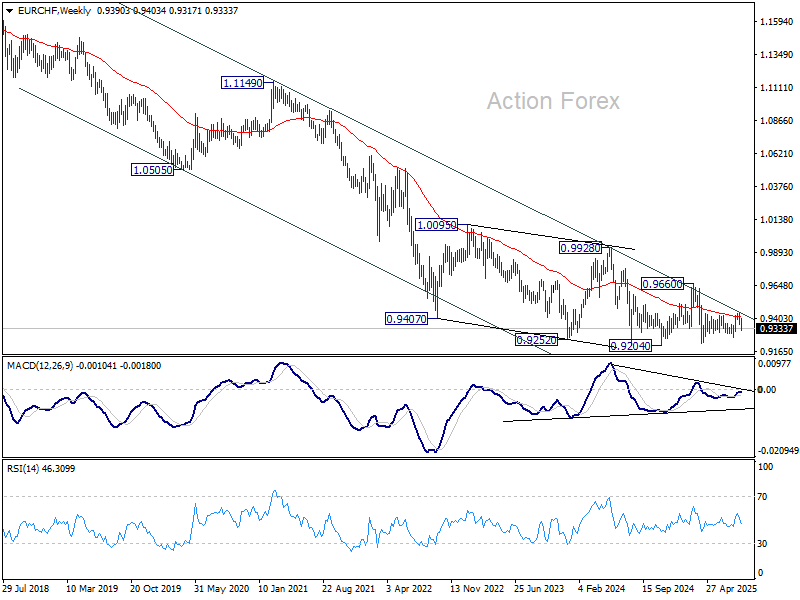
EUR/CHF turns lower as risk sentiment outweighs Swiss fundamentals
Swiss Franc extended gains against Euro this week, driven primarily by risk-off sentiment. French political turmoil hit the common currency, and the scale of Franc’s move highlighted how haven demand eclipsed domestic policy and economic debates.
SNB Vice Chairman Antoine Martin’s remarks on inflation and negative rates provided some context, but they did little to alter the market narrative. Martin noted the central bank sees no risk of deflation and expects inflation to rise, while stressing that the bar for reintroducing negative rates is high.
Domestic developments, including the 39% U.S. tariffs on Swiss exports and today’s Q2 GDP release, carry weight in principle. But markets view these as secondary in the near term, with the real impact of tariffs unlikely to be visible until later this year.
Technically, this week's extended decline in EUR/CHF suggests that corrective rebound from 0.9218 has completed with three waves up to 0.9452. That came after rejection by falling 55 W EMA (now at 0.9359). Outlook is clearly still bearish. Deeper fall should be seen to 0.9265 support in the near term. Firm break there will open deeper decline, at least for a retest of 0.9204 support (2024 low).
USD/JPY Daily Outlook
Daily Pivots: (S1) 147.08; (P) 147.63; (R1) 147.97; More...
USD/JPY dips mildly today but stays in range of 146.20/148.76 and intraday bias stays neutral first. On the downside, firm break of 146.20 will resume the fall from 150.90. Also, that would argue that rebound from 139.87 has completed as a corrective move to 150.90. Deeper fall should be seen to 142.667 support for confirmation. On the upside, above 148.76 will bring another rise to retest 150.90 instead.
In the bigger picture, price actions from 161.94 (2024 high) are seen as a corrective pattern to rise from 102.58 (2021 low). Decisive break of 61.8% retracement of 158.86 to 139.87 at 151.22 will argue that it has already completed with three waves at 139.87. Larger up trend might then be ready to resume through 161.94 high. In case the corrective pattern extends with another fall, strong support is expected from 38.2% retracement of 102.58 to 161.94 at 139.26 to bring rebound.
Chip Rally Changes Hand
Nvidia revealed its Q2 results yesterday after the closing bell and the numbers were, again, very impressive. The company made $46.7bn in revenue last quarter, broadly in line with expectations – and that without selling any H20 chips to China due to export restrictions. The profit margin climbed back above the 70% mark, and the company guided for $56bn in revenue this quarter – still excluding China, where the outlook remains complicated. Not only is the US government willing to take 15% of Nvidia’s revenue there, but Chinese buyers are reluctant to purchase American chips. That doesn’t mean Nvidia will never sell to China again – on the contrary, CEO Jensen Huang said that selling Blackwell to China is a real possibility. But for now, the company has the luxury of ignoring that opportunity. And note: $56bn in revenue without China would mean a 15% jump in just one quarter. The numbers are gigantic.
Still, they weren’t as gigantic as the most bullish estimates. Nvidia’s revenue grew by 56% YoY last quarter, but the growth rate – especially in data centers – slowed sequentially. That explains why Nvidia’s stock price fell more than 3% in after-hours trading. Even the announcement of a $60bn share buyback failed to spark a rally.
So this is where we are. The rising concern that Nvidia’s earnings growth is slowing hints at a potential saturation point in AI-related holdings and the risk of a correction. S&P 500 futures are slightly down this morning after the index hit a fresh ATH ahead of Nvidia earnings, while Nasdaq futures trade about 0.25% lower at the time of writing. Yesterday’s optimism – and today’s muted reaction – may owe more to the significant downside move in the US 2-year yield, which reflects rising expectations for Federal Reserve (Fed) cuts amid political attacks on Fed officials. The 2-year now yields 3.60% versus around 4% before the latest jobs data. The 10-year sits just above 4.20%, and even the 30-year looks softer this morning. The latter could help temper fears of slowing AI spending post-Nvidia.
In China, it’s a different story. Cambricon, a Chinese chipmaker, announced a 44-fold jump in revenue compared to last year. It swung from a half-billion yuan loss to a one-billion yuan profit in just one year, with customers like Alibaba, DeepSeek, ByteDance and Didi. Beijing is encouraging tech giants to buy local chips to reduce reliance on US suppliers. Unsurprisingly, Cambricon’s shares gained 7% after the results and are up 180% since mid-July. But caution: at the current valuation, Cambricon trades on a PE ratio of 514, compared to Nvidia’s 52. If you find Nvidia expensive, Cambricon is ten times pricier on earnings. Another Chinese chipmaker, SMIC, rose 8% today and trades at a PE of 110.
In summary, speculative chip bets are shifting toward Chinese names. There’s certainly more opportunity in established players like Alibaba, which trades at relatively lower multiples than US peers. And frankly, if the valuation gap is due to government risk, well – US government risk has risen enough to justify some convergence.
Speaking of governments, Mexico just announced higher tariffs on Chinese imports to please Trump, while India faces the tough reality of 50% tariffs on exports to the US for refusing to cut cheap Russian oil purchases. That puts India’s ambition of becoming America’s “backyard factory” at risk. The Nifty 50 is again under pressure as its latest rally lost steam. But note: only 9% of Nifty 50 revenue comes from the US, and Washington wants more production brought back home anyway. India may have more to lose from giving up cheap energy than from giving up some US export demand. Domestic support from the Reserve Bank of India (RBI) and government could bolster local equities.
In Europe, French political shenanigans remain in focus, now joined by rising disputes in the Netherlands over Gaza. While the Dutch tensions have little market impact – they’re seen as purely political – the French situation hits markets directly because it ties into the country’s rising debt. Opposition parties are blocking François Bayrou’s plan to rein in the deficit. That pushed the 10-year French-German sovereign bond spread above 80bp, the highest since January. Some warn it could widen to 100bp if the French government collapses, along with hopes of narrowing the deficit. The widening spread is likely to cap the Euro’s upside against a broadly softer US dollar. In the end, it may come down to which currency looks less appealing amid rising debt concerns. Right now, the US looks more troubling.
Today brings the latest US GDP update, and tomorrow the Fed’s preferred inflation gauge. With Nvidia earnings behind us, those numbers could take center stage.
Will Euro Area Credit Growth Show Further Slowing in July?
In focus today
In the euro area, we receive data on credit growth for July. Growth has picked up significantly this year in a sign of the easing monetary policy working though the economy. Yet, most recently credit growth has lost some momentum, and it will be interesting to see if that continued in July.
In Sweden, the NIER will publish the Economic Tendency Survey, which will be important assessing the outlook. The consumer confidence and the firm's price plans will be especially important. Additionally, we get the release of the Swedish trade balance results for July.
Overnight, in Japan, we get a badge of data including retail sales, unemployment data and Tokyo CPI inflation. Following the recent better-than-expected growth data for Q2 and some modest pick-up in private spending, July retail sales will be interesting to follow. Inflation remains a headwind for consumers with food prices as the key driver. Tokyo data will show if this trend continues.
Economic and market news
What happened overnight
In the equity space, Nvidia reported second-quarter revenue of USD 46.7bn, up 56% y/y, exceeding analysts' expectations. Additionally, its Q3 revenue projections and adjusted gross margins forecast were higher than expected. Despite the strong growth, Nvidia shares dipped around 3% in after-hours trading as investors reacted to the uncertainty over H20 chip sales to China, which were excluded from its financial guidance.
What happened yesterday
In Norway, the Labour Force Survey revealed a downward revision in the trend-unemployment from 4.8% to 4.6% for both June and July. While the headline appeared weak, the details highlighted strength, as the rise in unemployment this year has been driven by an expanding labour force, with employment also showing growth. We still prefer Friday's NAV registered labour market report as the primary signal for the state of the labour market, alongside other indicators.
On tariffs, the doubling of US duties on Indian imports of up to 50% took effect on Wednesday, straining US-India ties. The measures include a 25% punitive tariff linked to India's Russian oil purchases. India plans financial aid for affected exporters and aims to diversify trade to regions like China, Latin America, and the Middle East. Key goods like steel, aluminium, and passenger vehicles are exempt from the tariffs.
Equities: Equities were mixed, again, on Wednesday. US outperformed Europe, as has been the case the last four trading sessions. While European equities were little changed in another defensive session, S&P 500 hit a fresh record close, up 0.2%. But the miss came from the right reasons: China. Sales to China were basically halted during the quarter and guidance based on the assumption that China will remain off limits. Any resumptions from the administration will be pure upside from the current forecast and if not, this is a one-off and not a sign of a structural deceleration to growth. As a result, US futures are handling this report well, with futures only little lower this morning and Nvidia shares -3% in the aftermarket. European futures are little changed.
FI and FX: EUR/USD fell during the European trading session from 1.1645 to a low of 1.1574. During the US session, however, the move reversed with EUR/USD moving back towards the 1.1650 level. US yields also fell a few basis points during the US hours with 10y UST now at 4.23%. In Europe, peripheral spreads to Germany continued widening yesterday. For Scandi markets, NOK strengthened, aided by both higher energy prices and an underperformance in fixed income space. The SEK also strengthened yesterday, with EUR/SEK breaking through the downside in the previous 11.12-11.22 range touching the 11.08 level overnight.
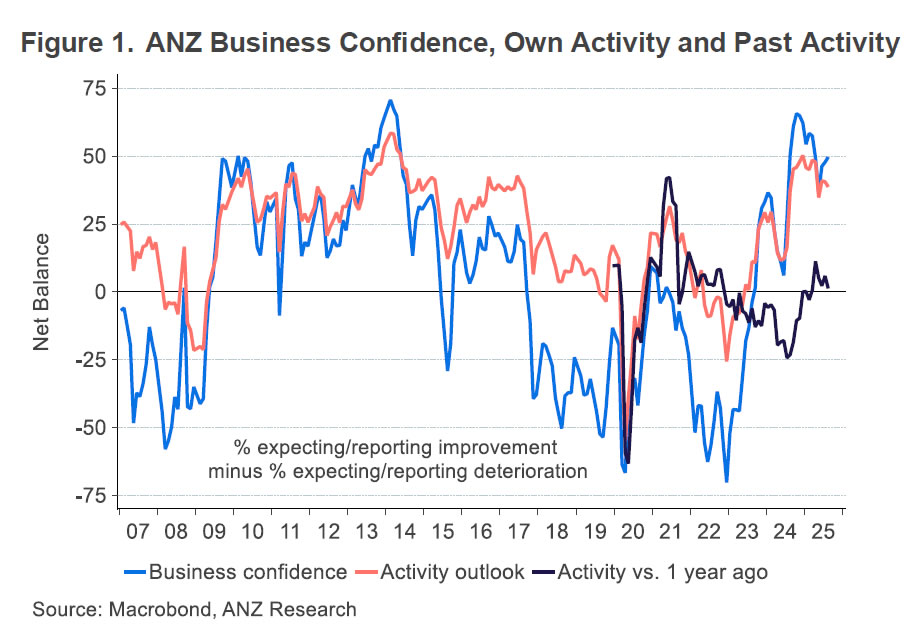
First Impressions: NZ Business Confidence, August 2025
The August survey pointed to broadly unchanged levels of optimism, still difficult current conditions, and a slight easing of inflation pressures.
Key results, Aug 2025
- Business confidence: 49.7 (Prev: 47.8)
- Expectations for own trading activity: 38.7 (Prev: 40.6)
- Activity vs same month one year ago: 1.3 (Prev: 5.9)
- Inflation expectations: 2.63% (Prev: 2.68%)
- Pricing intentions: 42.5 (Prev: 43.5)
The key forward-looking indicators of general business confidence and own activity expectations were little changed in the August ANZ business opinion survey, thus remaining below the cyclical peaks reached late last year but still well above average levels.
Confidence was down a little in the agriculture sector this month (indeed activity expectations were at their least positive level in 12 months) but was firmer in the retail sector. There was little change in indicators of investment or hiring intentions, which also remain at firmer-than-average levels.
It is worth noting that this survey was in the field prior to last week’s unexpected RBNZ pivot. However, the ANZ comments that there was no generalised improvement in those responses that came in following the RBNZ’s meeting.
Despite the continued optimism for the year ahead, firms continue to report that current conditions are tough. A net 1% of firms said that their activity was up on the same time last year, compared to 6% in July – that’s the weakest reading since March. Firms also continue to report a decline in staffing, especially in the construction sector.
The survey’s pricing indicators moved favourably this month. Firms’ year-ahead inflation expectations edged down to a 5-month low of 2.63% (slightly below the long-term average) and the proportion expressing an intention to raise their own selling prices fell to the lowest level since November last year. Firms also reported slightly less intense cost pressure, with reported wage growth at the slowest pace since the question was first asked in 2022.
EUR/CHF turns lower as risk sentiment outweighs Swiss fundamentals
Swiss Franc extended gains against Euro this week, driven primarily by risk-off sentiment. French political turmoil hit the common currency, and the scale of Franc’s move highlighted how haven demand eclipsed domestic policy and economic debates.
SNB Vice Chairman Antoine Martin’s remarks on inflation and negative rates provided some context, but they did little to alter the market narrative. Martin noted the central bank sees no risk of deflation and expects inflation to rise, while stressing that the bar for reintroducing negative rates is high.
Domestic developments, including the 39% U.S. tariffs on Swiss exports and today’s Q2 GDP release, carry weight in principle. But markets view these as secondary in the near term, with the real impact of tariffs unlikely to be visible until later this year.
Technically, this week's extended decline in EUR/CHF suggests that corrective rebound from 0.9218 has completed with three waves up to 0.9452. That came after rejection by falling 55 W EMA (now at 0.9359). Outlook is clearly still bearish. Deeper fall should be seen to 0.9265 support in the near term. Firm break there will open deeper decline, at least for a retest of 0.9204 support (2024 low).
GBP/USD Loses Momentum but Holds Bullish Position
Key Highlights
- GBP/USD corrected gains from 1.3595 and traded below 1.3450.
- A connecting bearish trend line is forming with resistance at 1.3500 on the 4-hour chart.
- EUR/USD is struggling to continue higher above 1.1650 and might decline to 1.1520.
- The US GDP could grow by 3.1% in Q2 2025 (Preliminary).
GBP/USD Technical Analysis
The British Pound corrected lower after it failed to surpass 1.3600 against the US Dollar. GBP/USD declined below the 1.3550 and 1.3500 support levels.
Looking at the 4-hour chart, the pair traded below the 38.2% Fib retracement level of the upward move from the 1.3139 swing low to the 1.3594 high. The pair even spiked below the 100 simple moving average (red, 4-hour) and the 200 simple moving average (green, 4-hour).
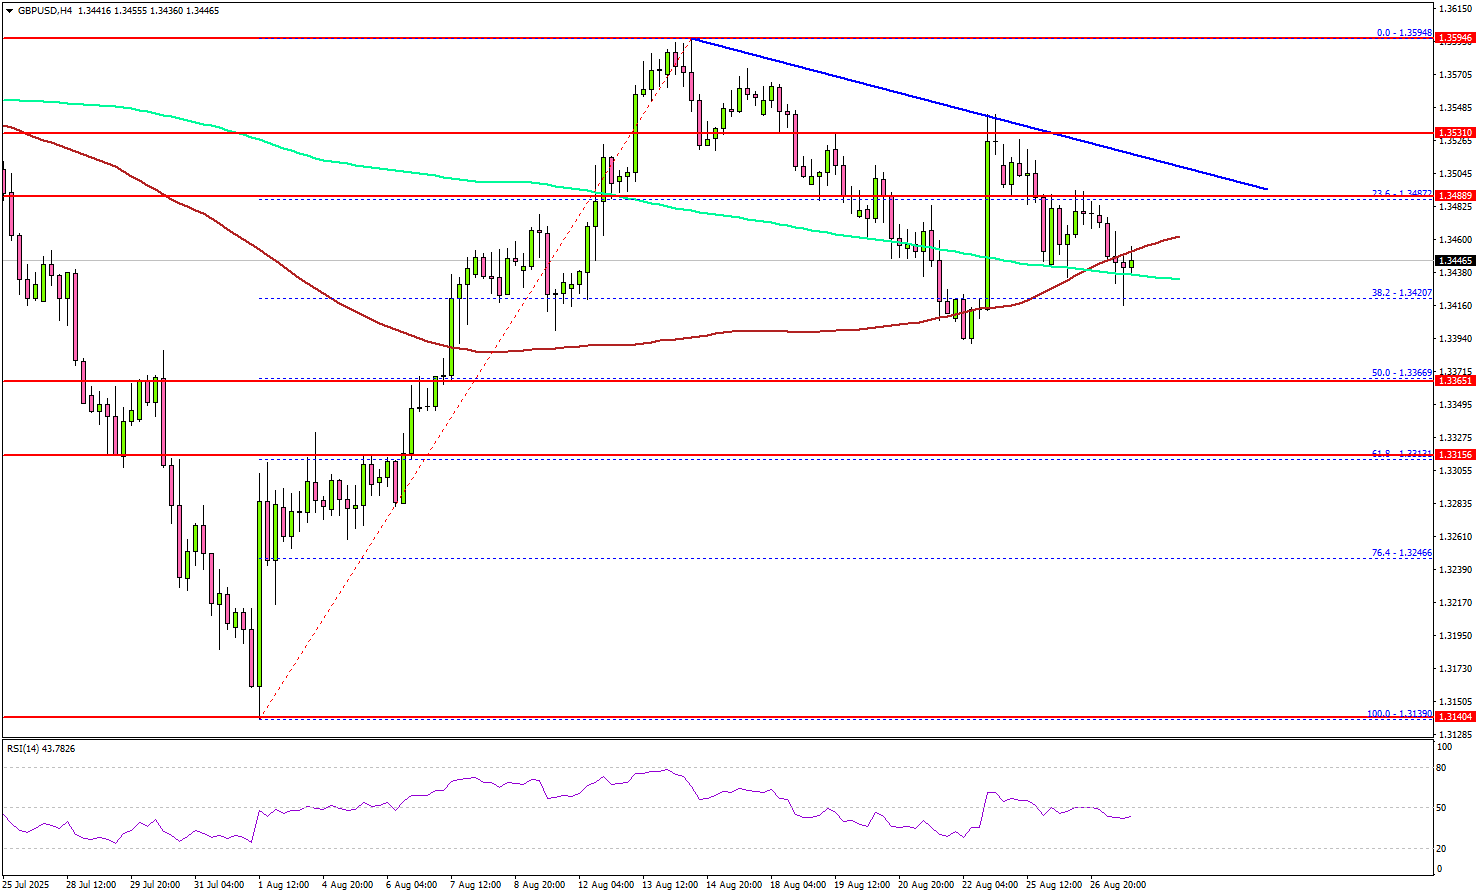
However, the pair is stable above the 1.3380 support and the 50% Fib retracement level of the upward move from the 1.3139 swing low to the 1.3594 high.
On the upside, the pair now faces resistance near 1.3485. The next key resistance sits at 1.3500. There is also a connecting bearish trend line forming with resistance at 1.3500 on the same chart. A close above 1.3500 could set the pace for another increase.
In the stated case, the pair could rise toward 1.3550, above which the bulls could aim for a move toward 1.3600. On the downside, immediate support is 1.3400. The next key support sits at 1.3365. Any more losses could send the pair toward the 1.3315 support zone.
Looking at EUR/USD, the pair started a fresh increase, but the bears protected gains above 1.1680, and the pair trimmed most gains.
Upcoming Key Economic Events:
- US Initial Jobless Claims - Forecast 230K, versus 235K previous.
- US Gross Domestic Product for Q2 2025 (Preliminary) – Forecast 3.1% versus previous 3.0%.
NZ ANZ business confidence rises to 49.7, weak spots reinforce RBNZ’s dovish tilt
New Zealand’s ANZ Business Confidence index improved modestly in August, rising to 49.7 from 47.8. However, firms’ Own Activity Outlook slipped to 38.7 from 40.6. Sector pressures also persisted, with reported employment in construction falling sharply.
Inflation indicators eased further. The share of firms expecting to raise prices in the next three months fell to 43%, while cost expectations edged down to 74%. One-year inflation expectations also dipped to 2.63% from 2.68%. Wage growth expectations 12 months out softened to 2.4% from 2.5%.
ANZ said the survey aligns with the RBNZ’s updated view that the economy requires “a little more support” to ward off downside risks. While confidence is stabilizing, the recovery will unfortunately "not come soon enough for some".
Silver (XAG) and Other Metals in Focus as Federal Reserve Independence Challenged
The most recent moves in the US Dollar may have mean-reverted in Forex markets, but the same can't be said about precious metals.
They had been subject to some selling pressure ahead of the Jackson Hole Symposium but a conjunction of a dovish interpretation of FED Chair Jerome Powell's speech and growing concerns about the Federal Reserve's independance have brought demand back.
A former Board member of the FED (able to vote at every FOMC meeting), Lisa Cook has recently been fired by President Trump "For cause" – She had been appointed by President Biden in 2022 and has been dissenting for rate cuts; but the reasoning has been valid with the growing inflation concerns from tariffs. (PPI just came in at 0.9% vs 0.2% m/m for those who have forgot).
A former FED governor Lael Brainard expressed her fears concerning this attack on the Federal Reserve's Independence.
However, this has helped metals to come back on the front-scene: Since marking lows on the last trading day of July, Silver is up 6% and saw another leg higher after last Friday's speech.
Since, the metal has been consolidating at its relative highs, a sign that usually helps for pursued upside.
Let's take a look at the charts for Silver (XAG) to spot breakout points and key technical levels.
Metals Daily performance
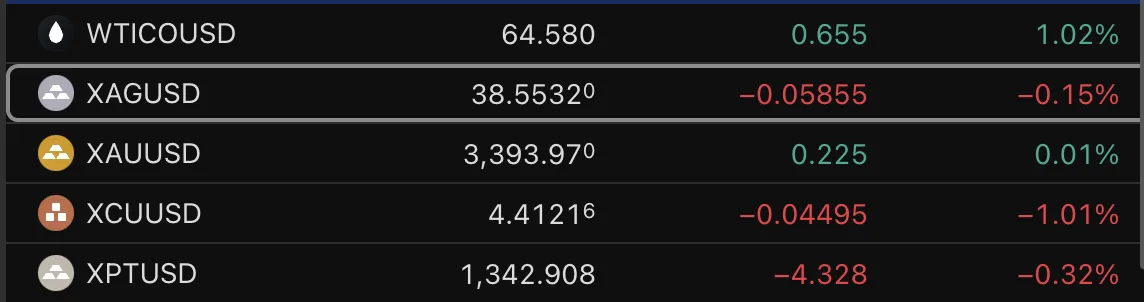
A look at the daily performance in Metals, August 27, 2025 – Source: TradingView XAG = Silver, XAU = Gold, XCU = Copper, XPT = Platinum
Metals aren't shining too bright in today's session, however they are holding strong.
Most commonly traded Metals performance in August 2025
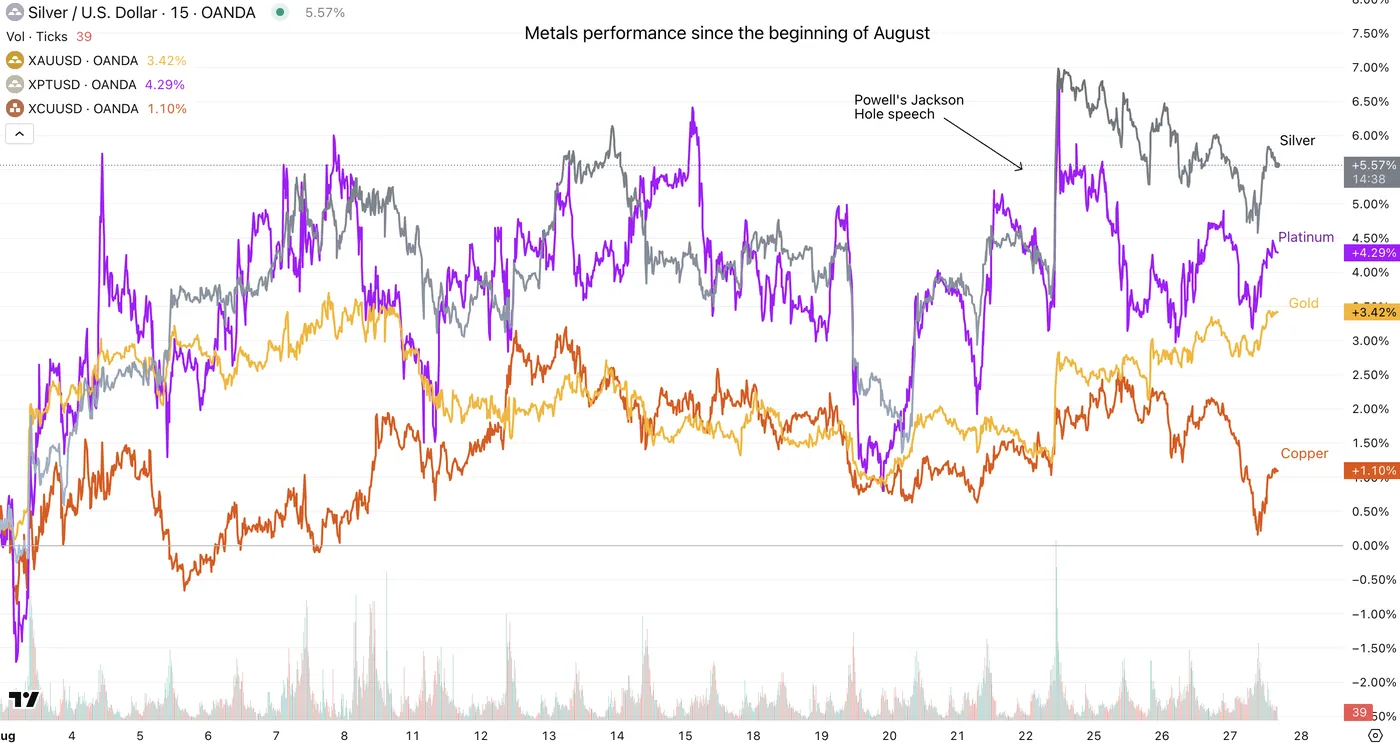
Metals comparative performance since the past month, August 2025 – Source: TradingView
Silver Daily and intraday technical analysis
Silver Daily Chart
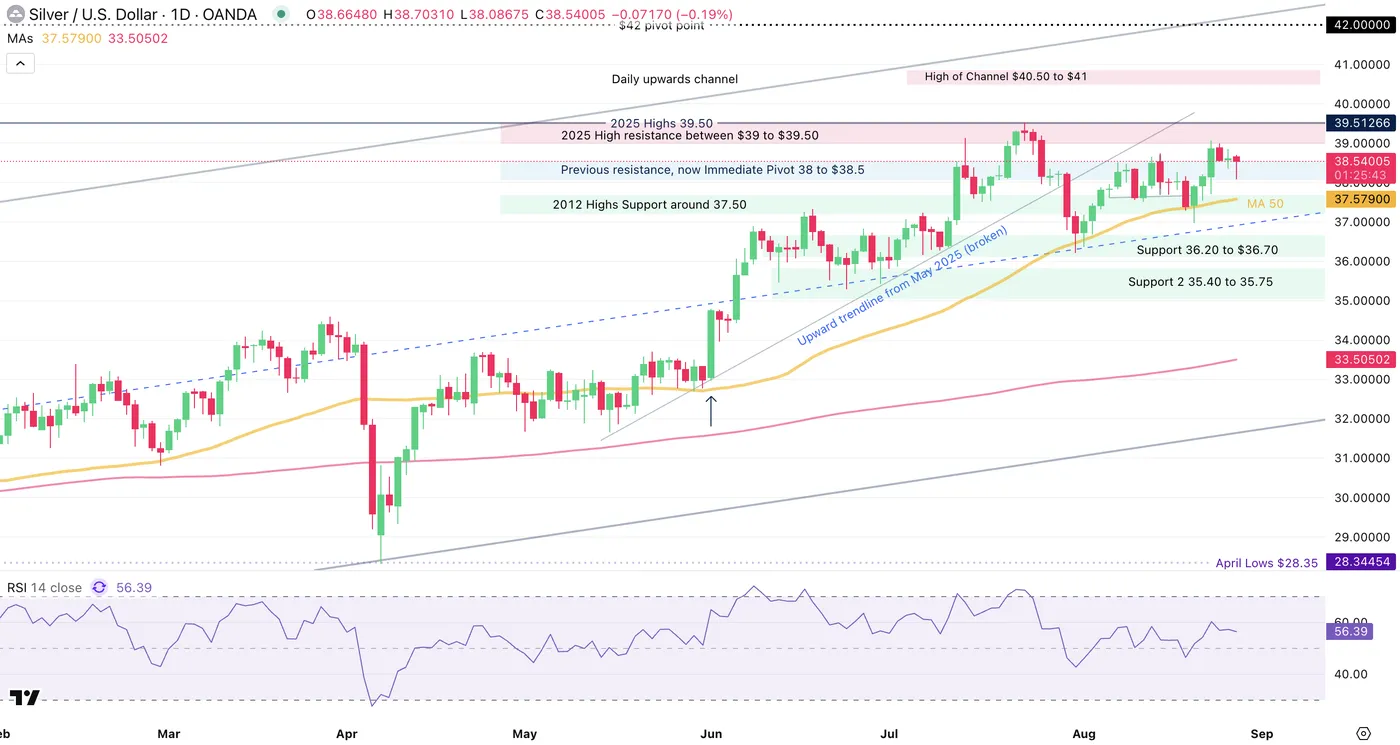
Silver Daily Chart, August 27, 2025 – Source: TradingView
Since our last analysis for Silver which had noted the formation of a head and shoulders formation, bulls have broken its materialization for the current consolidation.
Holding between the $38 to $38.50 Pivot Zone and the 2025 Resistance highs, Markets seem to be waiting for further news before moving XAG further.
In technical analysis, consolidation at relative highs tend to be good signs for further continuation, particularly as Silver is still evolving within a longer-run upward channel.
Do monitor US Dollar strength and rate expectations for fundamentals invalidating these technicals.
Silver 4H Chart
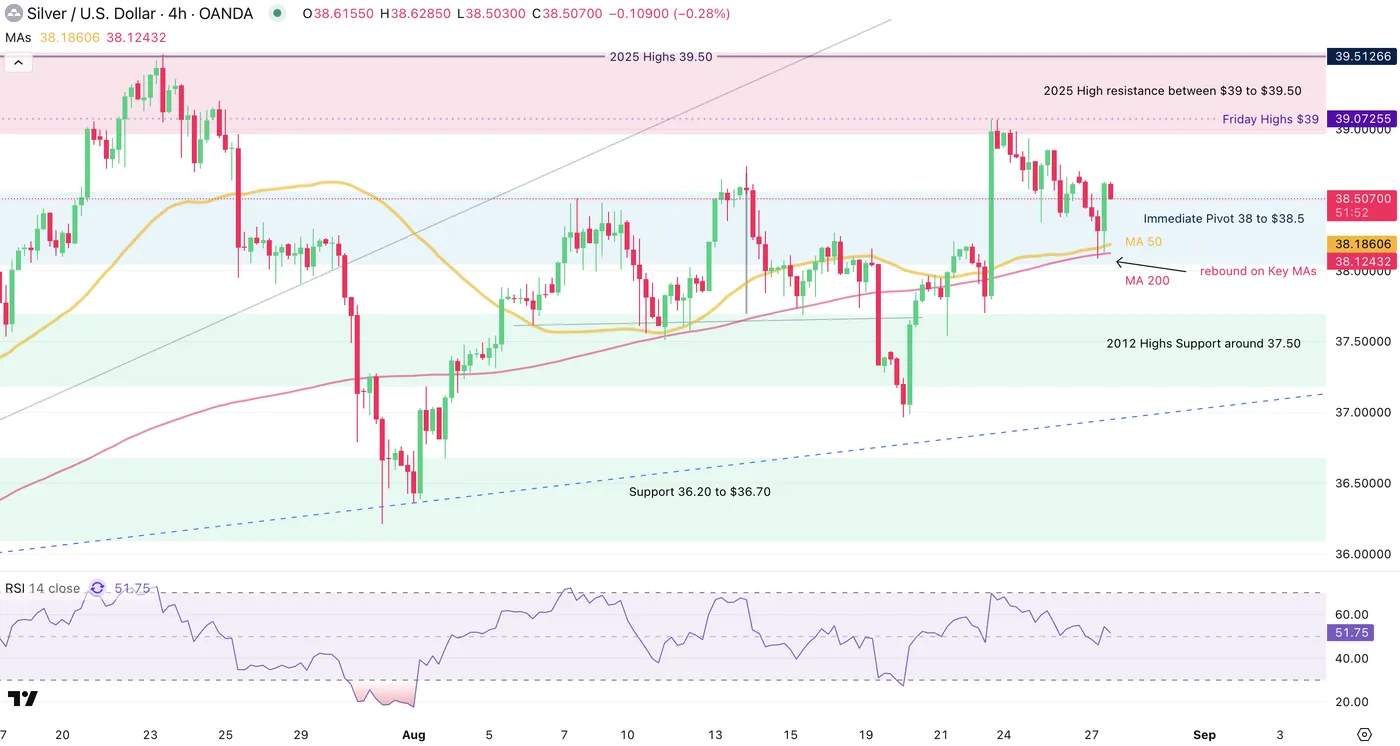
Silver 4H Chart, August 27, 2025 – Source: TradingView
Coming back from overbought levels on the 4H timeframe, Silver is rebounding on both the Pivot Zone and key Moving Averages, which may lead to further upside.
Tomorrow's US GDP and Friday's Core PCE will add to volatility quite largely, so keep an eye on these releases.
Breaking the $39 relative highs should confirm further probabilities of new yearly highs being reached – the 2025 highs are at $39.50.
On the other hand, breaching the Key MAs would show more balanced price action ahead.
Levels to watch for Silver (XAG) trading:
Resistance Levels:
- Friday Highs $39
- 2025 High resistance between $39 to $39.50
- 2011 resistance $40 to $41
Support Levels:
- Immediate Pivot 38 to $38.5
- 4H MA 50 and 200 $38.15
- 2012 Highs Support around 37.50
Safe Trades!