
Sample Category Title
USD/JPY Faces Uphill Task After Recent Bullish Attempt Fades
Key Highlights
- USD/JPY failed to start a fresh increase above 148.00.
- A key bearish trend line is forming with resistance at 147.80 on the 4-hour chart.
- EUR/USD could make another attempt to clear the 1.1720 resistance.
- GBP/USD is gaining pace and might rally if it settles above 1.3550.
USD/JPY Technical Analysis
The US Dollar attempted a fresh increase above 147.50 against the Japanese Yen. USD/JPY failed to settle above 148.00 and trimmed most gains.
Looking at the 4-hour chart, the pair traded below the 50% Fib retracement level of the upward move from the 146.57 swing low to the 148.18 high. The pair even settled below the 100 simple moving average (red, 4-hour) and the 200 simple moving average (green, 4-hour).
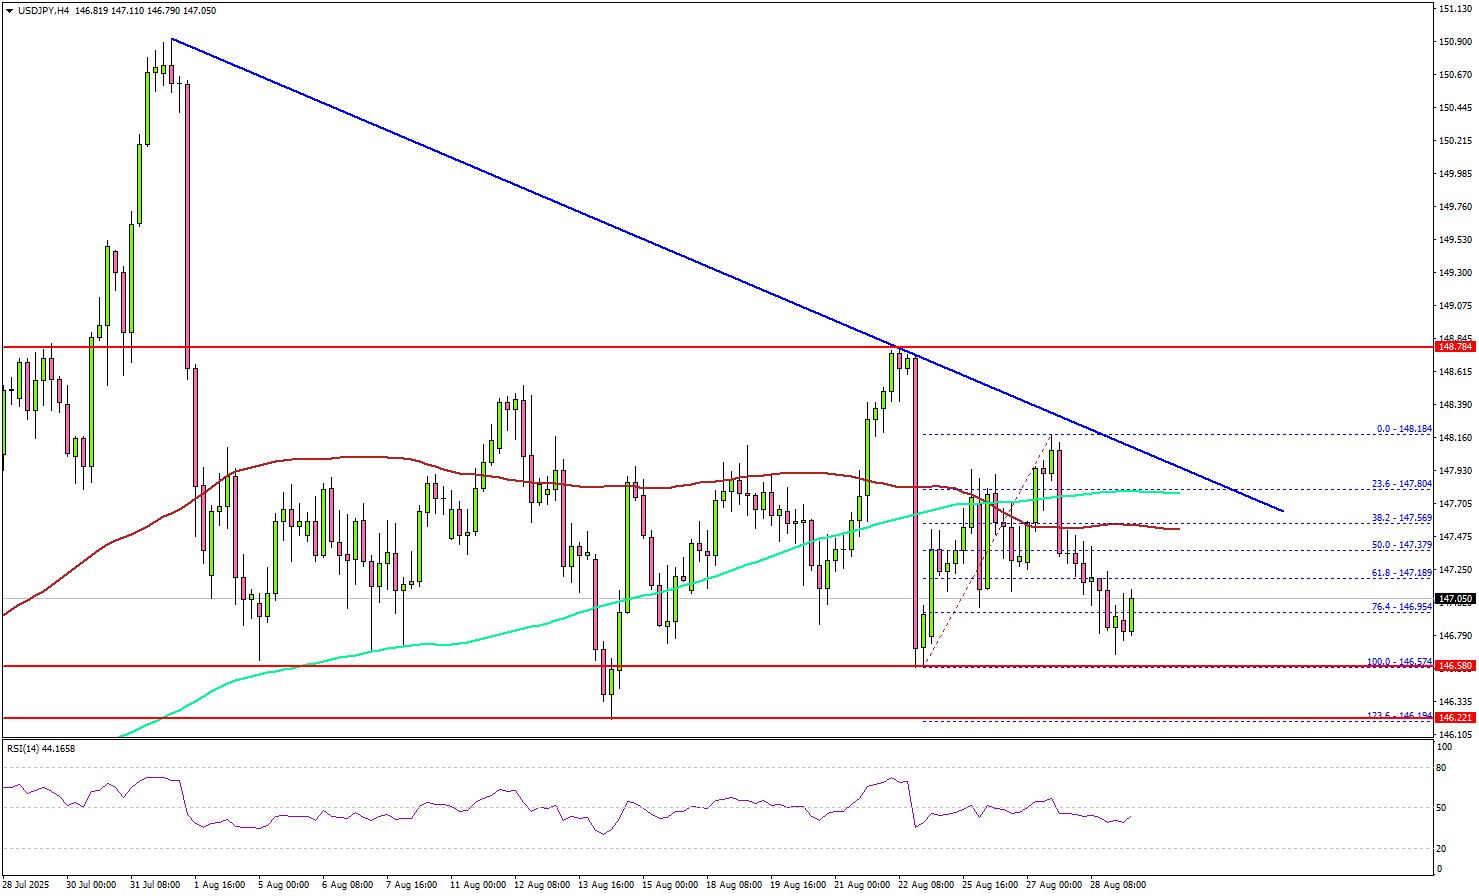
The current price action is bearish below the 61.8% Fib retracement level. On the downside, immediate support is 146.60. The next key support sits at 146.20. Any more losses could send the pair toward the 145.50 support zone.
On the upside, the pair now faces resistance near 147.60. The next key resistance sits at 147.80. There is also a key bearish trend line forming with resistance at 147.80 on the same chart. A close above 147.80 and 148.00 could set the pace for another increase.
In the stated case, the pair could rise toward 148.80, above which the bulls could aim for a move toward 149.20. Any more upsides could send USD/JPY toward 150.00.
Looking at EUR/USD, the pair started a fresh increase, but the bears might again attempt to prevent gains above 1.1720.
Upcoming Key Economic Events:
- US Personal Income for July 2025 (MoM) - Forecast +0.4%, versus +0.3% previous.
- US Core Personal Consumption Expenditure for July 2025 (MoM) - Forecast +0.3%, versus +0.3% previous.
- US Wholesale Inventories for July 2025 (preliminary) – Forecast +0.2%, versus +0.1% previous.
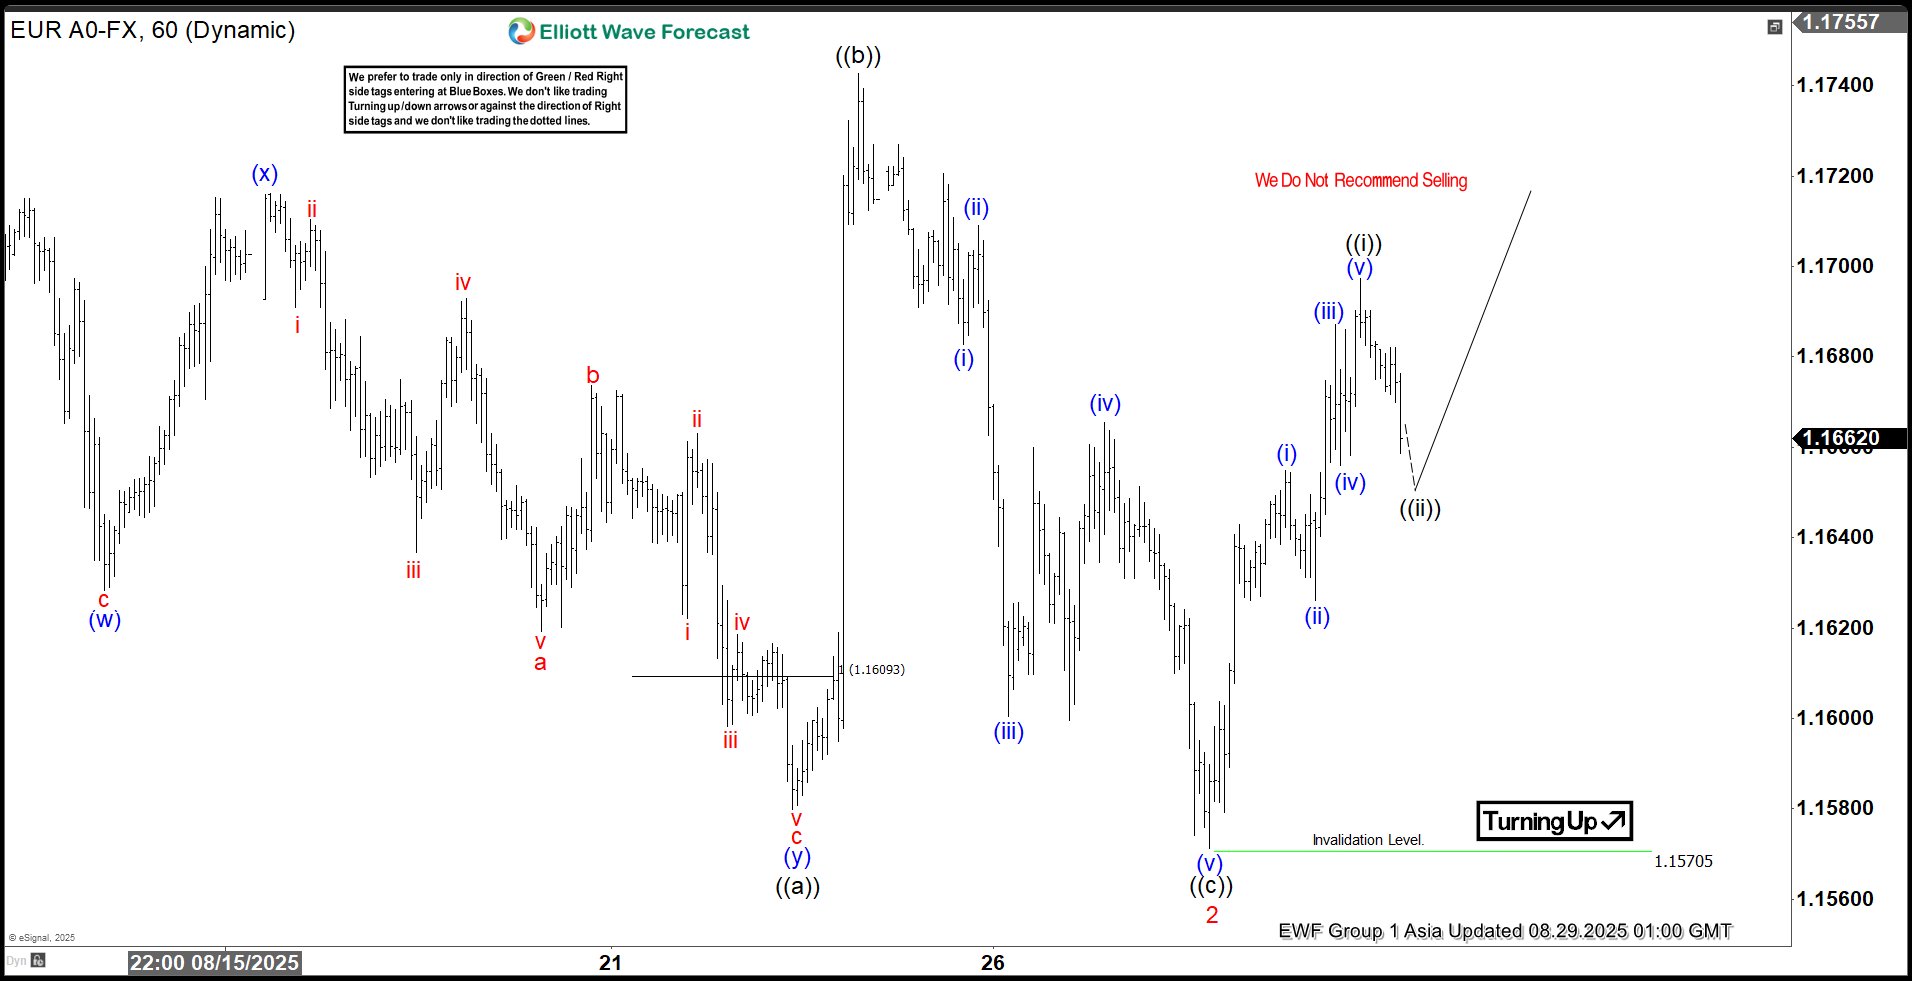
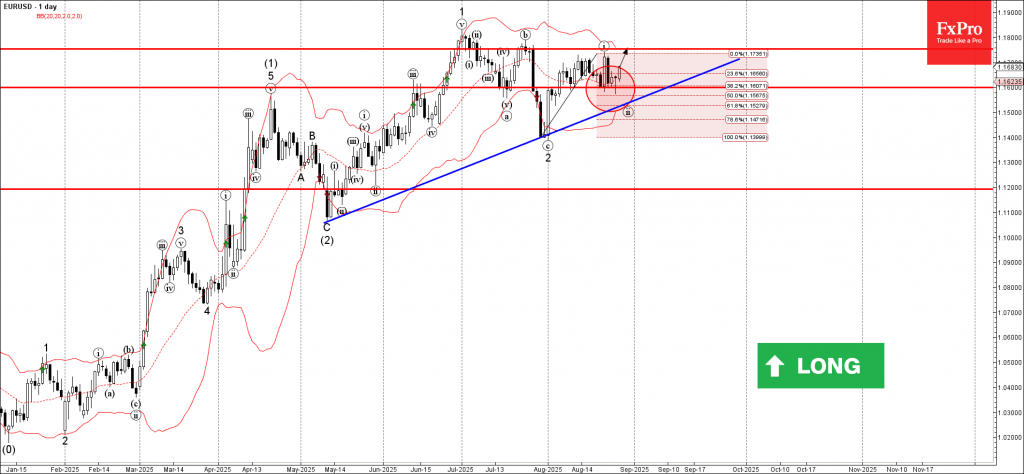
Elliott Wave Analysis: EURUSD Awaits Decisive Move to Confirm Bullish Trend
The short-term Elliott Wave outlook from the August 1, 2025 low projects an ongoing five-wave impulse structure. From that low, wave 1 peaked at 1.173, followed by a wave 2 pullback that concluded at 1.157. The internal structure of wave 2 developed as an Expanded Flat Elliott Wave pattern. After wave 1, wave (w) dropped to 1.1628, and a subsequent wave (x) rally reached 1.1716. Wave (y) then declined to 1.1579, completing wave ((a)) in a higher degree.
The rally in wave ((b)) topped at 1.174 before the pair turned downward in wave ((c)), unfolding as a five-wave impulse. From wave ((b)), wave (i) fell to 1.1682, and wave (ii) rose to 1.1709. Wave (iii) declined to 1.16, followed by a wave (iv) rally to 1.1665. Wave (v) then completed at 1.157, finalizing wave ((c)) of wave 2. The pair has now turned upward in wave 3 but requires a break above wave 1 at 1.173 to eliminate the possibility of a double correction. From wave 2, wave ((i)) reached 1.1697. A wave ((ii)) pullback should find support in a 3, 7, or 11 swing, supporting further upside as long as the pivot at 1.157 holds. This analysis suggests cautious optimism for continued upward momentum.
EURUSD – 60 Minute Elliott Wave Technical Chart:
EURUSD – Elliott Wave Technical Video:
https://www.youtube.com/watch?v=2_BNIdlJFz8
US Oil (WTI) Breaks $65, Russia–Ukraine Talks Regress
Oil is starting to push higher in a strong move as we speak.
After a seven-day consolidation between $63 and $64, prospects for better war outlooks and lower supply helped Oil prices rise from their lows.
A few days of rise tested the lower bound of the previous month's range ($65 to $70.5) as Markets sought more information on the Ukraine-Russia conflict.
Despite the previous weeks of geopolitical meetings between the US, Ukrainian, Russian, and EU Presidents, talks have been in limbo, and the lack of progress, combined with repeated assaults by Russia on Kiev, is not helping the situation.
The German Chancellor Merz just announced that there would be no Zelenskyy-Putin talks, not a big surprise when looking at the lack of headlines going towards that direction.
That comes despite US's Kellogg trying to make things sound better than they really are.
Discover technical levels for WTI trading as price are shooting higher.
US Oil Daily Chart
US Oil Daily Chart, August 28, 2025 – Source: TradingView
The most recent lows in the commodity allowed the formation of an intermediate downward channel, with prices starting to shoot since the last technical rebound.
Some accumulation had led to a breakout which stopped at $65.77 highs on Monday, but the fundamentals not progressing have led to the ongoing rally.
Sanctions on India have been re-iterated by US President Trump and it seems that economically pressuring Russia into a ceasefire will be one of the only ways to reach some type of truce.
The President was saying nice words too early, with the mess-around talks of Putin coming to watch football at the World Cup.
As I am writing this, Bulls are pushing within the $65 Zone.
US Oil 4H Chart
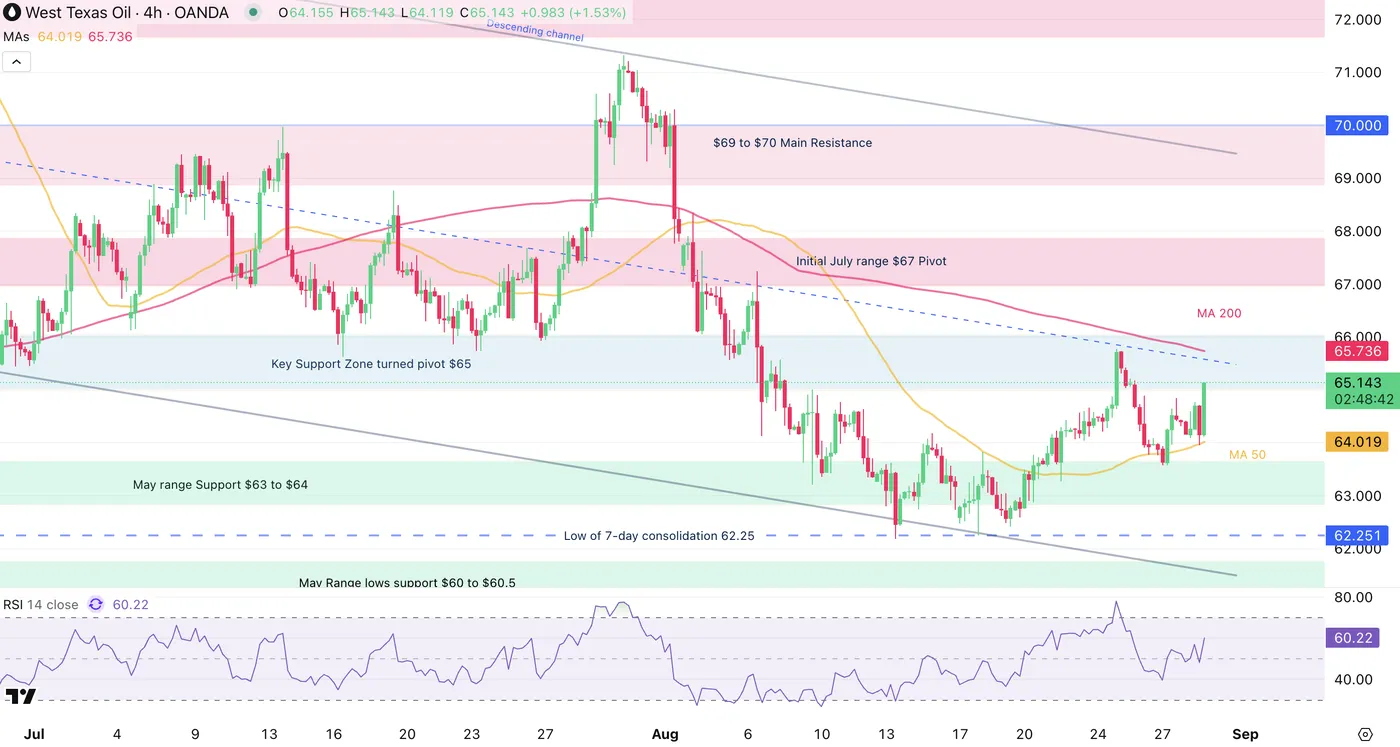
US Oil 4H Chart, August 28, 2025 – Source: TradingView
Bullish momentum is building in the ongoing bullish candle – the latest headlines seem to attract buyers.
Look at a break above the 200-period 4H MA, a break above should attract even more buying.
Level to place on your WTI Charts:
Resistance Levels
- $65 Pivot Zone (getting tested right now)
- Monday highs and 200 4H-MA 65.70
- $66 to $67 Mid-range level
- high range resistance $67.30 to $68 – Confluence with 50 and 200 Day MAs
Support Levels
- $62.00 to $62.50 consolidation support
- Wednesday lows $62.19 (current double bottom)
- $60.5 Low of May Range
- $55 to $57 2025 lows Main support
US Oil 1H Chart
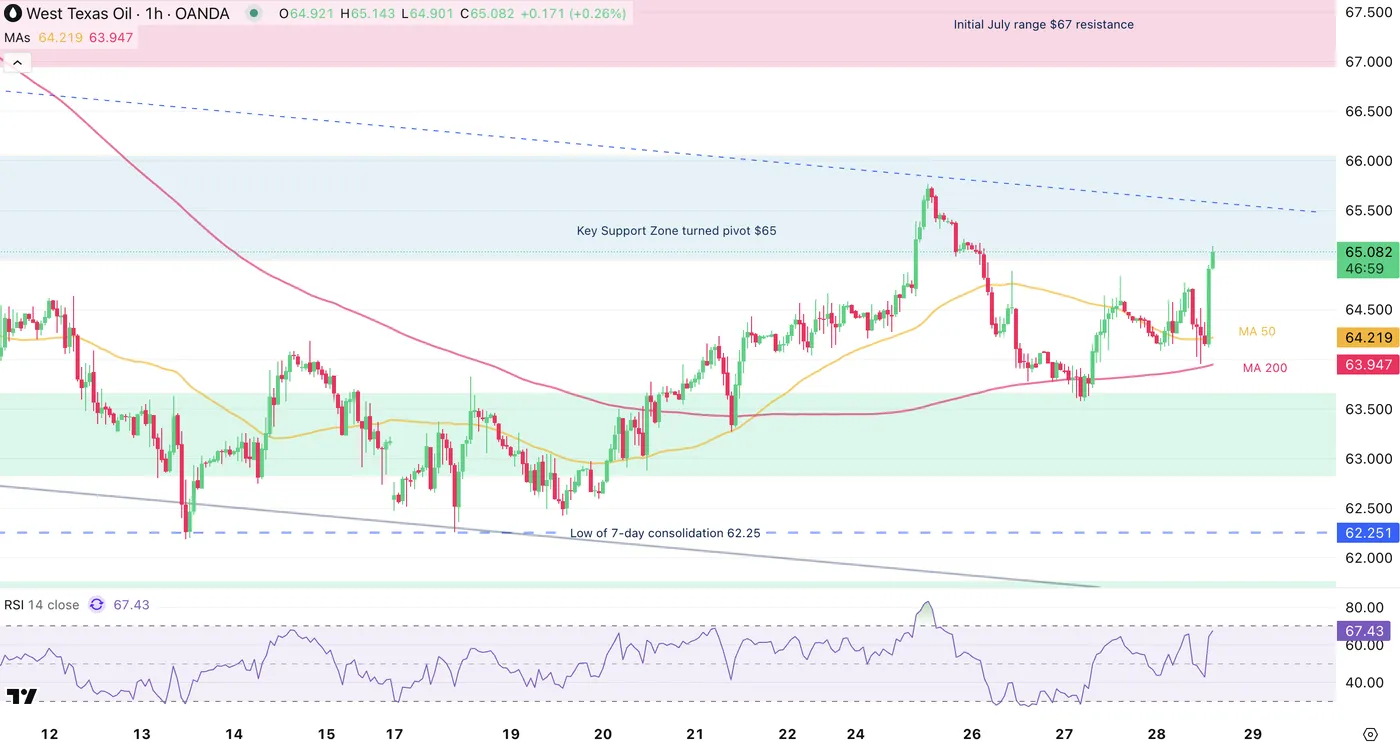
US Oil 1H Chart, August 28, 2025 – Source: TradingView
The current move is strong, watch for potential continuation if the move keeps on going.
It seems that some decent short-selling has been accumulated in the past weeks, and a short-squeeze could come into play – keep an eye on the 4H 200-period MA mentioned above.
Safe Trades!
GBP/USD: Cable Holds Above 1.35000 as Markets Curb BoE Rate Cut Bets
Starting with a UK national holiday, coupled with a noticeably sparse UK economic calendar, the current trading week has been somewhat uneventful for cable traders.
Having only recently secured its best six-monthly performance since 2020, riding a wave of dollar downside, GBP/USD currently floats above the key level of 1.35000 and looks for daily support.
GBP/USD: Key takeaways from today’s session
- Happening some hours ago, a better-than-expected US GDP result introduced some immediate GBP/USD selling pressure as the dollar strengthened.
- Otherwise, and following recent revelations surrounding the Bank of England and Federal Reserve monetary policy, cable downside remains somewhat limited.
GBP/USD: Shifting Bank of England narrative offers cable support
In a few words, markets are currently readjusting expectations of further GBP rate cuts, with the latest reduction to 4% signifying the fifth rate cut made by the BoE in 2025.
This change in narrative is at least in part thanks to a series of hawkish economic data points, most significantly a major outperformance in services PMI and hotter-than-expected inflation as part of data released last week.
This, especially regarding the latter, might offer the Bank of England an opportunity to pause, or even end easing efforts, should they deem appropriate in their upcoming September decision.
While the recent vote ultimately concluded with a rate reduction, the room was noticeably split, again adding to the rationale that the Bank of England is becoming increasingly hawkish, having already cut several times in 2025.
At least one outcome of the above is immediate support for GBP/USD, which goes double when markets overwhelmingly predict a 25 basis point cut will be the Federal Reserve’s next move on September 17th.
GBP/USD: UK-US yield spread case-in-point for monetary policy expectation
While expectations that the Bank of England is changing its stance on monetary policy remain ever-intangible in the market aether, comparing the current direction of UK-US yield spreads offers more concrete evidence of a shifting narrative.
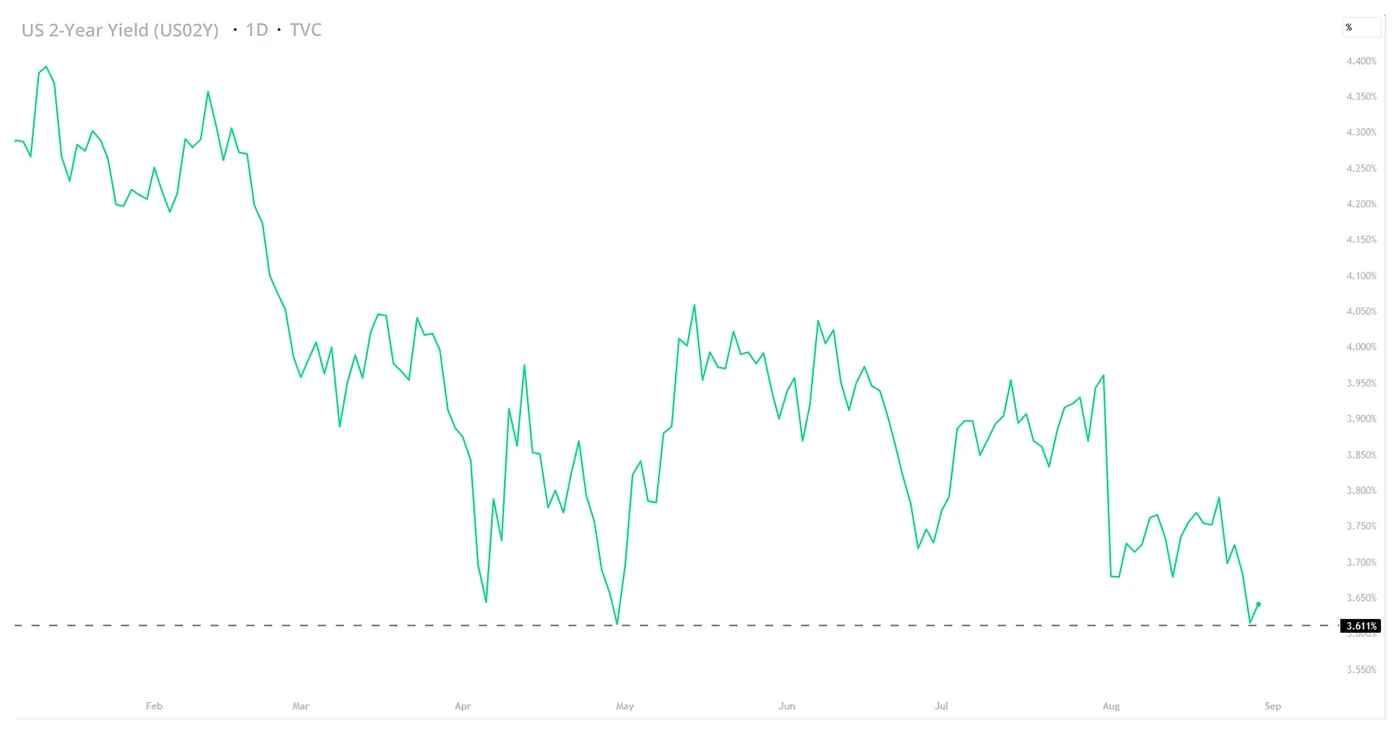
US 2-Year bond yield (US02Y), TVC, TradingView, 28/08/2025
Best explained by recent price action in 2Y treasuries, Monday saw UK 2Y sovereign bond yields meet their highest level since April, while its US counterpart has fallen to 3-month lows.
GBP/USD: US PCE inflation to offer finale to week 35
While this week’s trading has been nothing to write home about regarding UK economic events, the same cannot be said for the United States, set to end the week with the infamous PCE inflation report.
Revered as the Fed’s ‘preferred’ measure of inflation, the Federal Reserve will hope to see inflation at, or lower than, consensus, especially considering expectations of a 25 bps in the upcoming decision.
- Core PCE Expenditures Index (MoM), Friday 28th September 2025, 08:30 NYC
- Core PCE Expenditures Index (YoY), Friday 28th September 2025, 08:30 NYC
- PCE Expenditures Index (YoY), Friday 28th September 2025, 08:30 NYC
- PCE Expenditures Index (YoY), Friday 28th September 2025, 08:30 NYC
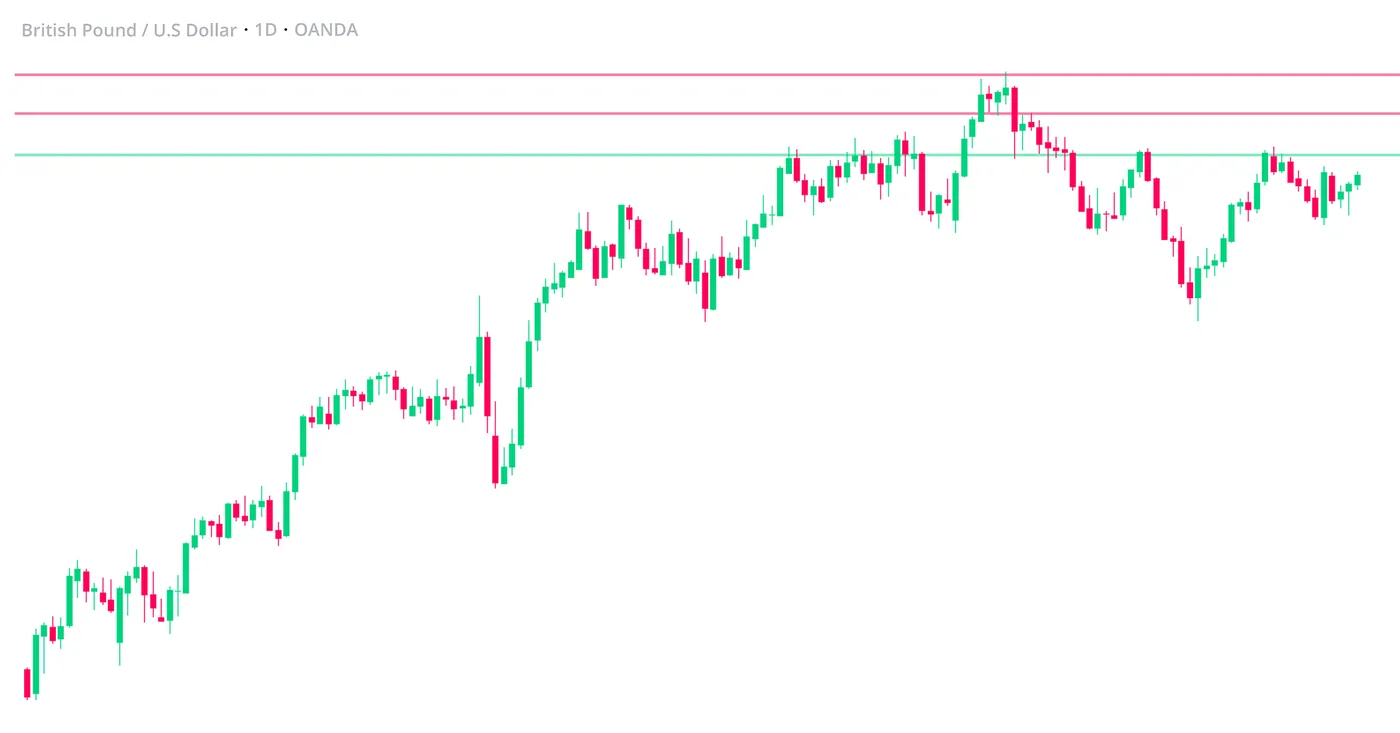
GBP/USD, OANDA, TradingView, 28/08/2025
EURUSD Wave Analysis
EURUSD: ⬆️ Buy
- EURUSD reversed from support zone
- Likely to rise to resistance level 1.1755
EURUSD currency pair recently reversed from the support zone between the strong support level 1.1600 (which has been reversing the price from the start of August), 20-day moving average and the 38.2% Fibonacci correction of the upward impulse from July.
The upward reversal from this support zone created the daily Japanese candlesticks reversal pattern Hammer Doji.
Given the clear daily uptrend and the strongly bearish US dollar sentiment, EURUSD currency pair can be expected to rise to the next resistance level 1.1755 (which has been reversing the price from the start of July).
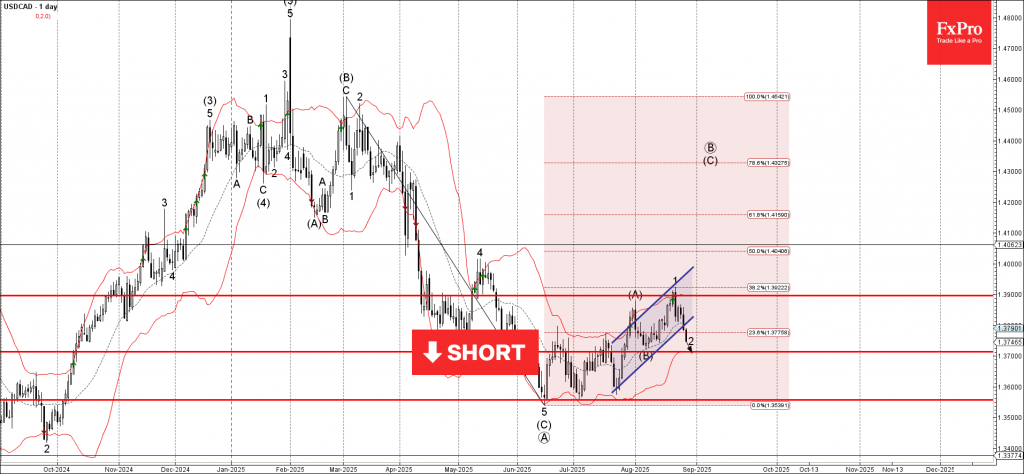
USDCAD Wave Analysis
USDCAD: ⬇️ Sell
- USDCAD broke daily up channel
- Likely to fall to support level 1.3715
USDCAD currency pair recently reversed down from the resistance zone between the resistance level 1.3900, upper daily Bollinger Band and the 38.2% Fibonacci correction of the downward impulse from February.
The price just broke the support trendline of the daily up channel from July – which should accelerate the active wave 2.
Given the clear daily downtrend, USDCAD currency pair can be expected to fall to the next support level 1.3715 (target price for the completion of the active wave 2).
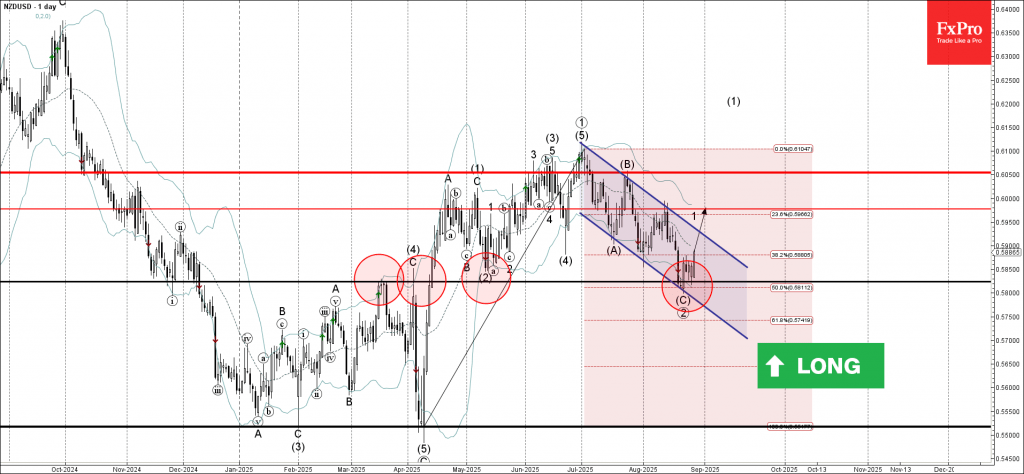
NZDUSD Wave Analysis
NZDUSD: ⬆️ Buy
- NZDUSD reversed from support zone
- Likely to rise to resistance level 0.5980
NZDUSD currency pair recently reversed from the support zone between the strong support level 0.582 (former strong resistance from March and April), lower daily Bollinger Band and the 38.2% Fibonacci correction of the upward impulse from April.
The upward reversal from this support zone created the daily Japanese candlesticks reversal pattern Morning Star – which started the active impulse wave (1).
Given the bearish US dollar sentiment seen across the FX markets today, NZDUSD currency pair can be expected to rise to the next resistance level 0.5980 (target price for the completion of the active impulse wave 1).
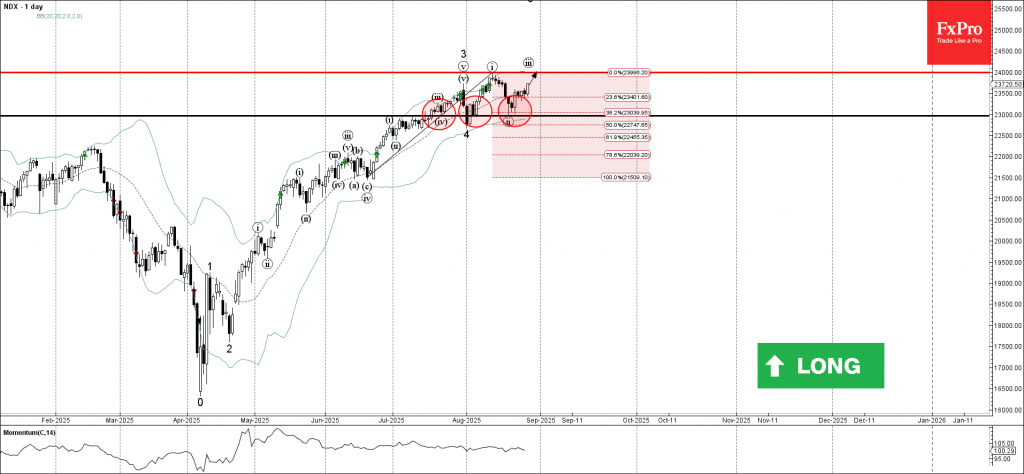
Nasdaq-100 Wave Analysis
Nasdaq-100: ⬆️ Buy
- Nasdaq-100 reversed from support zone
- Likely to rise to resistance level 24000.00
Nasdaq-100 index recently reversed from the support zone between the strong support level 23000.00 (which has been reversing the price from the middle of July), lower daily Bollinger Band and the 38.2% Fibonacci correction of the upward impulse from June.
The upward reversal from this support zone created the daily Japanese candlesticks reversal pattern Hammer – which started the active impulse wave (iii).
Given the strong daily uptrend, Nasdaq-100 index can be expected to rise to the next resistance level 24000.00 (which stopped the earlier impulse wave i).
Euro Gains Ground, US GDP Revised Higher, German CPI Next
The euro has posted gains on Thursday. In the North America session, EUR/USD is trading at 1.1670, up 0.27% on the day.
US GDP revised upwards
US GDP (second-estimate) surprised on the upside, with a gain of 3.3%. This was revised higher from 3.0% in the preliminary estimate and was an impressive turnaround from the 0.5% decline in the first quarter.
After the release of the first-estimate GDP, President Trump called on Federal Reserve Chair Powell to lower interest rates, and it wouldn't be surprising if Trump again uses the strong GDP report to attack Powell.
The US labor market has been softening and the July nonfarm payrolls fell to just 73 thousand. Still, unemployment claims have been steady and today's release showed that claims dropped to 229 thousand, down from a revised 234 thousand last week and just below the market estimate of 230 thousand.
German CPI expected to flatline
Germany releases CPI report on Friday, with a market estimate of 0% m/m for August. This would mark the second flat reading in three months, an indication that inflation is under control. Annually, CPI is expected to nudge up to 2.1% from 2.0%.
Eurozone inflation will be released next week. Headline CPI is currently at 2.0% and core CPI is at 2.3%, with little change expected in the August release.
The European Central Bank took a pause in July after seven straight rate cuts. The ECB meets on September 11 and with inflation largely contained and around the ECB's 2% target, the Bank is not feeling pressure to continue lowering rates.
EUR/USD Technical
- EUR/USD has pushed above resistance above 1.1646 and is testing resistance at 1.1667. Above, there is resistance at 1.1690
- There is support at 1.1623 and 1.1602
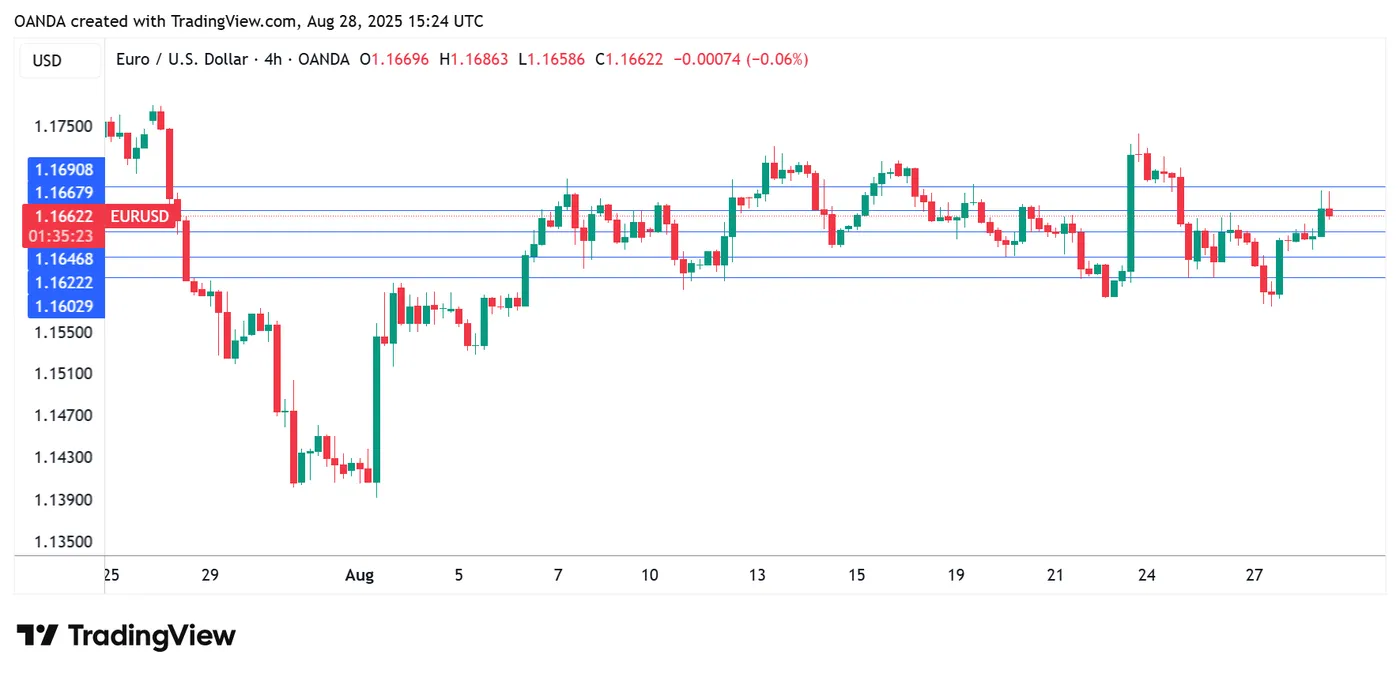
EURUSD 4-Hour Chart, August 28, 2025