Sample Category Title
Ethereum Wave Analysis
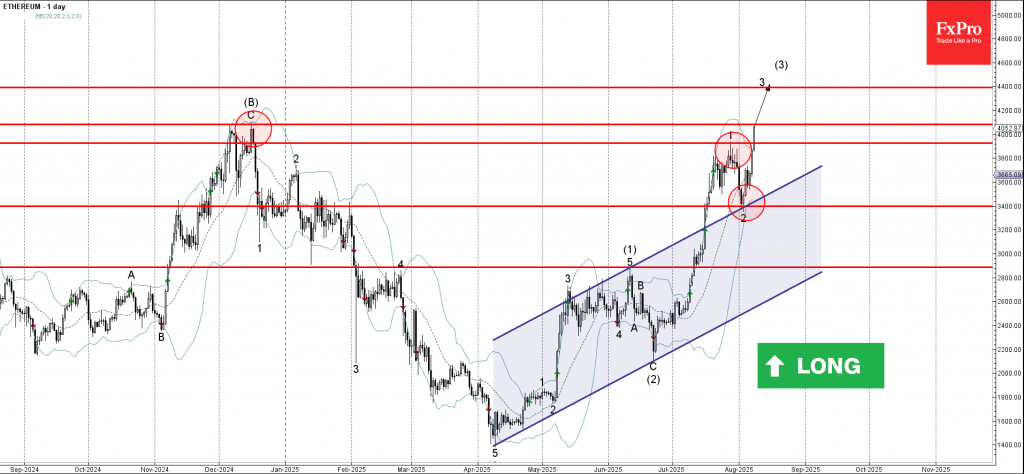
Ethereum: ⬆️ Buy
- Ethereum broke the resistance level 3925.00
- Likely to rise to resistance level 4108.00
Ethereum cryptocurrency recently broke the resistance level 3925.00 (which stopped the previous impulse wave 1 at the end of July).
The breakout of the resistance level 3925.00 continues the active impulse wave 3, which started earlier from the support zone lying at the intersection of the support level 3400.00 and the upper trendline of the daily up channel from April.
Given the clear daily uptrend, Ethereum cryptocurrency can be expected to rise to the next resistance level 4108.00 (multi-month high from December) – the breakout of which can lead to further gains toward 4400.00.
GBP Tops as Risk Currencies Shine, CHF Anchors the Rear
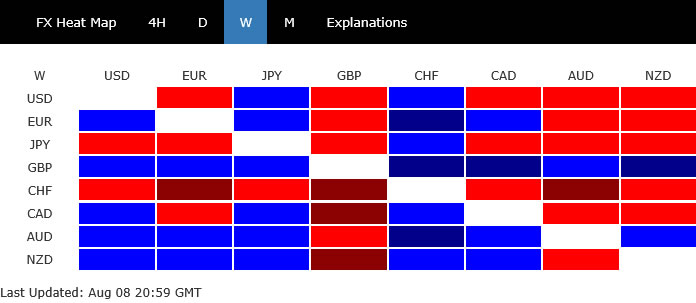
Last week’s FX leaderboard was dominated by growth-linked and higher-yield currencies, with Sterling, Aussie, and Kiwi outpacing the field. At the other end, traditional safe havens found themselves out of favor, with Yen and Swiss Franc bringing up the rear.
Sterling’s climb came on the back of a narrow 5–4 BoE rate cut vote and sharply upgraded inflation forecasts, reinforcing the message that the UK’s easing path will remain gradual at best. In contrast, Franc’s slide reflected both the economic sting of a steep new US tariff and ebbing defensive demand in a risk-on environment.
Australian and New Zealand Dollars drew strength from buoyant equity markets, underpinned by record-breaking US tech gains and a sharp rebound in Japan’s Nikkei. Euro and Loonie sat mid-pack, with modest gains against the softer Dollar.
Dollar weakness was linked less to outright selling pressure and more to recalibrated Fed expectations. A chorus of policymakers signalled growing concern over the labor market, keeping September rate cut bets firm. Yen’s underperformance reflected the dominance of risk-on flows, which overshadowed any revival in BoJ tightening expectations.
Tech Surge, Fed Signals Lift Wall Street, Dollar Stays Heavy
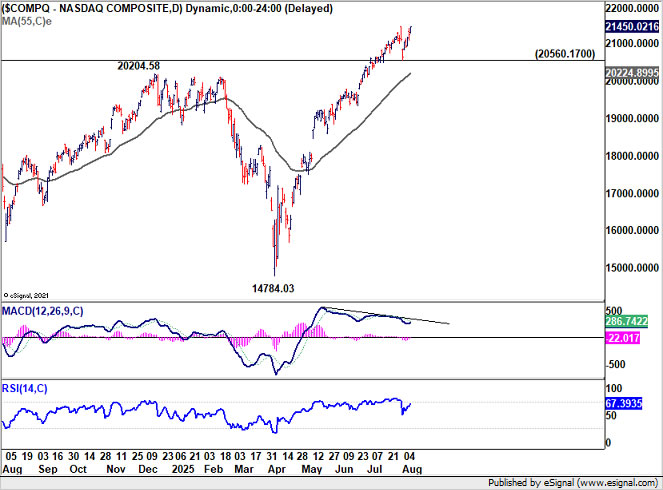
US investor sentiment showed remarkable resilience last week, with equity markets extending their winning streak despite heightened trade policy noise from Washington. DOW rose 1.4%, S&P 500 advanced 2.4%, and NASDAQ surged 3.9% to a record close. The rally was anchored by technology stocks, which extended their dominance as market leaders.
Apple was at the center of the action, gaining 13% in its strongest week since mid-2020. The jump followed the company’s announcement of a USD 600 billion US investment plan spanning four years, a decision interpreted as a pragmatic concession to US President Donald Trump amid heightened trade scrutiny. The move bolstered the S&P 500’s tech sector and provided significant upward momentum to the NASDAQ Composite.
Tech stocks also drew comfort from the perception that the newly announced semiconductor tariffs were less damaging than feared, thanks to a broad slate of exemptions. Trump’s “reciprocal” tariffs, effective from Thursday midnight, were met with muted reaction as traders looked beyond the immediate trade shock.
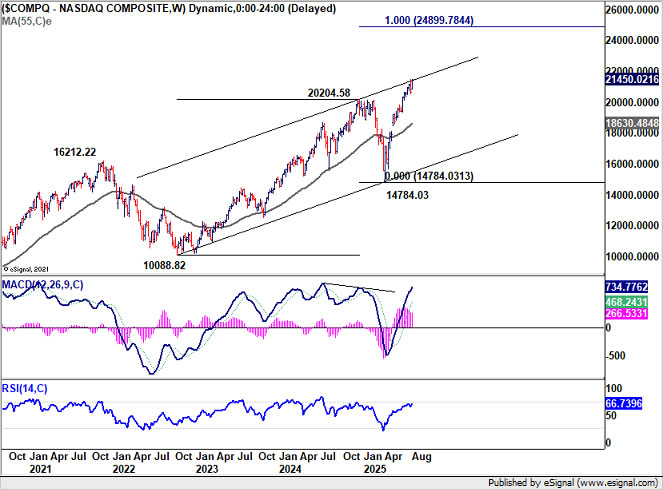
Technically, however, NASDAQ is now pressing against long-term rising channel resistance. Daily MACD continues to show bearish divergence, hinting at waning momentum. Rejection at these levels followed by a drop below 20,560.17 would signal a short-term top at least, with scope for a deeper pullback toward the 55 W EMA (now at 18630.48).
Conversely, a decisive break above the channel with acceleration could unleash further gains, targeting 100% projection from 10088.82 to 20204.58 from 14784.03 at 24899.78 in the medium term. The coming weeks will determine whether momentum can override structural resistance.
A supportive macro driver also came from evolving Fed rhetoric. Several FOMC members signaled a shift toward prioritizing labor market risks over inflation control, raising the odds of a September rate cut. This shift followed a weaker-than-expected July employment report and prior-month revisions pointing to a slowdown.
To name a few, San Francisco Fed President Mary Daly said inflation was easing absent tariffs and that rate cuts would likely be needed in coming months to address a slowing economy. Fed Governor Lisa Cook called the jobs data “concerning” and warned of corporate uncertainty weighing on growth. Minneapolis Fed President Neel Kashkari said he was open to cutting sooner if inflation keeps easing, while Boston Fed President Susan Collins labeled the data a “clear signal” of softening and urged against delays that could deepen a downturn.
Adding to the intrigue, Trump announced his intention to nominate Stephen Miran, chair of the White House Council of Economic Advisers, to fill a Fed board seat vacated by Adriana Kugler. If approved, Miran would serve until January 31, 2026. The appointment, albeit temporary, could increase Trump’s sway over the central bank at a time when he is pressing for faster rate cuts.
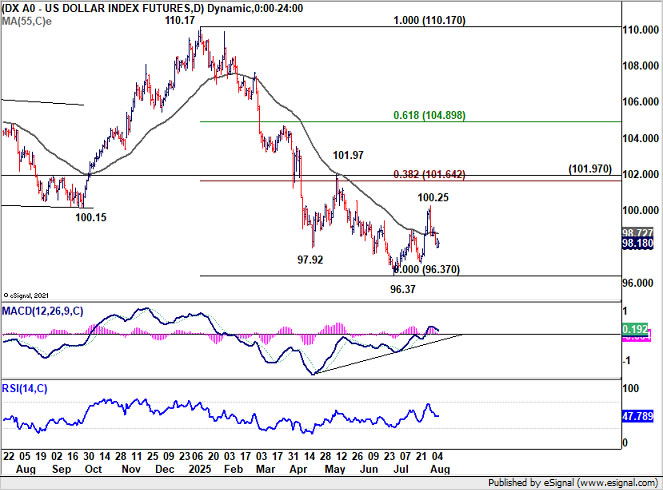
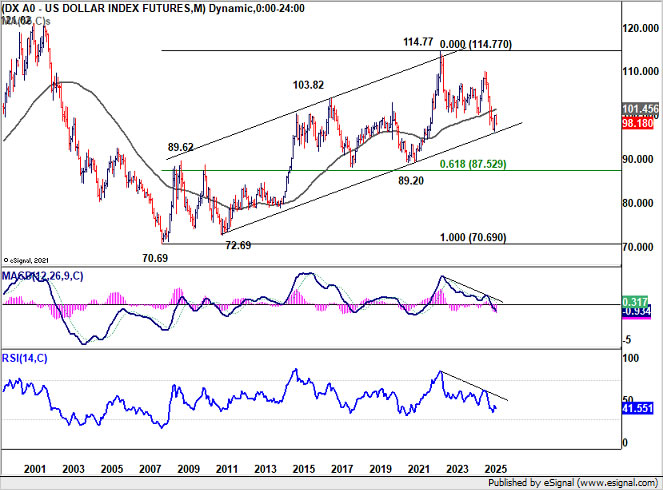
Dollar remained soft, weighed down by Fed easing expectations and buoyant risk appetite. Dollar Index edged lower last week but momentum has been relatively weak. Outlook is unchanged that price actions from 96.37 short term bottom are forming a corrective pattern to the down trend from 110.17. The question is whether it has completely completed at 100.25, or that's just the first leg.
In any case, outlook will stay bearish as long as 101.97 support zone holds, (38.2% retracement of 110.17 to 96.37 at 101.64). Break of 96.37 to resume larger down trend is still in favor.
Nikkei Eyes Break Above Record, AUD/JPY Rebound With Risk-on Mood
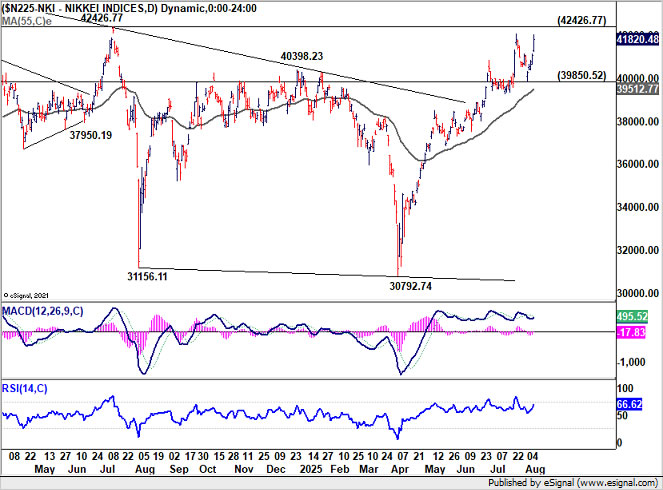
Japan’s Nikkei ended the week with strong momentum, reversing early weakness to close sharply higher. The index is now within striking distance of a record high again, buoyed by a resolution to a brief US-Japan trade hiccup that had initially rattled sentiment.
Thursday’s implementation of new US tariffs on Japanese goods sparked unease after reports suggested rates exceeded the agreed 15% limit under the bilateral deal. Markets took relief when Tokyo’s top trade negotiator confirmed that Washington had acknowledged the error and would make corrections, clearing the way for renewed optimism.
The BoJ’s July Summary of Opinions captured the improved tone from the trade deal, even though policymakers were cautious, stressing that it would take two to three months of incoming data to judge the real impact of US tariffs. Some members suggested that if the US economy remains resilient, Japan’s downside risks would diminish. Such an environment could allow the BoJ to contemplate a year-end policy adjustment, moving further along the normalization path.
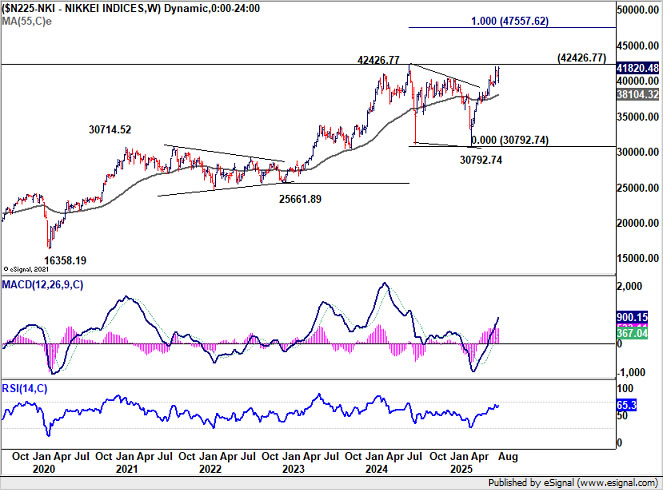
Technically, near term outlook in Nikkei will stay bullish as long as 39850.52 support holds. Retest of 42426.77 record high should be seen next. Decisive break there will resume the long term up trend. Next medium term target is 100% projection of 25661.89 to 42426.77 from 30792.74 at 47557.62.
Yen’s performance last week reflected a familiar dynamic. While revived expectations of a BoJ rate hike later this year provided some theoretical support, risk-on flows — both domestic and global — completely overshadowed safe-haven demand for the currency.
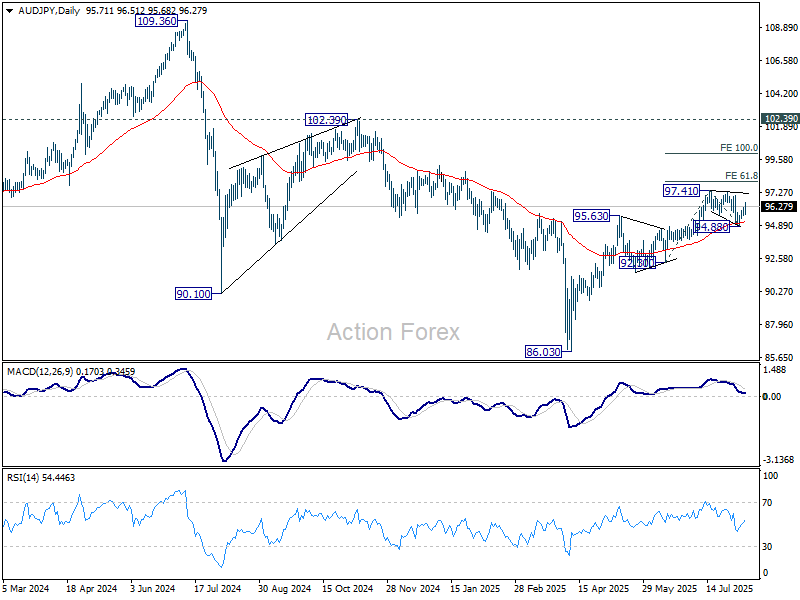
In cross-market terms, AUD/JPY's extended bounce suggests that near term correction from 97.41 has completed at 94.88, after hitting 55 D EMA (now at 95.09). Rise from 86.03 should be ready to resume through 97.41 to 61.8% projection of 92.30 to 97.41 from 94.88 at 98.03.
Whether the rally can extend toward 100% projection at 99.99 will depend in part on Wall Street’s ability to break NASDAQ's long-term channel resistance mentioned above, as well as Nikkei's momentum after clearing the record high.
GBP/CHF Jumps 1.85% on BoE Hawkishness and Swiss Trade Woes
Sterling closed last week as the strongest G10 currency, lifted by BoE’s surprise hawkish tilt despite delivering its expected quarter-point rate cut. The Monetary Policy Committee voted 5–4 to reduce the Bank Rate to 4.00%, with the narrow margin underscoring the internal debate over inflation risks and signalling caution over further near-term easing.
The August Monetary Policy Report reinforced that message, with the BoE sharply revising its inflation projections higher. Q4 CPI is now forecast at 3.8% in 2025, 2.7% in 2026, and 2.0% in 2027, compared with May’s 3.5%, 2.4%, and 1.9%. The upgraded outlook effectively removes any scope for accelerating the easing cycle beyond the current pace of one cut per quarter.
A further 25bps reduction in November remains the base case, completing this year’s easing cycle. However, despite growing concerns about labour market softening and sluggish growth, policymakers appear unwilling to front-load additional support. Instead, any extra stimulus is more likely to be delivered via an extended run of smaller cuts into 2026.
In stark contrast, Swiss Franc ended as the worst performer of the week. Slightly stronger-than-expected July CPI, ticking up to 0.2% yoy suggested less urgency for the SNB to push its policy rate from 0.00% into negative territory, but it was overshadowed by a severe new external headwind.
That headwind came in the form of a 39% US tariff on Swiss imports — among the highest applied under Washington’s global tariff overhaul. Only a handful of countries, including Brazil and India at 50%, face higher levies. The rate stands in sharp contrast to the 15% applied to EU goods and the 10% on UK exports, delivering a blow to Switzerland’s export-reliant manufacturing base.
The combined impact of BoE policy hawkishness and Swiss trade vulnerability propelled GBP/CHF higher by 1.85% last week, making it the biggest mover. The rally reflects both fundamental divergence and shifting capital flows into Sterling.
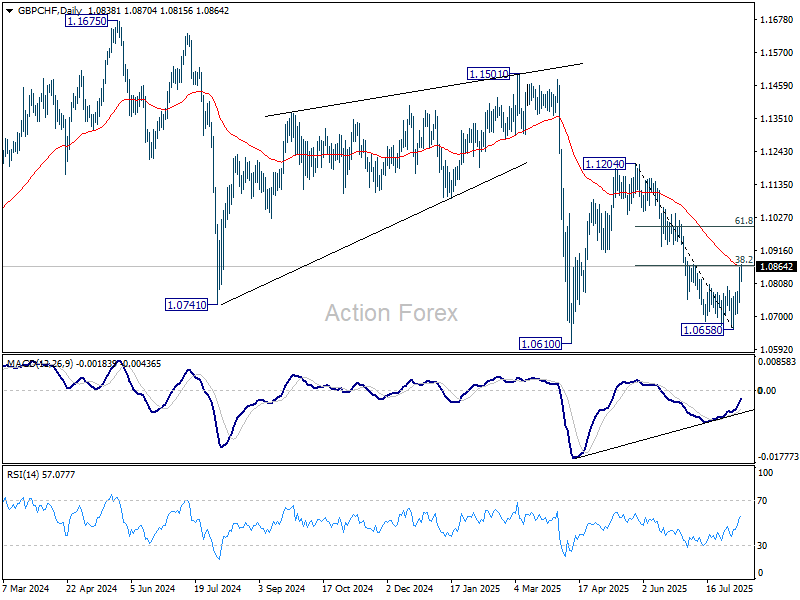
Technically, the strong bounce confirms short term bottoming at 1.0658 in GBP/CHF. Immediate focus is on 55 D EMA (now at 1.0815). Sustained trading above there will argue that fall from 1.1204 has completed. Rise from there is then seen as the third leg of the pattern from 1.0610, and should target 61.8% retracement of 1.1204 to 1.0658 at 1.0995, or even further to 1.1204 and above.
EUR/USD Weekly Outlook
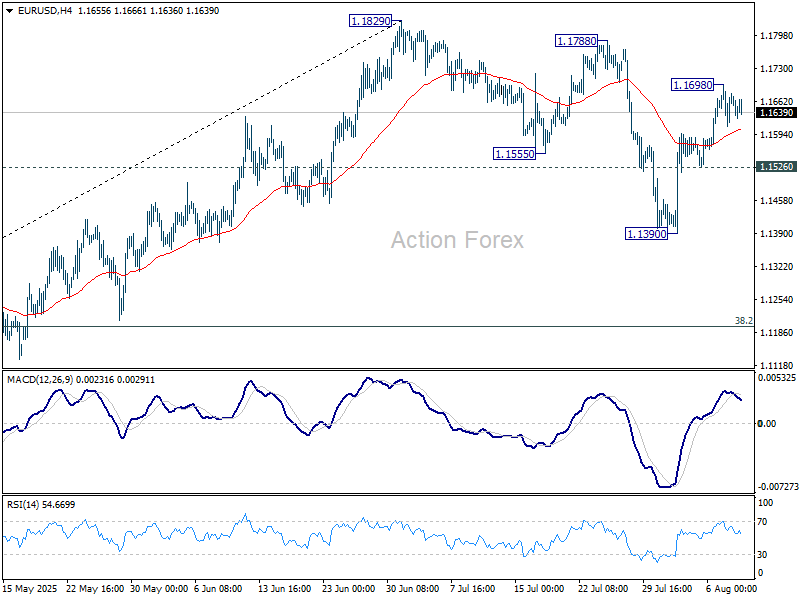
EUR/USD's rebound from 1.1390 extended to 1.1698 last week but retreated since then. Initial bias remains neutral this week first. Outlook is unchanged that correction from 1.1829 should have completed with three waves down to 1.1390. Above 1.1698 will bring retest of 1.1829. However, break of 1.1526 support will dampen this bullish view and bring deeper fall back to 1.1390 instead.
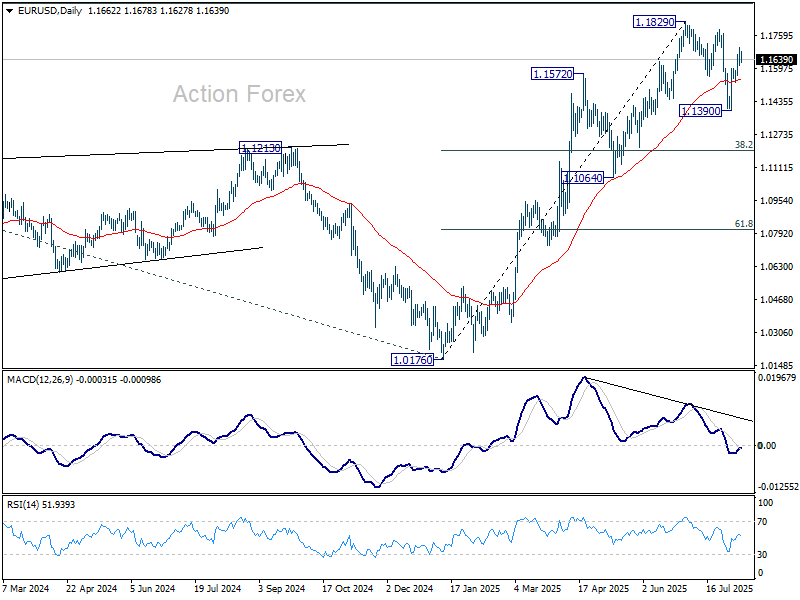
In the bigger picture, rise from 0.9534 long term bottom could be correcting the multi-decade downtrend or the start of a long term up trend. In either case, further rise should be seen to 100% projection of 0.9534 to 1.1274 from 1.0176 at 1.1916. This will remain the favored case as long as 1.1604 support holds.
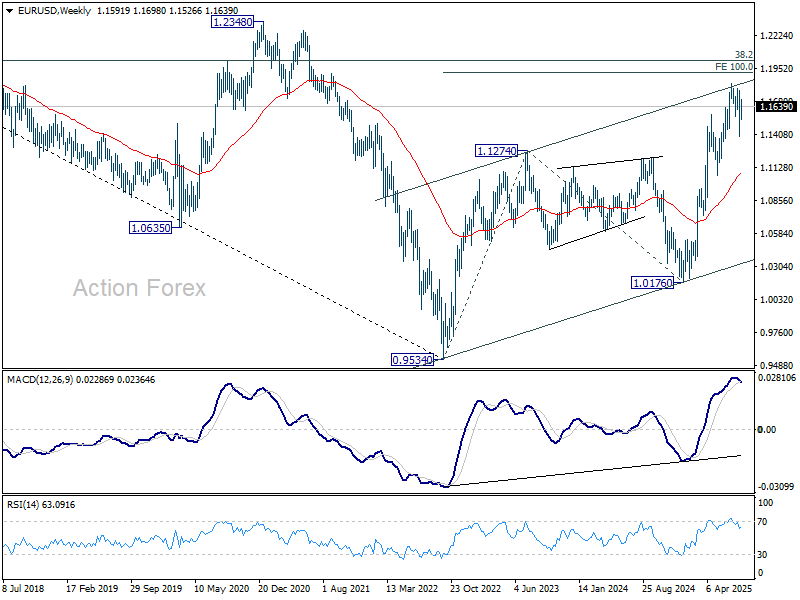
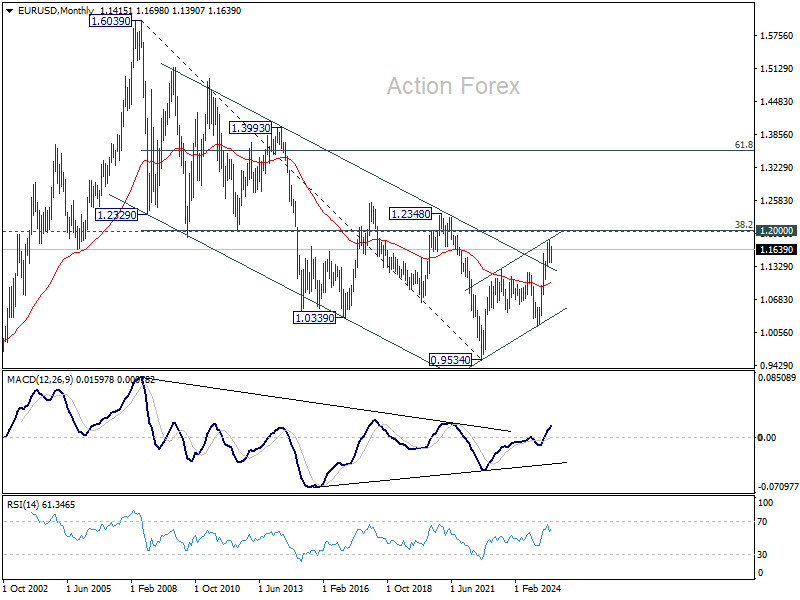
In the long term picture, a long term bottom was in place already at 0.9534, on bullish convergence condition in M MACD. Further rise should be seen to 38.2% retracement of 1.6039 to 0.9534 at 1.2019. Rejection by 1.2019 will keep the price actions from 0.9534 as a corrective pattern. But sustained break of 1.2019 will suggest long term bullish trend reversal, and target 61.8% retracement at 1.3554.
EUR/USD Weekly Outlook
EUR/USD's rebound from 1.1390 extended to 1.1698 last week but retreated since then. Initial bias remains neutral this week first. Outlook is unchanged that correction from 1.1829 should have completed with three waves down to 1.1390. Above 1.1698 will bring retest of 1.1829. However, break of 1.1526 support will dampen this bullish view and bring deeper fall back to 1.1390 instead.
In the bigger picture, rise from 0.9534 long term bottom could be correcting the multi-decade downtrend or the start of a long term up trend. In either case, further rise should be seen to 100% projection of 0.9534 to 1.1274 from 1.0176 at 1.1916. This will remain the favored case as long as 1.1604 support holds.
In the long term picture, a long term bottom was in place already at 0.9534, on bullish convergence condition in M MACD. Further rise should be seen to 38.2% retracement of 1.6039 to 0.9534 at 1.2019. Rejection by 1.2019 will keep the price actions from 0.9534 as a corrective pattern. But sustained break of 1.2019 will suggest long term bullish trend reversal, and target 61.8% retracement at 1.3554.
USD/JPY Weekly Outlook
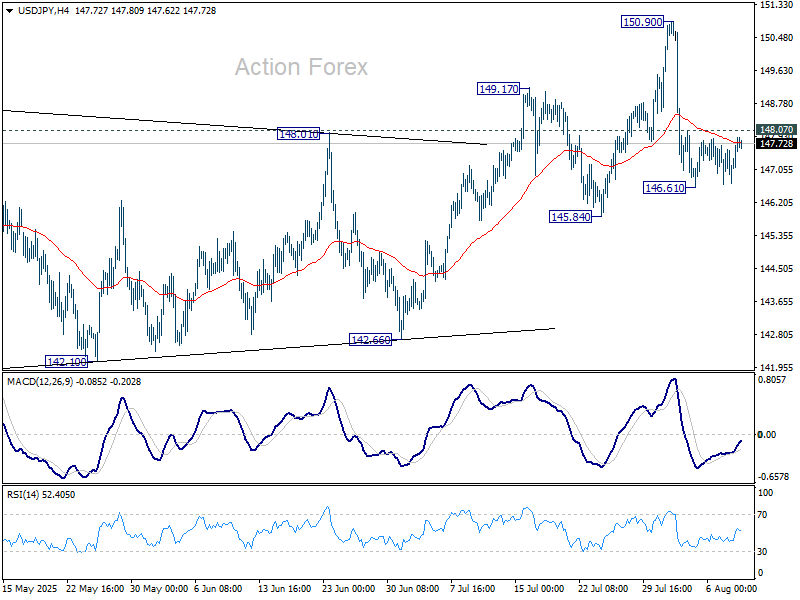
USD/JPY edged lower to 146.61 last week but turned sideway since then. Initial bias remains neutral this week first. As long as 145.84 support holds, larger rebound from 139.87 is still expected to continue. On the upside, above 148.07 minor resistance will bring retest of 150.90 high first. However, decisive break of 145.84 will indicate near term bearish reversal and target 142.66 support next.
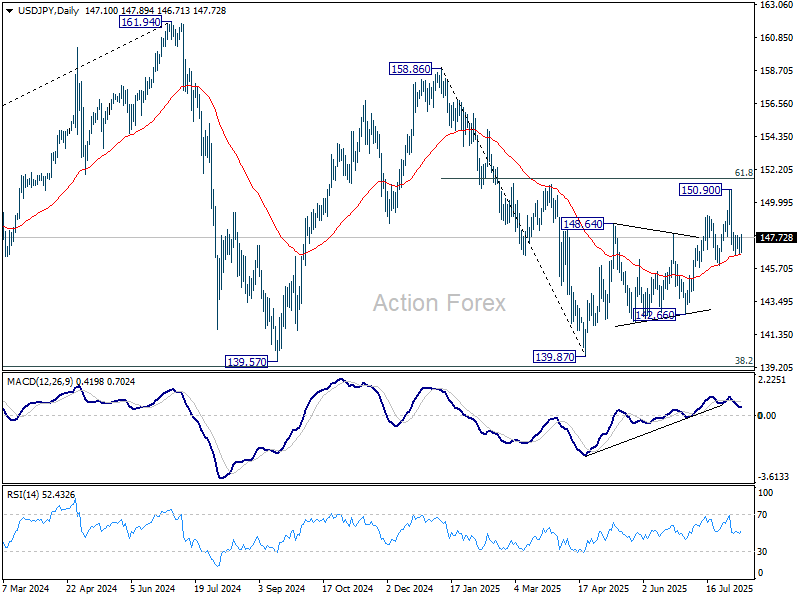
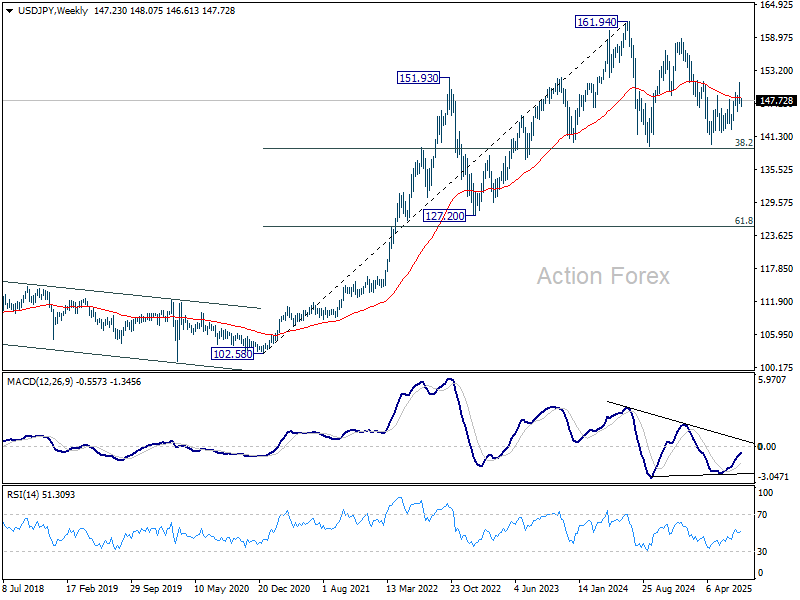
In the bigger picture, price actions from 161.94 (2024 high) are seen as a corrective pattern to rise from 102.58 (2021 low). Decisive break of 61.8% retracement of 158.86 to 139.87 at 151.22 will argue that it has already completed with three waves at 139.87. Larger up trend might then be ready to resume through 161.94 high. In case the corrective pattern extends with another fall, strong support is expected from 38.2% retracement of 102.58 to 161.94 at 139.26 to bring rebound.
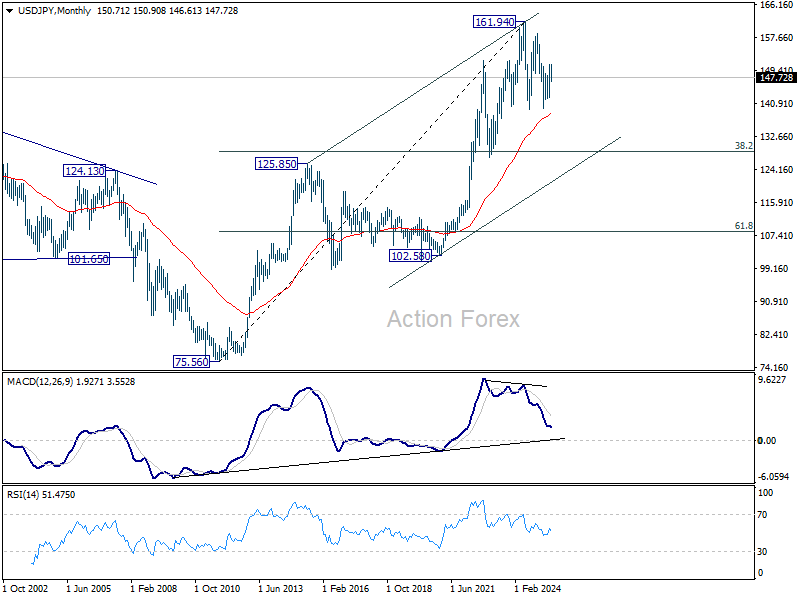
In the long term picture, there is no sign that up trend from 75.56 (2011 low) has completed. But then, firm break of 161.94 is needed to confirm resumption. Otherwise, more medium term range trading could still be seen.
GBP/USD Weekly Outlook
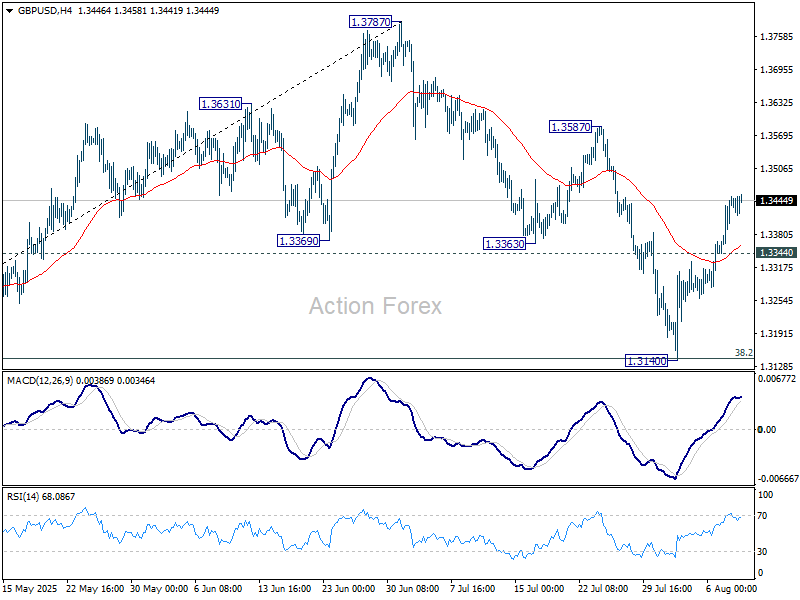
GBP/USD's extended rebound and firm break of 1.3363 support turned resistance last week suggests that correction from 1.3787 has completed with three waves down to 1.3140, after hitting 38.2% retracement of 1.2099 to 1.3787 at 1.3142. Initial bias remains on the upside for 1.3587 resistance first. Firm break there will pave the way to retest 1.3787 high. However, break of 1.3344 minor support will dampen this bullish case and turn bias neutral again first.
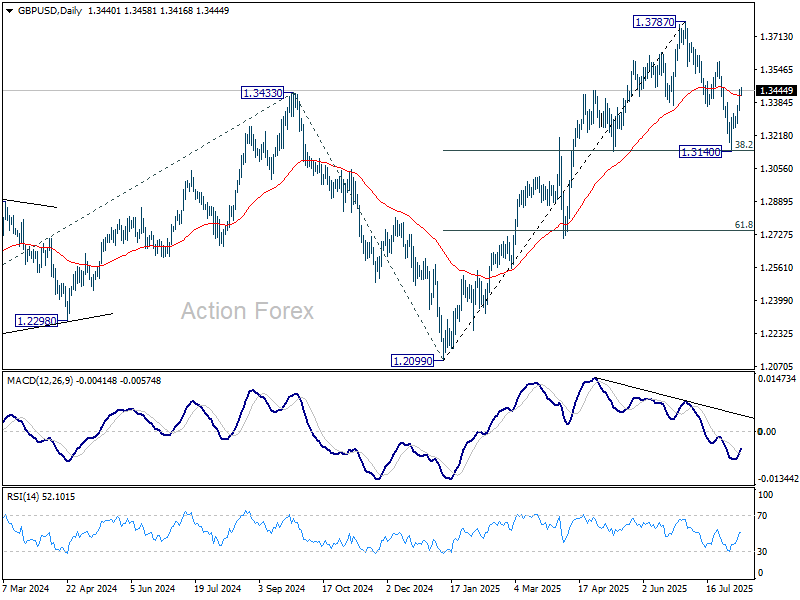
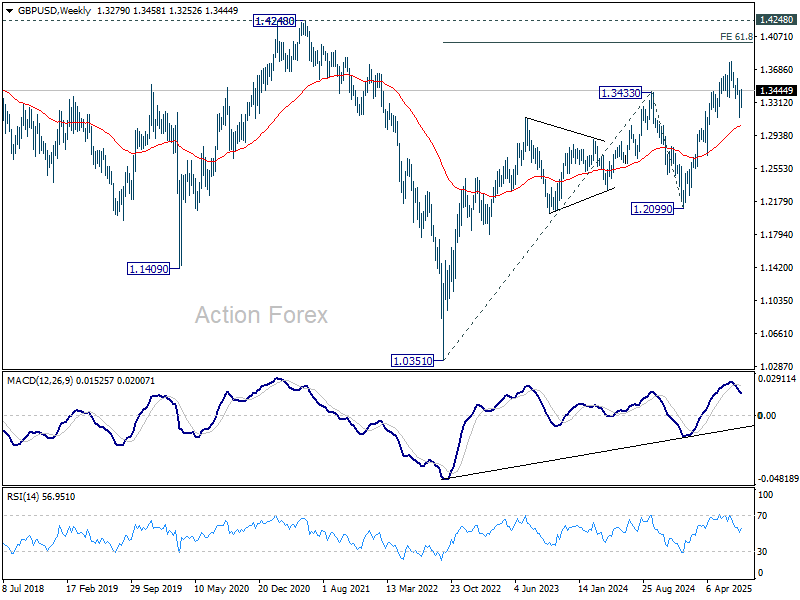
In the bigger picture, up trend from 1.3051 (2022 low) is in progress. Next medium term target is 61.8% projection of 1.0351 to 1.3433 from 1.2099 at 1.4004. Outlook will now stay bullish as long as 55 W EMA (now at 1.3055) holds, even in case of deep pullback.
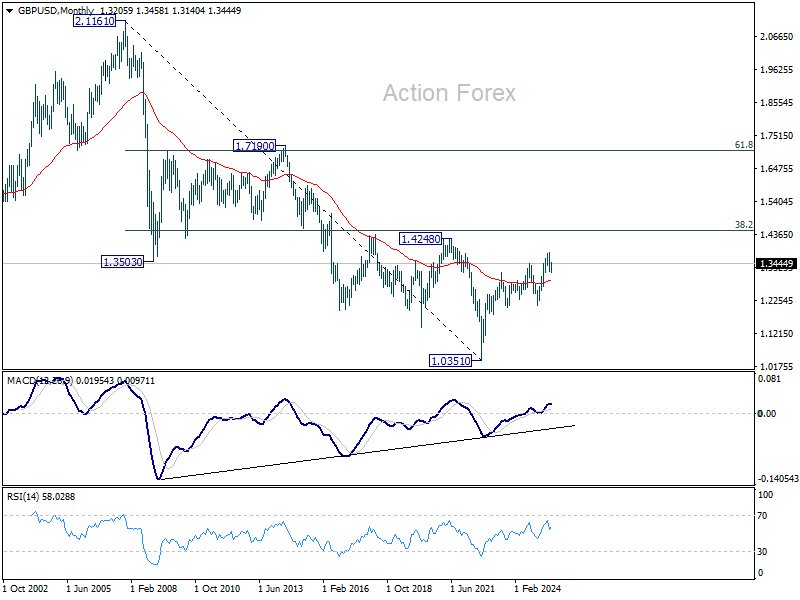
In the long term picture, for now, price actions from 1.0351 (2022 low) are still seen as a corrective pattern to the long term down trend from 2.1161 (2007 high) only. However, firm break of 1.4248 resistance (38.2% retracement of 2.1161 to 1.0351 at 1.4480) will be a strong sign of long term bullish reversal.
USD/CHF Weekly Outlook
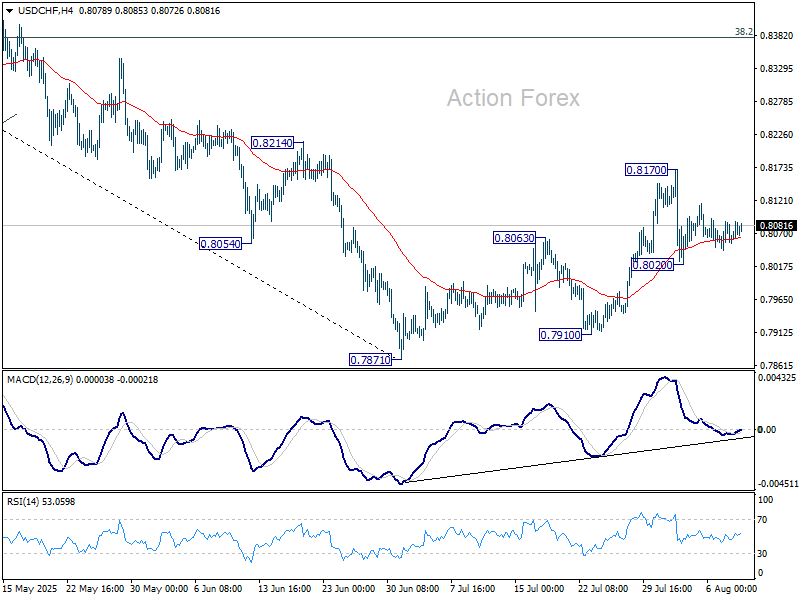
USD/CHF dipped to 0.8020 last week but quickly recovered and turned sideway. Initial bias stays neutral this week first. On the downside, break of 0.8020 will solidify the case that corrective pattern from 0.7871 has completed at 0.8170. Further fall should be seen back to retest 0.7871 low. However, break of 0.8710 will resume the corrective rise towards 38.2% retracement of 0.9200 to 0.7871 at 0.8379.
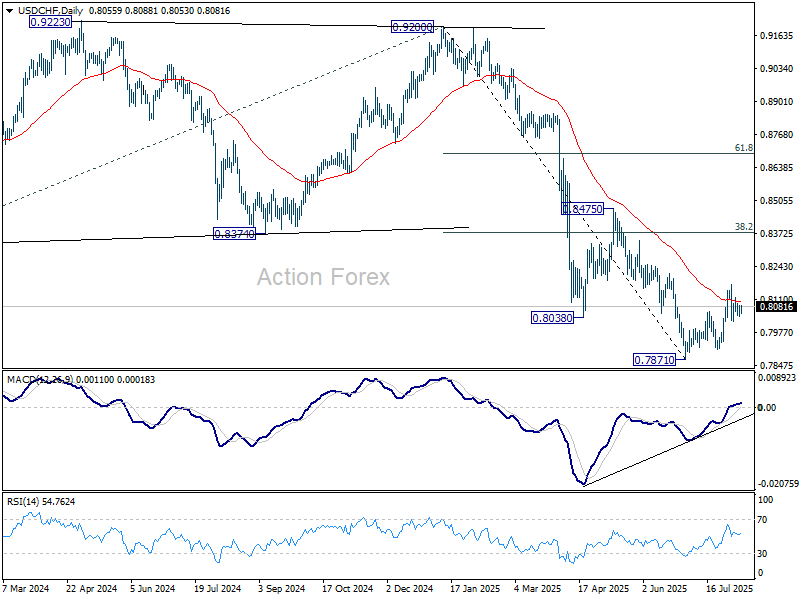
In the bigger picture, long term down trend from 1.0342 (2017 high) is still in progress. Next target is 100% projection of 1.0146 (2022 high) to 0.8332 from 0.9200 at 0.7382. In any case, outlook will stay bearish as long as 0.8475 resistance holds.
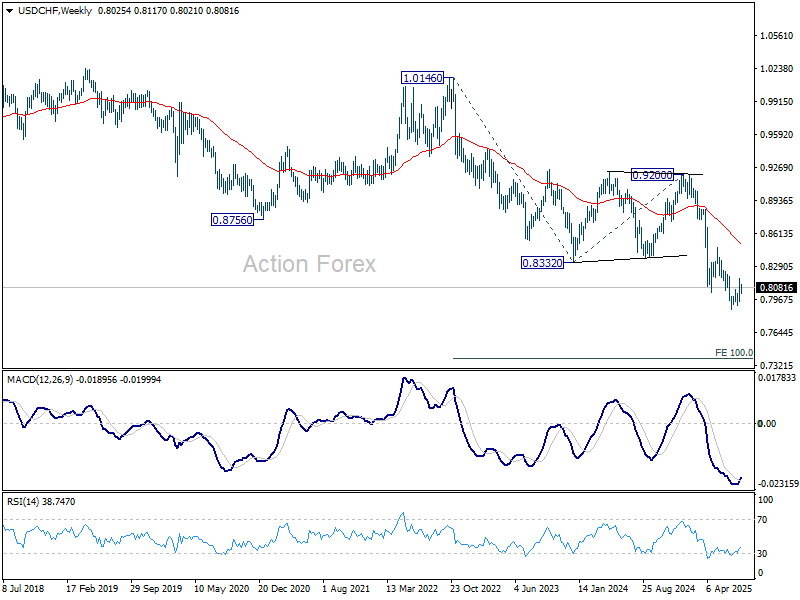
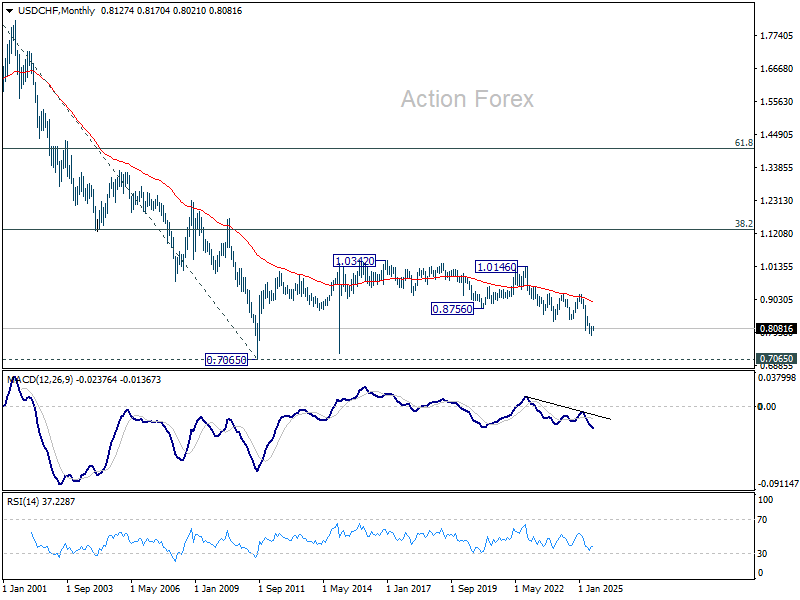
In the long term picture, price action from 0.7065 (2011 low) are seen as a corrective pattern to the multi-decade down trend from 1.8305 (2000 high). It's uncertain if the fall from 1.0342 is the second leg of the pattern, or resumption of the downtrend. But in either case, outlook will stay bearish as long as 0.9200 resistance holds. Retest of 0.7065 should be seen next.
AUD/USD Weekly Report
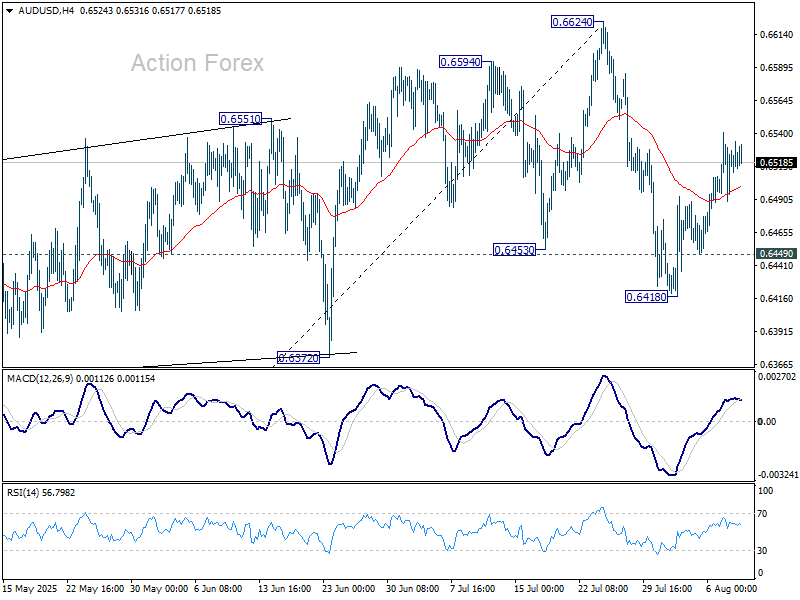
AUD/USD's extended rebound last week suggests that corrective fall from 0.6624 has completed at 0.6418 already. Initial bias stays mildly on the upside this week for retesting 0.6624 high. On the downside, however, firm break of 0.6449 will argue that the pattern from 0.6624 is extending with another falling leg, and target 38.2% retracement of 0.5913 to 0.6624 at 0.6352.
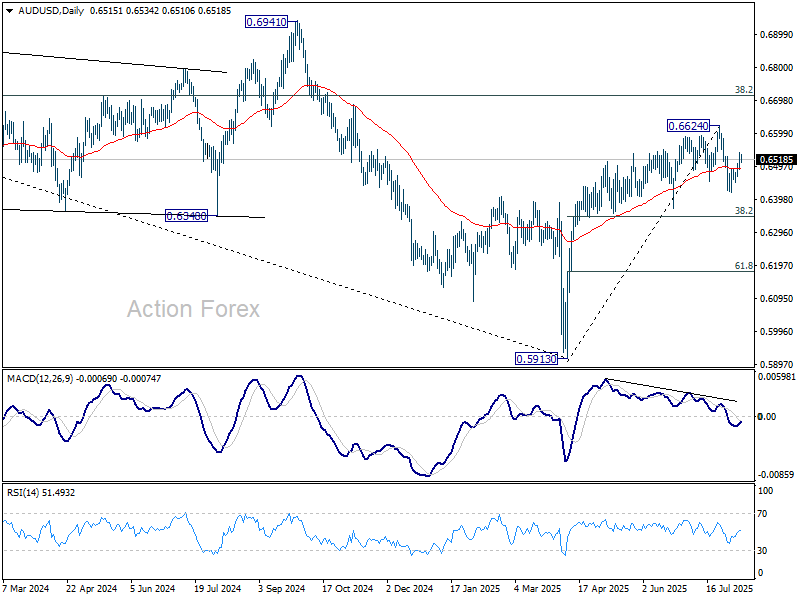
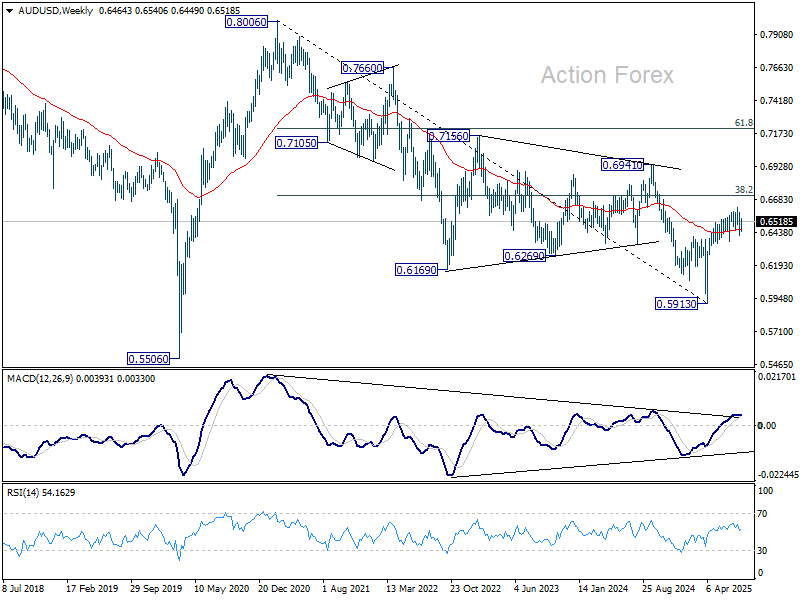
In the bigger picture, there is no clear sign that down trend from 0.8006 (2021 high) has completed. Rebound from 0.5913 is seen as a corrective move. While stronger rally cannot be ruled out, outlook will remain bearish as long as 38.2% retracement of 0.8006 to 0.5913 at 0.6713 holds. Nevertheless, considering bullish convergence condition in W MACD, even in case of another fall through 0.5913, downside should be contained above 0.5506 (2020 low).
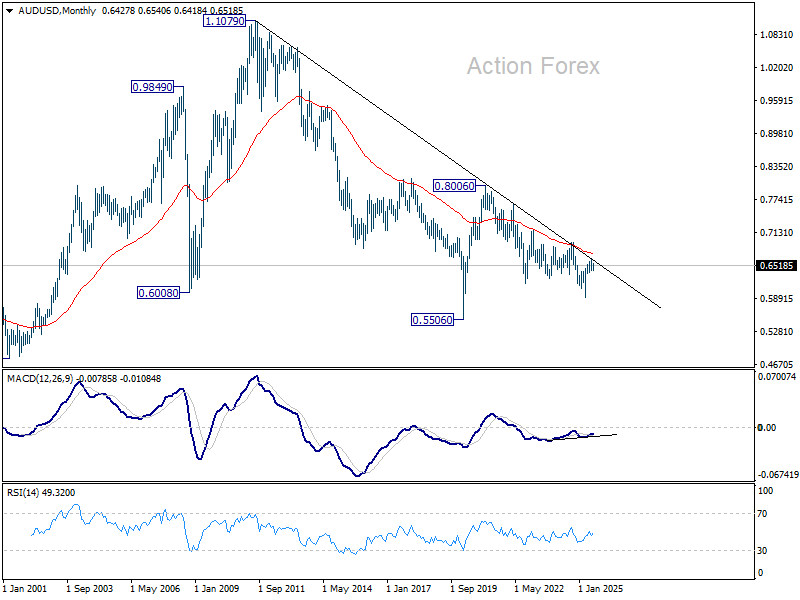
In the long term picture, fall from 0.8006 is seen as the second leg of the corrective pattern from 0.5506 long term bottom (2020 low). Hence, in case of deeper decline, strong support should emerge above 0.5506 to contain downside to bring reversal. On the upside, firm break of 0.6941 will argue that the third leg has already started back to 0.8006.
USD/CAD Weekly Outlook
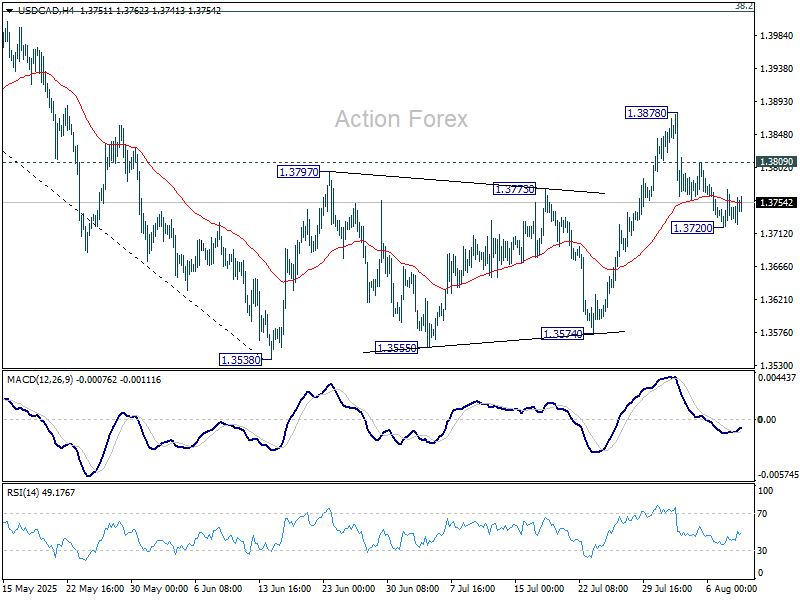
USD/CAD gyrated lower to 1.3720 last week and then turned sideway. Initial bias remains neutral this week first. On the downside, break of 1.3720 will reaffirm the case that corrective pattern from 1.3538 has completed at 1.3878. Further decline should then be seen back to retest 1.3538 low. However, break of 1.3809 will bring retest of 1.3878. Further break there will extend the corrective rebound from 1.3538 with another rising leg.
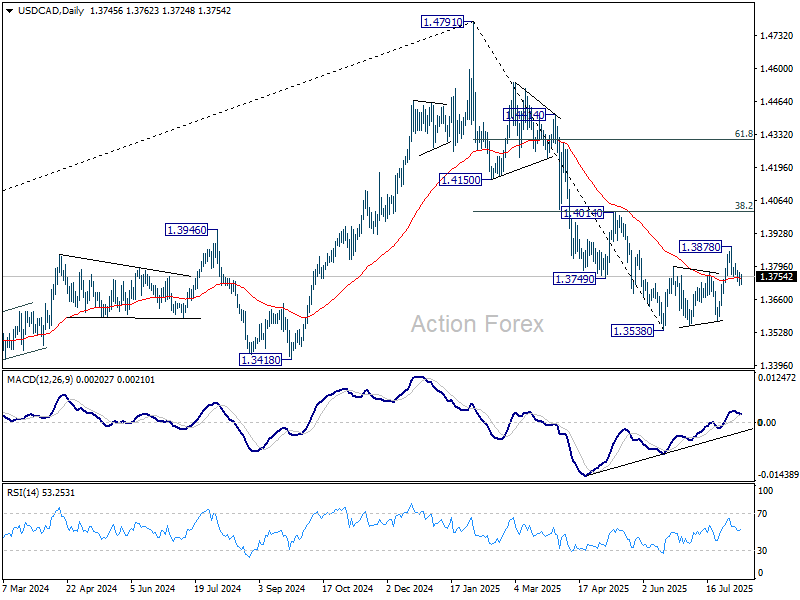
In the bigger picture, price actions from 1.4791 medium term top could either be a correction to rise from 1.2005 (2021 low), or trend reversal. In either case, further decline is expected as long as 1.4014 resistance holds. Next target is 61.8% retracement of 1.2005 (2021 low) to 1.4791 at 1.3069.
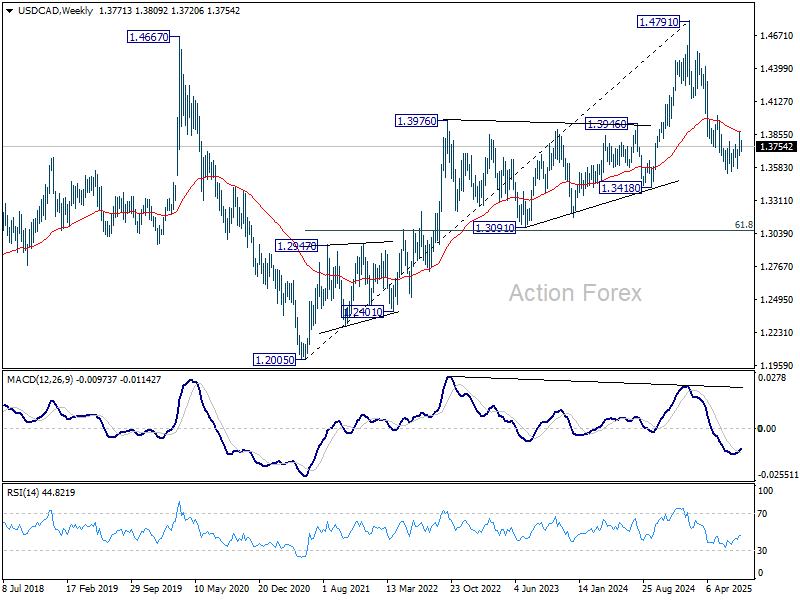
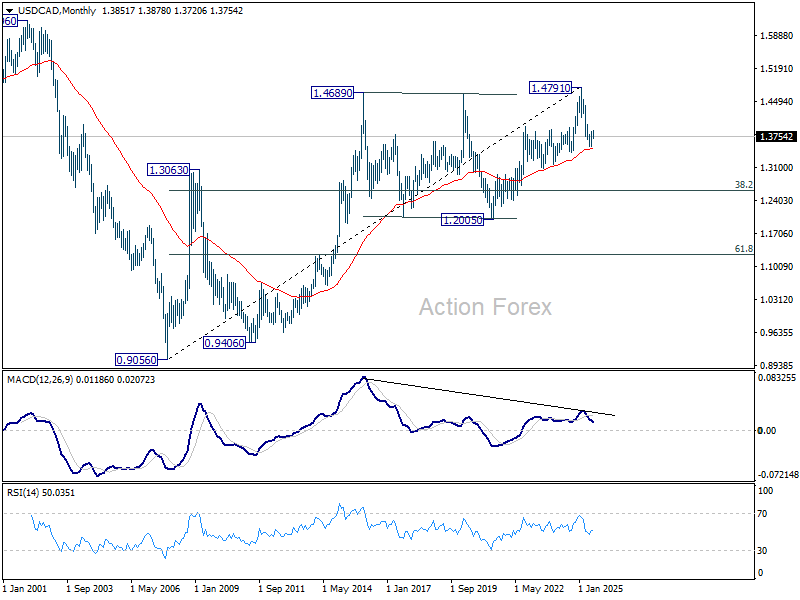
In the long term picture, as long as 55 M EMA (now at 1.3511) holds, up trend from 0.9056 (2007 low) should still resume through 1.4791 at a later stage. However, sustained trading below 55 M EMA will argue that the up trend has already completed, with rise from 1.2005 to 1.4791 as the fifth wave. 1.4791 would then be seen as a long term top and deeper medium term down trend should then follow.
GBP/JPY Weekly Outlook
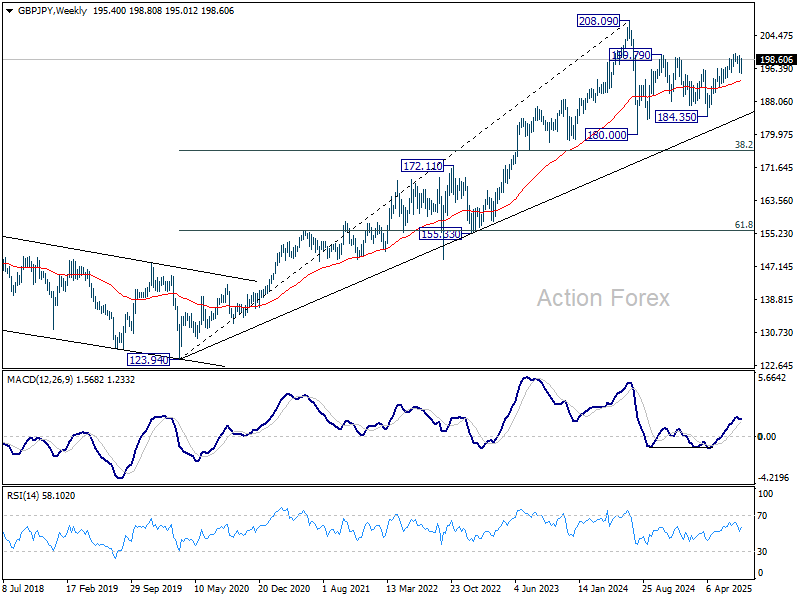
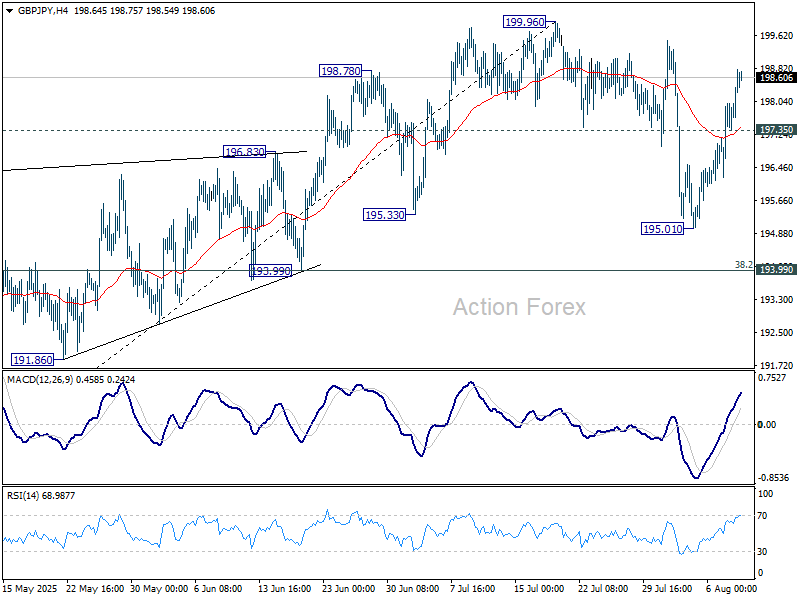
The strong rebound in GBP/JPY last week suggests that correction from 199.96 has completed at 195.01 already. Initial bias stays on the upside for retesting 199.96 first. Firm break there will resume whole rise from 184.35. Next target is 100% projection of 180.00 to 199.79 from 184.35 at 204.14. On the downside, below 197.35 minor support will delay the bullish case and turn intraday bias neutral again.
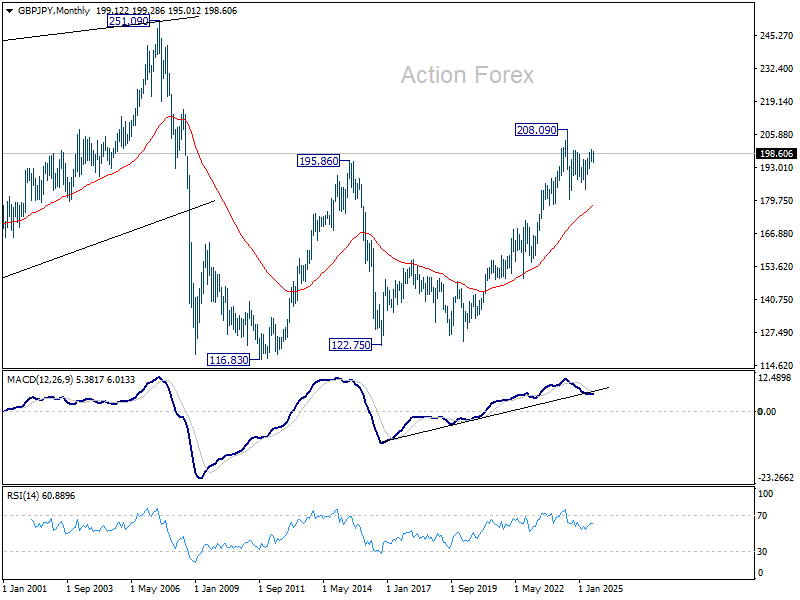
In the bigger picture, price actions from 208.09 (2024 high) are seen as a correction to rally from 123.94 (2020 low). The pattern might still extend with another falling leg. But in that case, strong support should be seen from 38.2% retracement of 123.94 to 208.09 at 175.94 to contain downside. Meanwhile, decisive break of 208.09 will confirm long term up trend resumption.
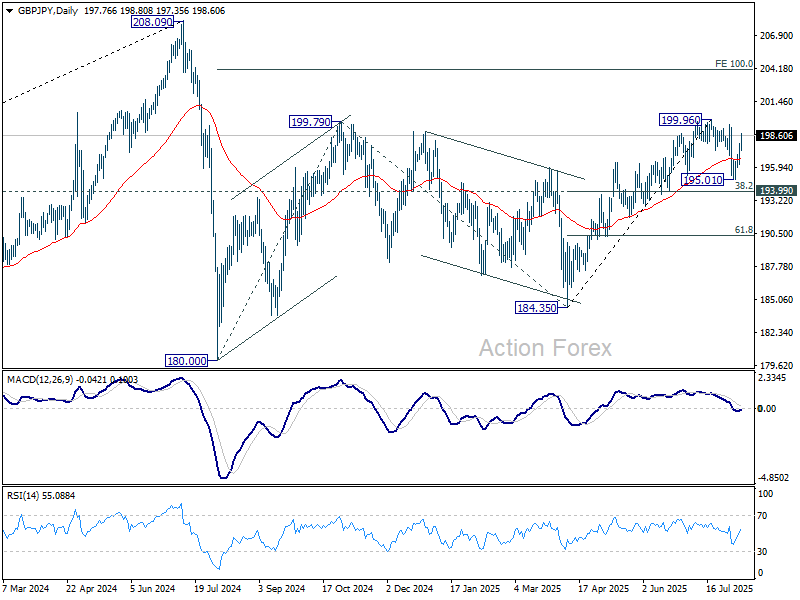
In the long term picture, there is no sign that the long term up trend from 122.75 (2016 low) has concluded. But firm break of 208.09 is needed to confirm resumption. Otherwise, more medium term range trading could still be seen.