Sample Category Title
WTI Crude Forecast: Risk Premium Fades, Supply Pressures Mount, Bearish Trend Ahead
The geopolitical risk premium in the oil market has faded, taking a back seat after a four-week, 30% parabolic rally in West Texas Oil CFD (a proxy for WTI crude futures) during the initial phase of the Israel-Iran conflict.
Key takeaways
- Oil’s geopolitical risk premium has subsided after a 30% rally during the Israel-Iran conflict, with West Texas Oil CFD plunging 18% from its 23 June 2025 high.
- US crude oil inventory drawdowns have slowed, signalling potential stock build-ups that could further weigh on WTI prices.
- Possible easing of US sanctions on Russian oil, combined with OPEC+’s planned output hike, may add downward pressure on crude prices.
- West Texas Oil CFD has broken below key moving averages and trend supports, signalling the end of its three-month rebound and pointing to a medium-term bearish phase unless it breaks above US$68.80.
US crude oil inventories are building up again
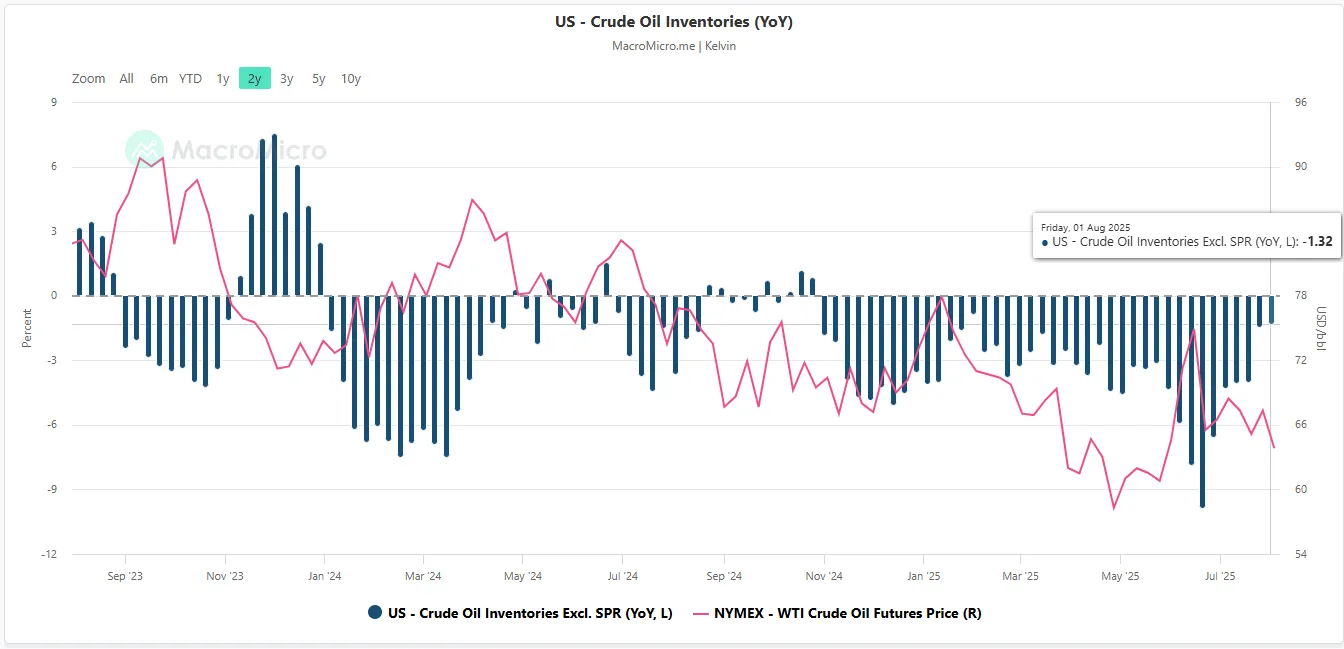
Fig. 1: EIA US crude oil inventories excluding SPR (y/y change) with WTI crude oil futures as of 1 Aug 2025 (Source: MacroMicro)
The growth of US crude oil inventories excluding the Strategic Petroleum Reserve (SPR) on a year-on-year basis has an indirect correlation with the movement of WTI crude oil, as a build-up in oil inventories puts downside pressure on oil prices.
Since 20 June 2025, the drawn down of US crude oil inventories (excluding SPR) has slowed down from -9.9% y/y to -1.3% y/y as of 1 August 2025 based on data from the US Energy Information Administration (EIA) which suggests a potential build-up in oil inventories which is likely to put further downside pressure on the prices of WTI crude oil (see Fig. 1).
A possible reduction of US sanctions on Russian oil
Recent media reports have highlighted that the Russian government confirmed that Presidents Putin and Trump will meet for summit talks on ending the war in Ukraine in the next few days.
Hence, a ceasefire deal between Russia and Ukraine is likely to allow the removal or reduction of sanctions on Russia’s oil exports, in turn, increasing oil supply on top of ongoing OPEC+ production hikes where the cartel has agreed to pump an extra 2.5 million barrels of oil per day starting in September.
The net effect is a more dampening effect on the prices of WTI crude oil.
The three-month corrective rebound in WTI crude oil may have ended
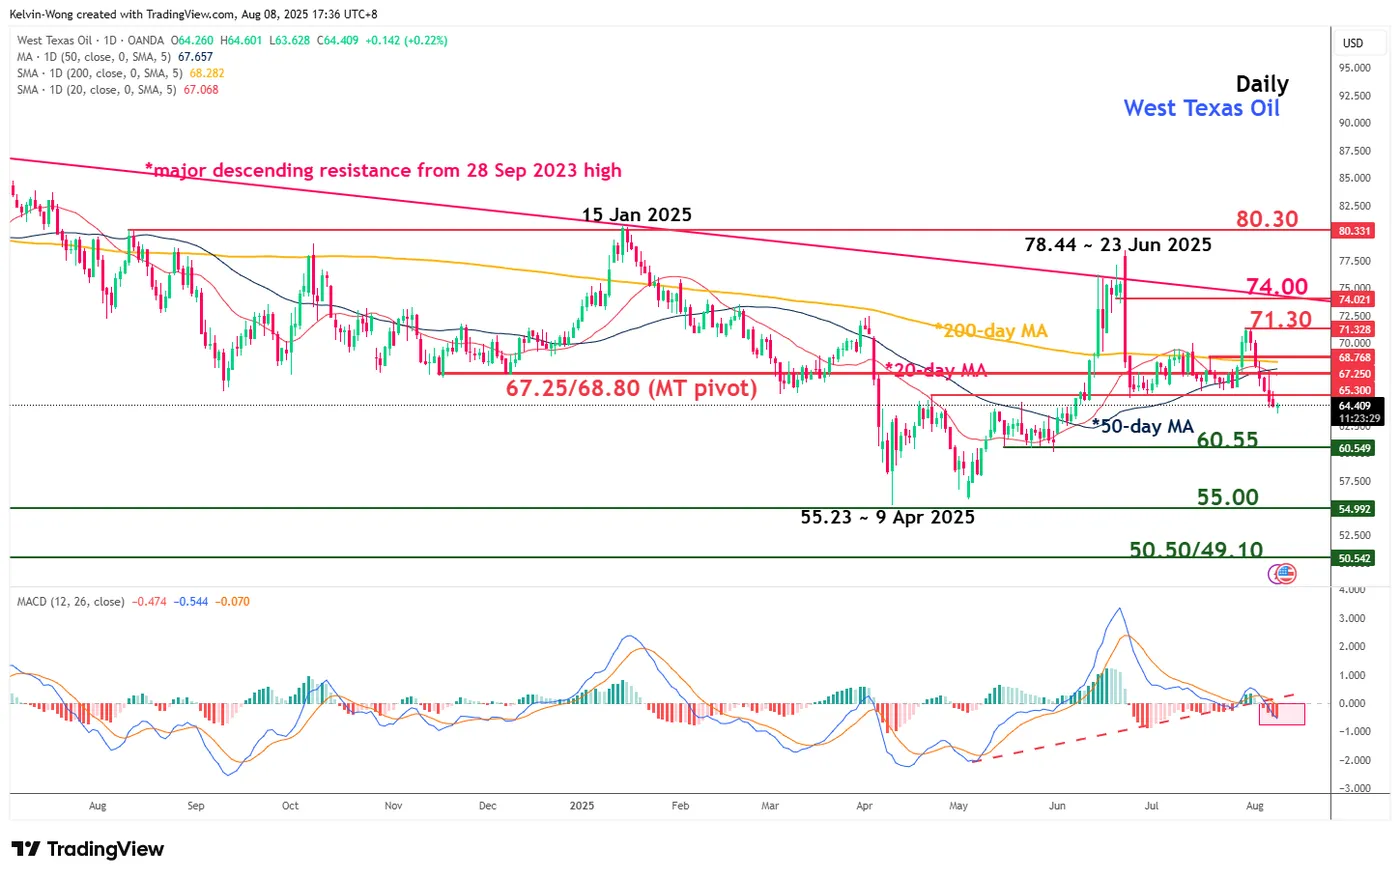
Fig. 2: West Texas Oil CFD medium-term trend as of 8 Aug 2025 (Source: TradingView, click to enlarge chart)
The West Texas Oil CFD has broken below its 20-day, 50-day, and 200-day moving averages. In addition, its daily MACD trend indicator has broken below a former parallel ascending support from 6 May 2025 and continued to trend downwards below its centreline.
These observations suggest that a three-month corrective rebound from the 9 April 2025 low to the 23 June 2025 high is likely to have ended. The next possible movement of the West Texas Oil CFD is likely a medium-term (multi-week) impulsive bearish down move within a major downtrend phase in place since the 28 September 2023 high (see Fig. 2).
Bearish bias below US$67.25/68.80 key medium-term pivotal resistance for the next supports to come in at US$60.55, US$55.00, and US$50.50/49.10 (congestion area of 5 June/7 Aug 2017 & Fibonacci extension).
However, a clearance above US$68.80 invalidates the bearish scenario for a squeeze up to retest the next medium-term resistances at US$71.30 and US$74.00.
Gold Attempts to Reach New Highs, Bouncing Off the Lower Boundary
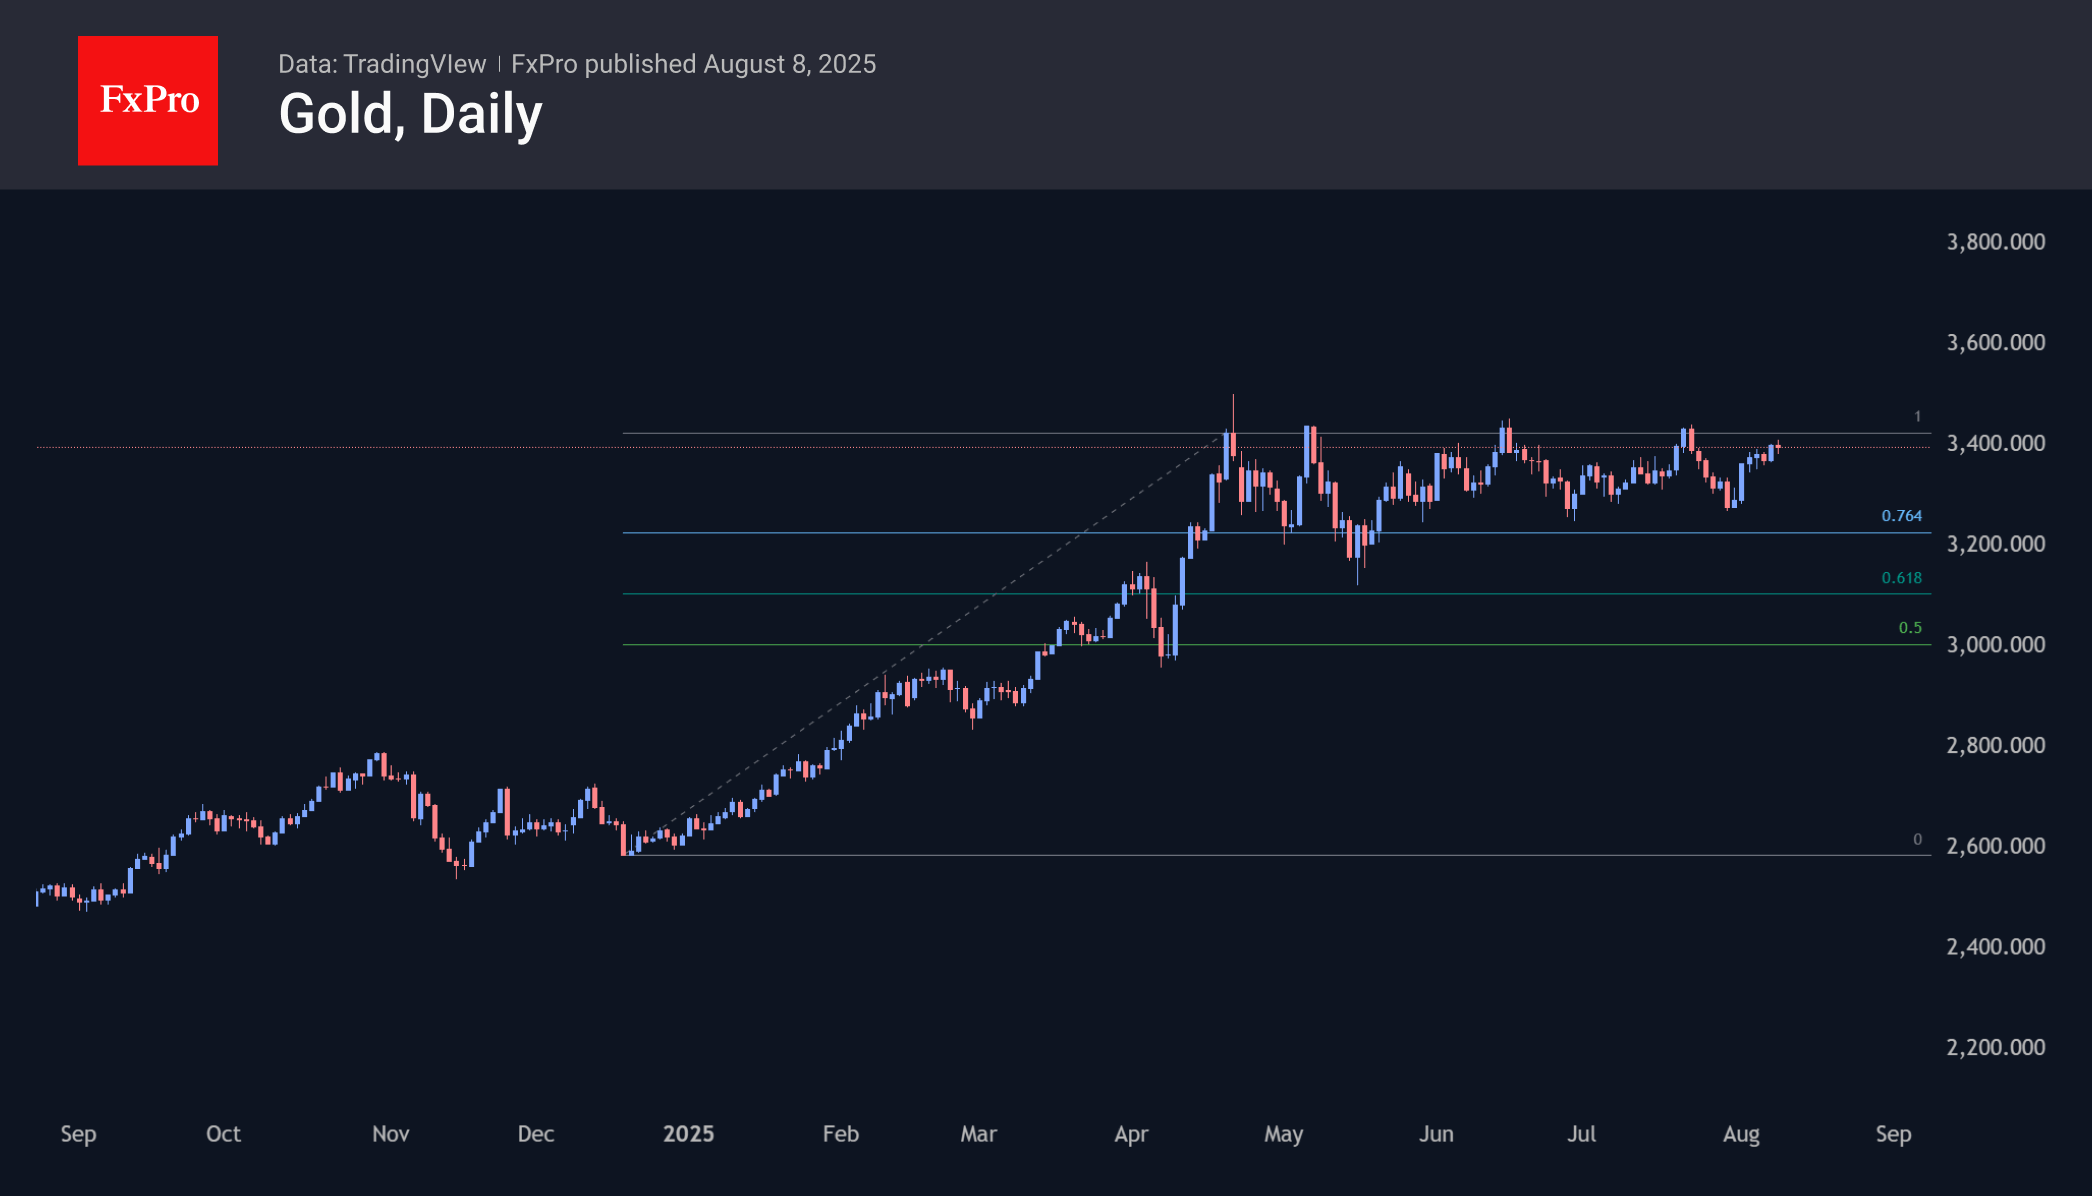
Gold quickly recovered and approached the upper limit of the medium-term consolidation range of $3,250-3,400 per ounce, thanks to the return of fears of stagflation in the US, the growing likelihood of a Fed rate cut in September, and frenzied demand in China. The employment sub-index in surveys of purchasing managers in the services sector has fallen for the fifth time in the last six months, while prices are rising rapidly.
Stagflation is good for gold, as low growth prevents the Fed from tightening while inflation is eroding the value of dollar assets. Precious metals are used as a hedge against inflationary risks.
After a long period, the outlook for gold has been looking more bullish. The dramatic reversal in expectations regarding the Fed’s interest rate cuts and accelerating inflation creates the ideal background for gold. The decline in demand from central banks and the jewellery industry is offset by a decrease in above-ground stocks outside exchanges due to arbitrage operations.
If the upper boundary is broken and a bullish rally begins in gold, there is potential for a slide down to $3950-4000, where the 161.8% extension levels from the rise from the lows at the end of last year to the resistance area from the end of April near $3420 are concentrated.
EUR/USD Rises as the Dollar Struggles Under Tariff Pressures and Fed Uncertainty
The EUR/USD pair edged higher on Friday, climbing to 1.1657, buoyed by expectations of a more dovish stance from the Federal Reserve and growing concerns over the economic impact of new US tariffs.
Recent data revealed that jobless claims exceeded forecasts this week, further signalling a softening labour market following last week’s lacklustre employment report.
On the political front, attention remains fixed on potential shifts within the Fed. US President Donald Trump has nominated Stephen Miran, head of the Council of Economic Advisers, to replace Adriana Kugler on the Fed’s Board of Governors. Meanwhile, reports suggest Christopher Waller is emerging as a leading candidate for Fed Chair. These developments have reinforced market expectations of an imminent rate cut as early as September.
Adding to the dollar’s woes, new US retaliatory tariffs, ranging from 10% to 41%, came into effect at midnight on Thursday. This has stoked fears of economic headwinds, further dampening sentiment towards the greenback.
Technical Analysis: EUR/USD
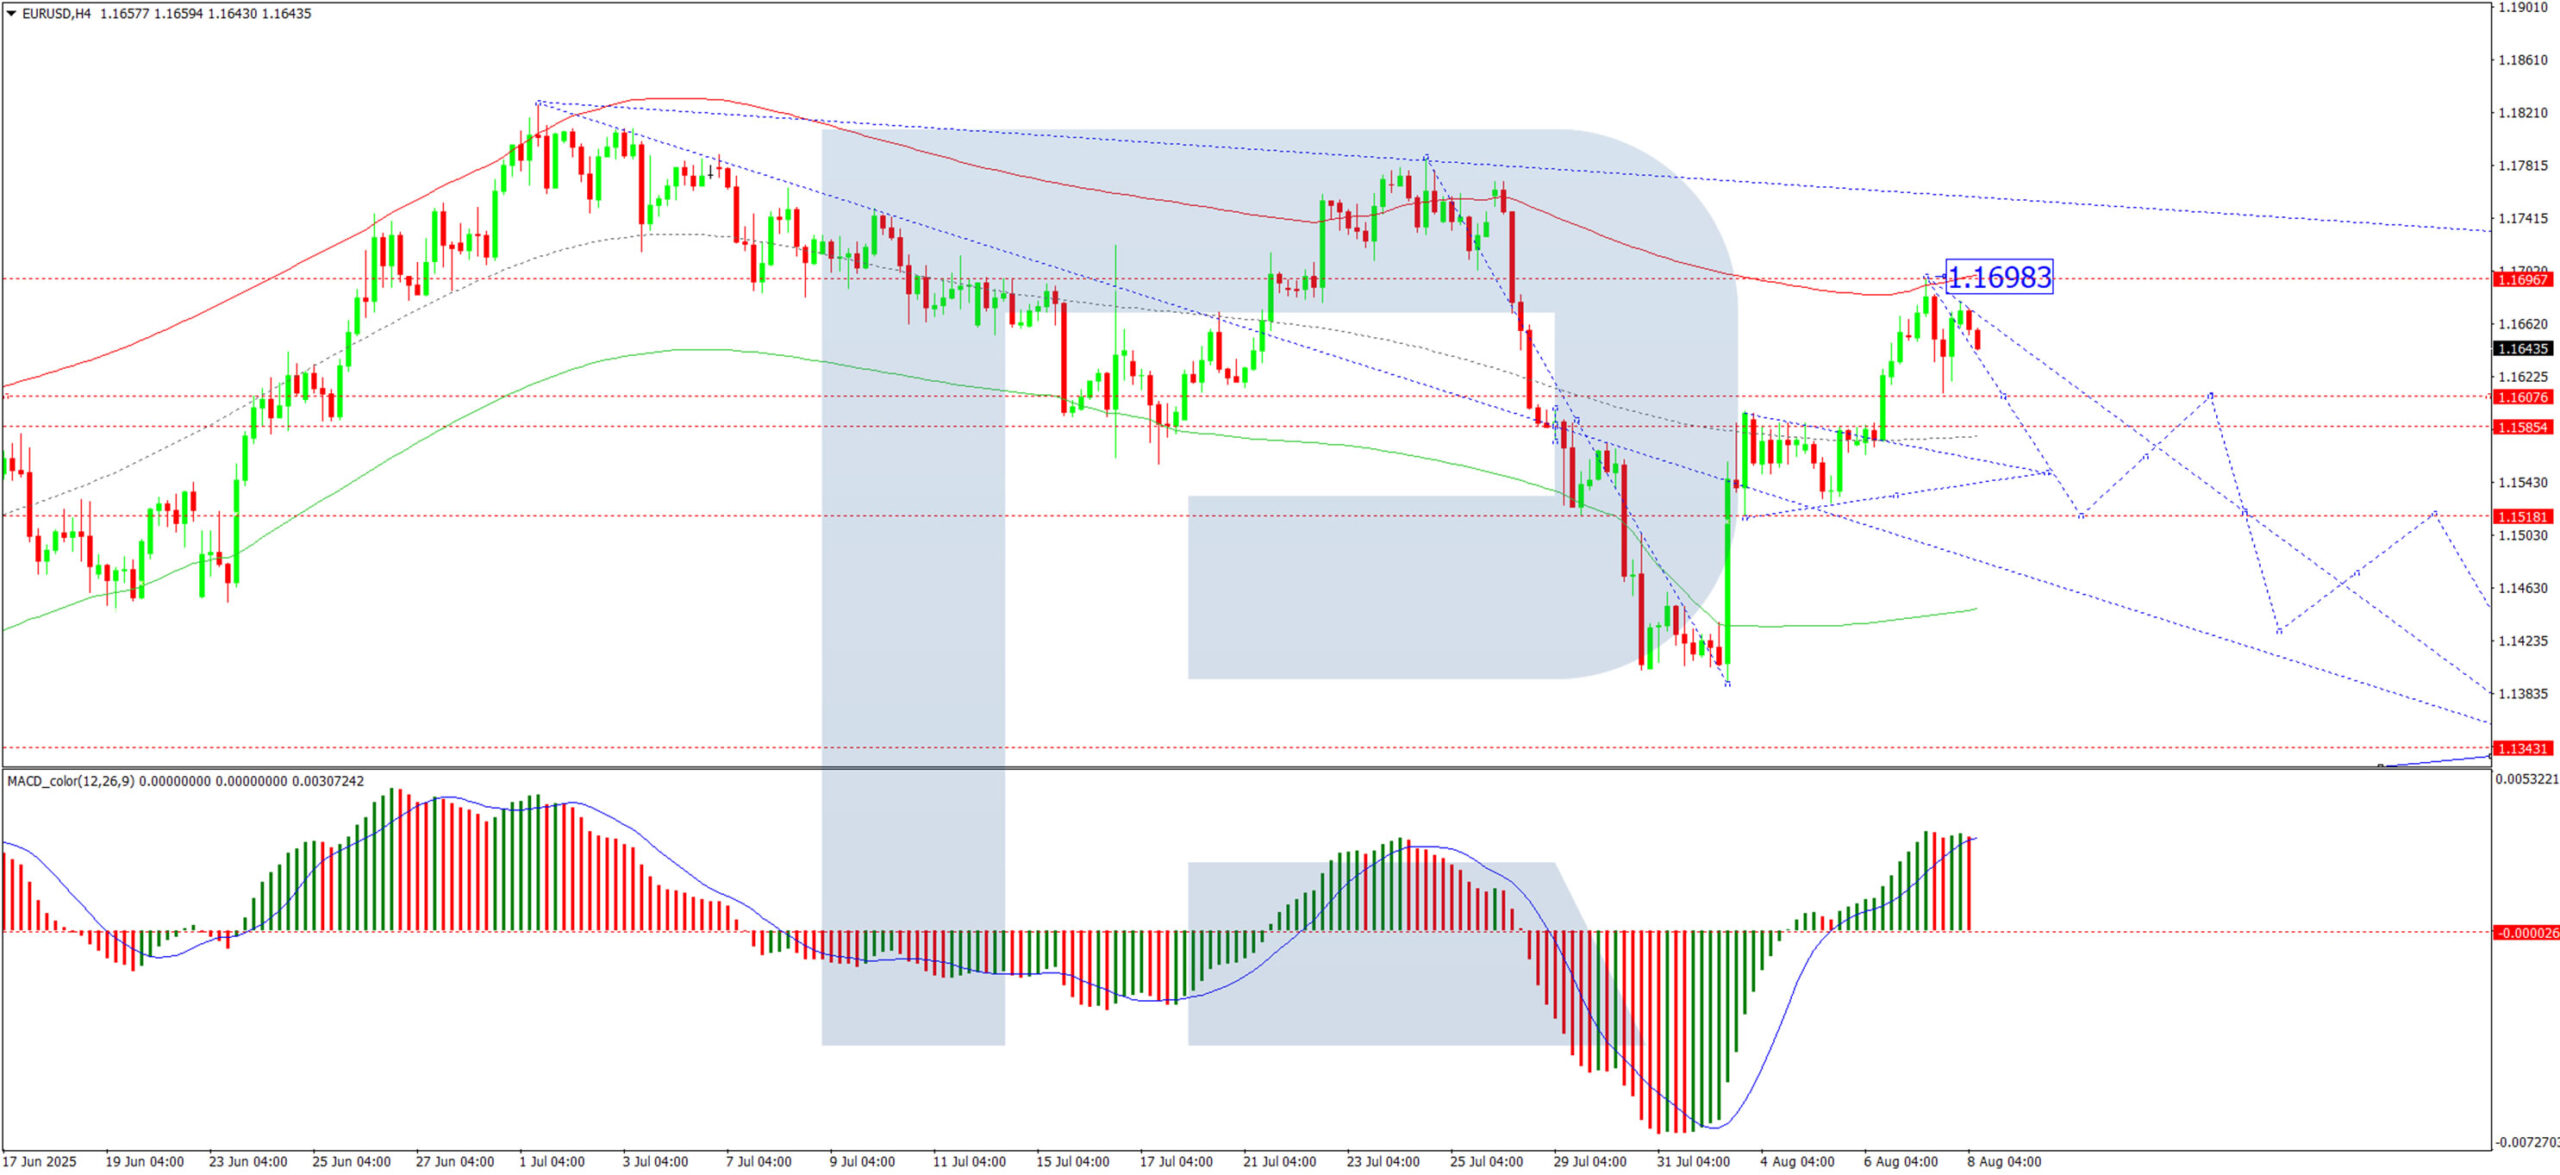
H4 Chart:
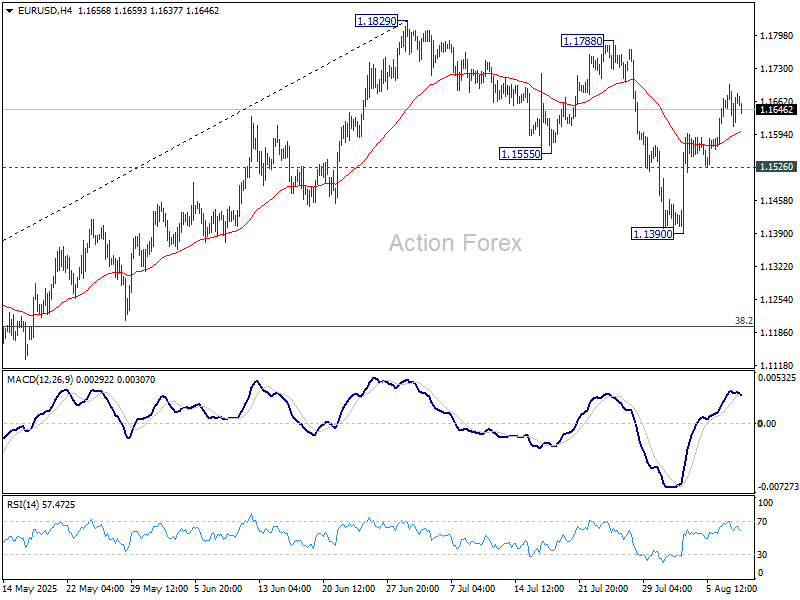
The EUR/USD saw a corrective move to 1.1698, followed by consolidation near the top of this correction. A break below 1.1611 could trigger a downward wave towards 1.1520, with potential for further declines to 1.1343. The MACD indicator supports this bearish scenario: its signal line remains above zero but has exited the histogram zone, suggesting a pullback towards lower levels.
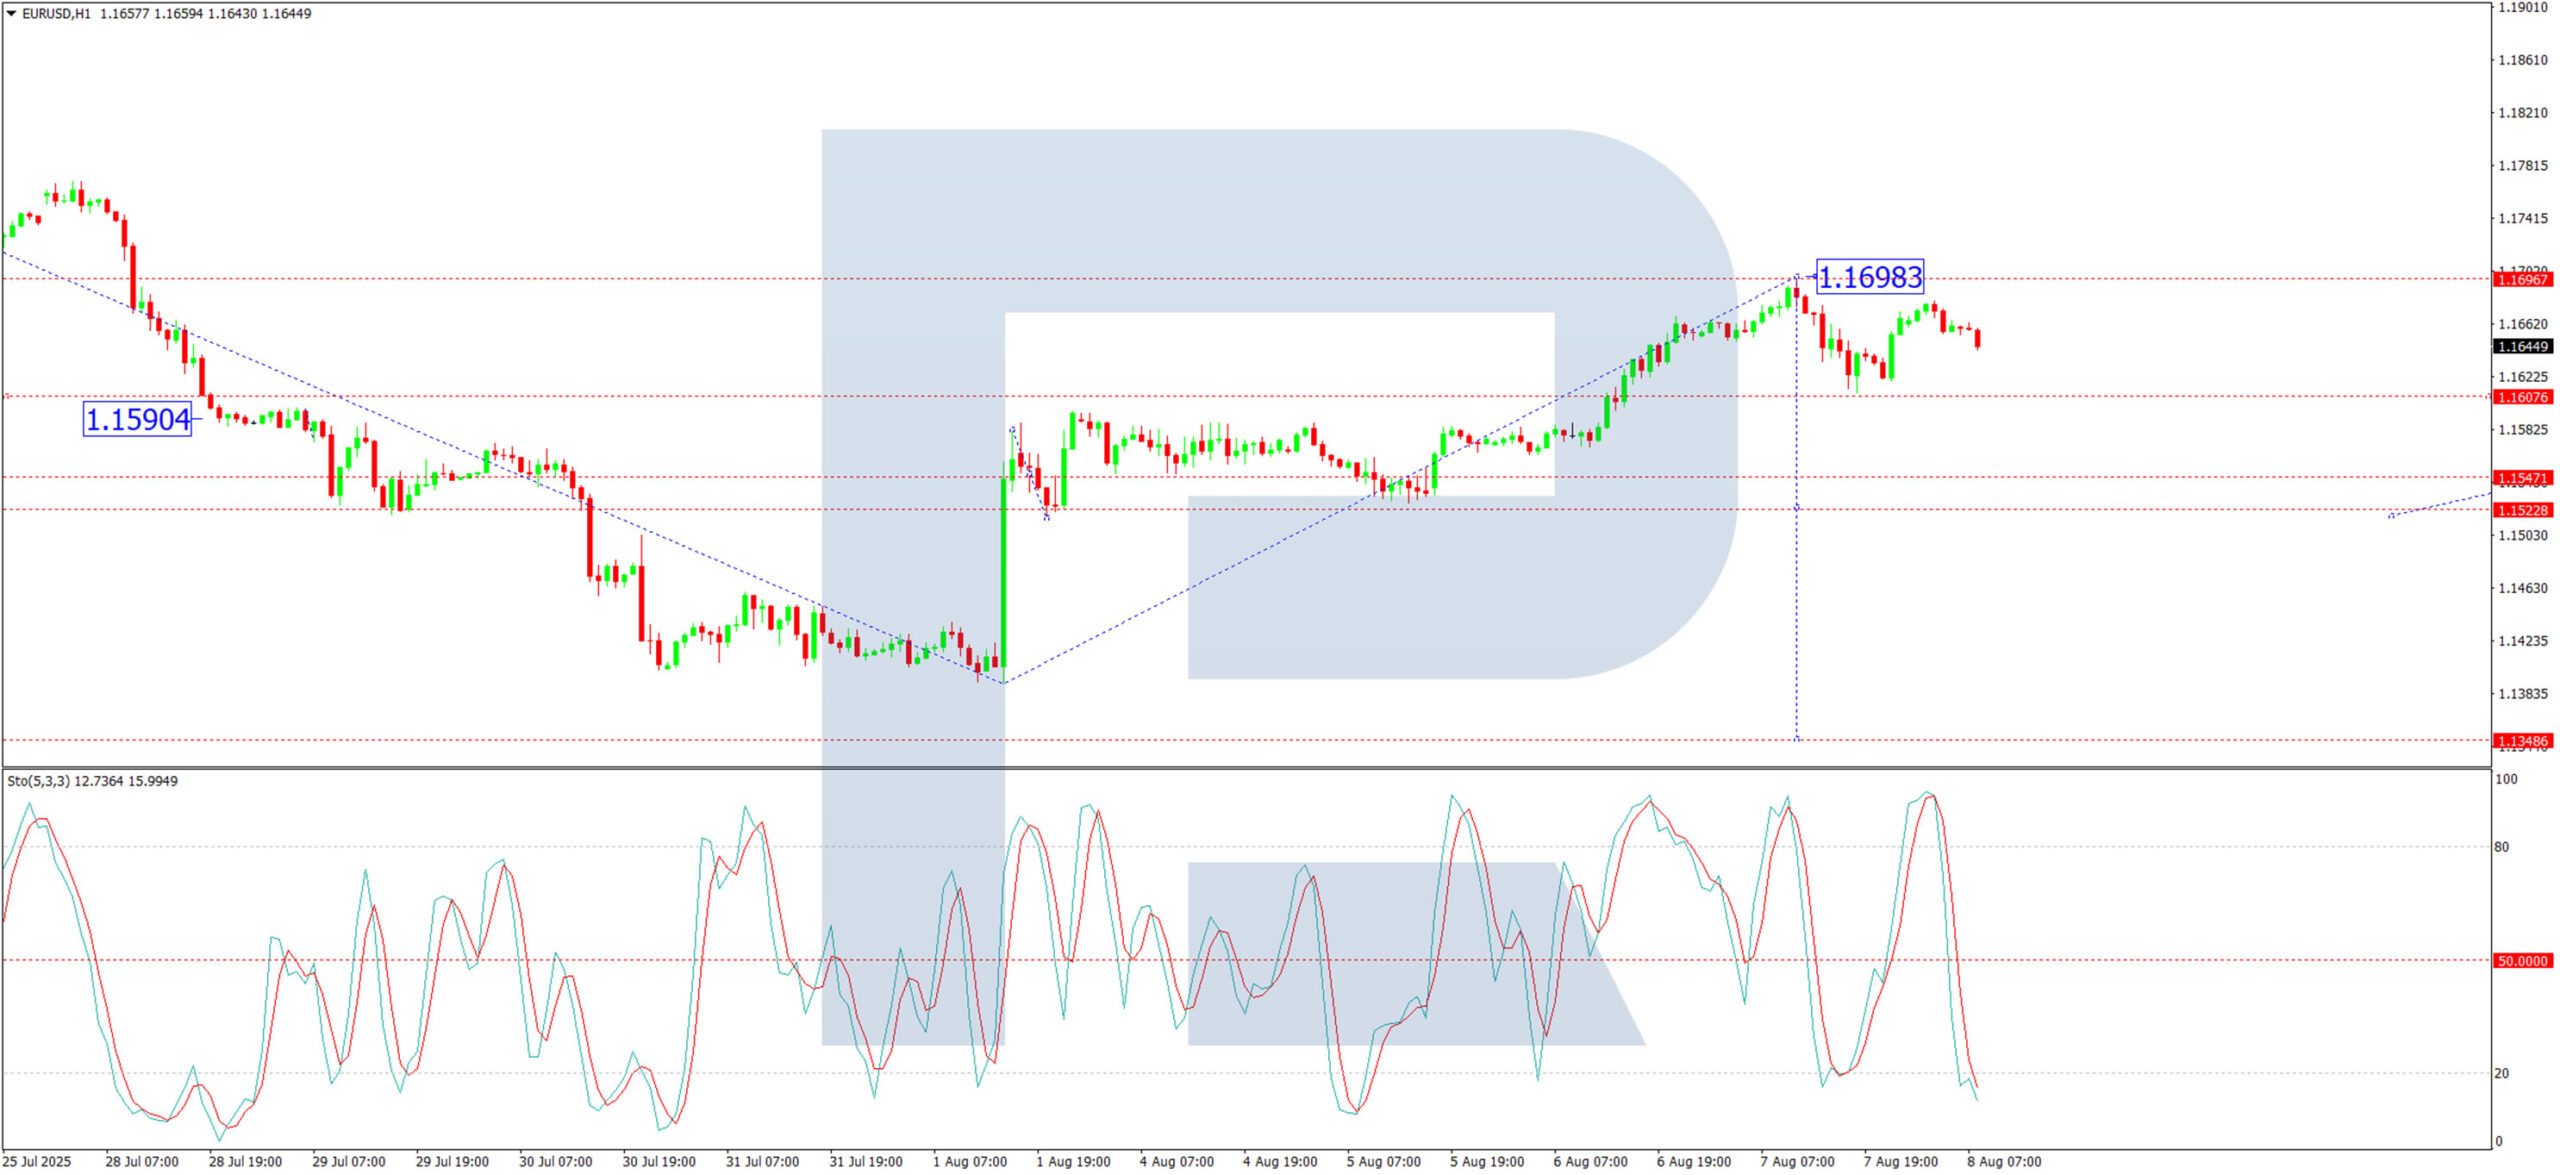
H1 Chart:
The pair formed a downward impulse to 1.1611, followed by a rebound to 1.1679. The current consolidation phase appears set for a downward breakout, potentially initiating a fifth wave of decline towards 1.1520. A brief retest of 1.1611 (from below) may follow before another drop to 1.1444, with an eventual target of 1.1343. The Stochastic oscillator corroborates this view, with its signal line below 50 and trending sharply downward towards 20.
Conclusion
The EUR/USD remains under upward pressure amid speculation about the Fed and concerns over tariffs, but technical indicators suggest a near-term bearish correction is likely.
USD/JPY Technical: Potential Impending Minor Bullish Breakout for Japanese Yen
Earlier last week, the USD/JPY surged to a four-month high of 150.92 on 1 August, but its prior accumulated gains of the previous four sessions were all wiped out and formed a weekly bearish “Shooting Star” at the close of last Friday, 1 August US session.
These observations suggest a potential bullish breakout on the USD/JPY above the key 200-day moving average and the upper boundary of its medium-term ascending range configuration in place from the 22 April 2025 low as it reintegrated back below the 149.50 level.
Since the start of this week, 4 August, through today’s Asian session on 8 August, the Japanese yen has lagged behind other major currencies against the greenback. While the US Dollar Index has fallen 0.5%, the USD/JPY has posted a smaller decline of just 0.2%.
Let’s dissect the latest technical developments in the USD/JPY and construct a possible short-term trading set-up from a technical analysis perspective.
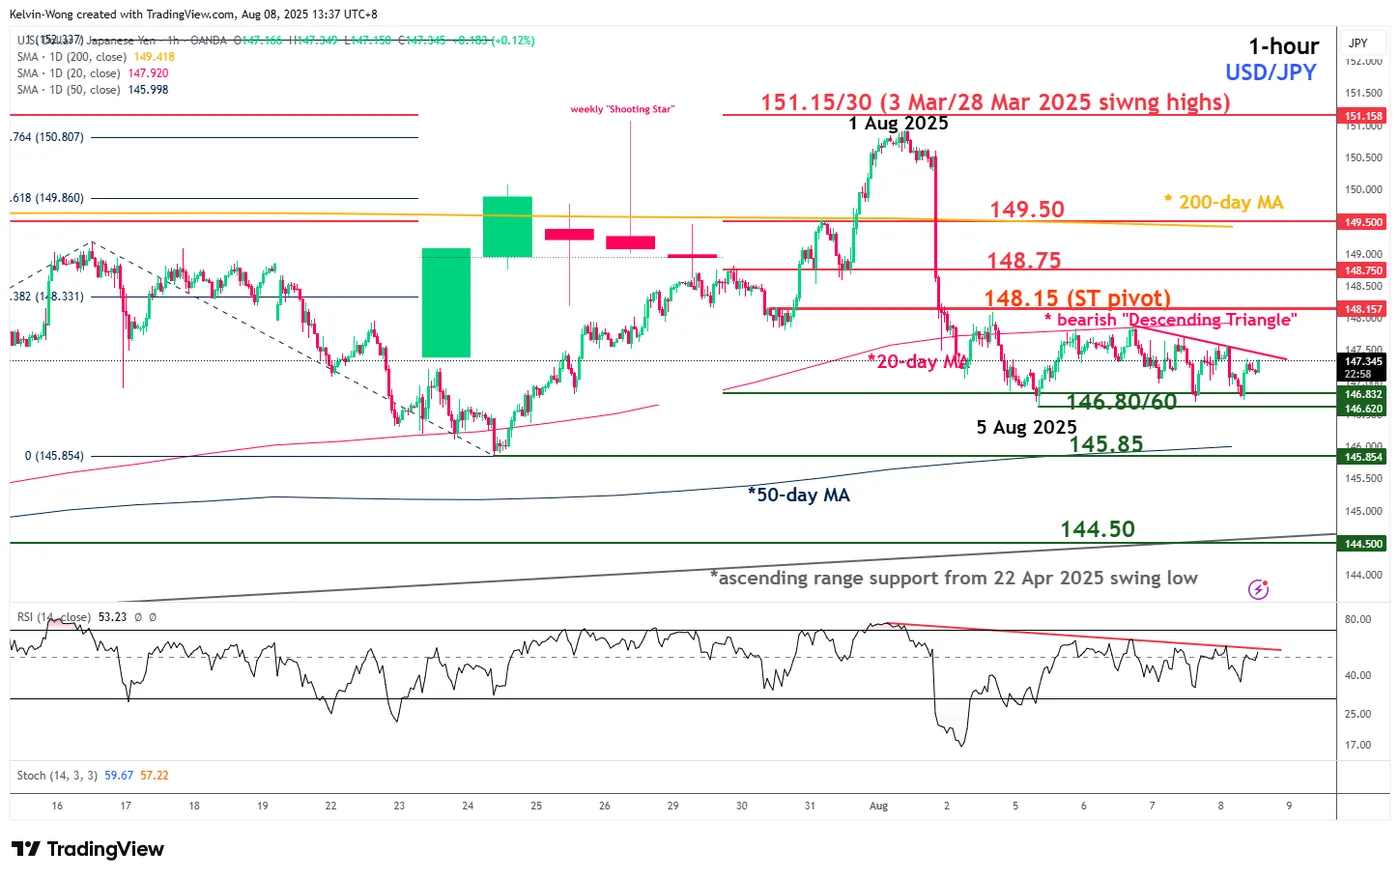
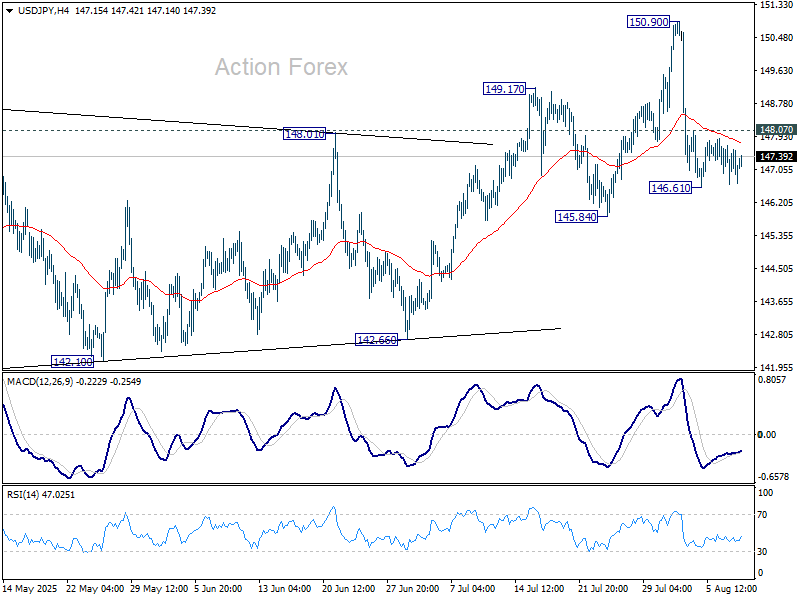
Fig. 1: USD/JPY minor trend as of 8 Aug 2025 (Source: TradingView)
Preferred trend bias (1-3 days)
A potential minor bearish breakdown looms on the USD/JPY within a medium-term ascending range configuration in place since the 22 April 2025 swing low of 139.89.
Bearish bias below 148.15 short-term pivotal resistance, and a break below 146.60 may expose the next supports at 145.85 (50-day moving average) in the first step before the medium-term support at 144.50 (lower boundary of the ascending range configuration from 22 April 2025 low).
Key elements
- From Friday, 1 August, to Tuesday, 5 August, USD/JPY experienced a 430-pip decline (high to low), with price action remaining below its 20-day moving average.
- The USD/JPY has formed a minor “Descending Triangle” bearish range continuation configuration with its downside trigger level at 146.60 below the 20-day moving average.
- The hourly RSI momentum indicator has been capped by a parallel descending resistance at the 56 level, which suggests the lack of upside momentum in USD/JPY.
Alternative trend bias (1 to 3 days)
A clearance above 148.15 invalidates the bearish scenario and sees a squeeze up towards the upper limit of the medium-term ascending range for the next intermediate resistances to come in at 148.75 and 149.50 (also the key 200-day moving average).
Nikkei 225 Index Rises Towards the 42,000 Level
As the chart indicates, the Nikkei 225 stock index (Japan 225 on FXOpen) has today risen to the 42,000 mark, which is just below its all-time high.
Among the bullish drivers:
→ Corporate news. Strong quarterly results were reported by Sony Group and SoftBank.
→ Trade agreement developments. Positive news flow surrounds a potential tariff agreement between the United States and Japan, which could be finalised in the near term. According to Reuters, the Japanese government stated on Thursday that the US has pledged to adjust overlapping tariffs on Japanese goods to avoid double taxation.
Technical Analysis of the Nikkei 225 Chart
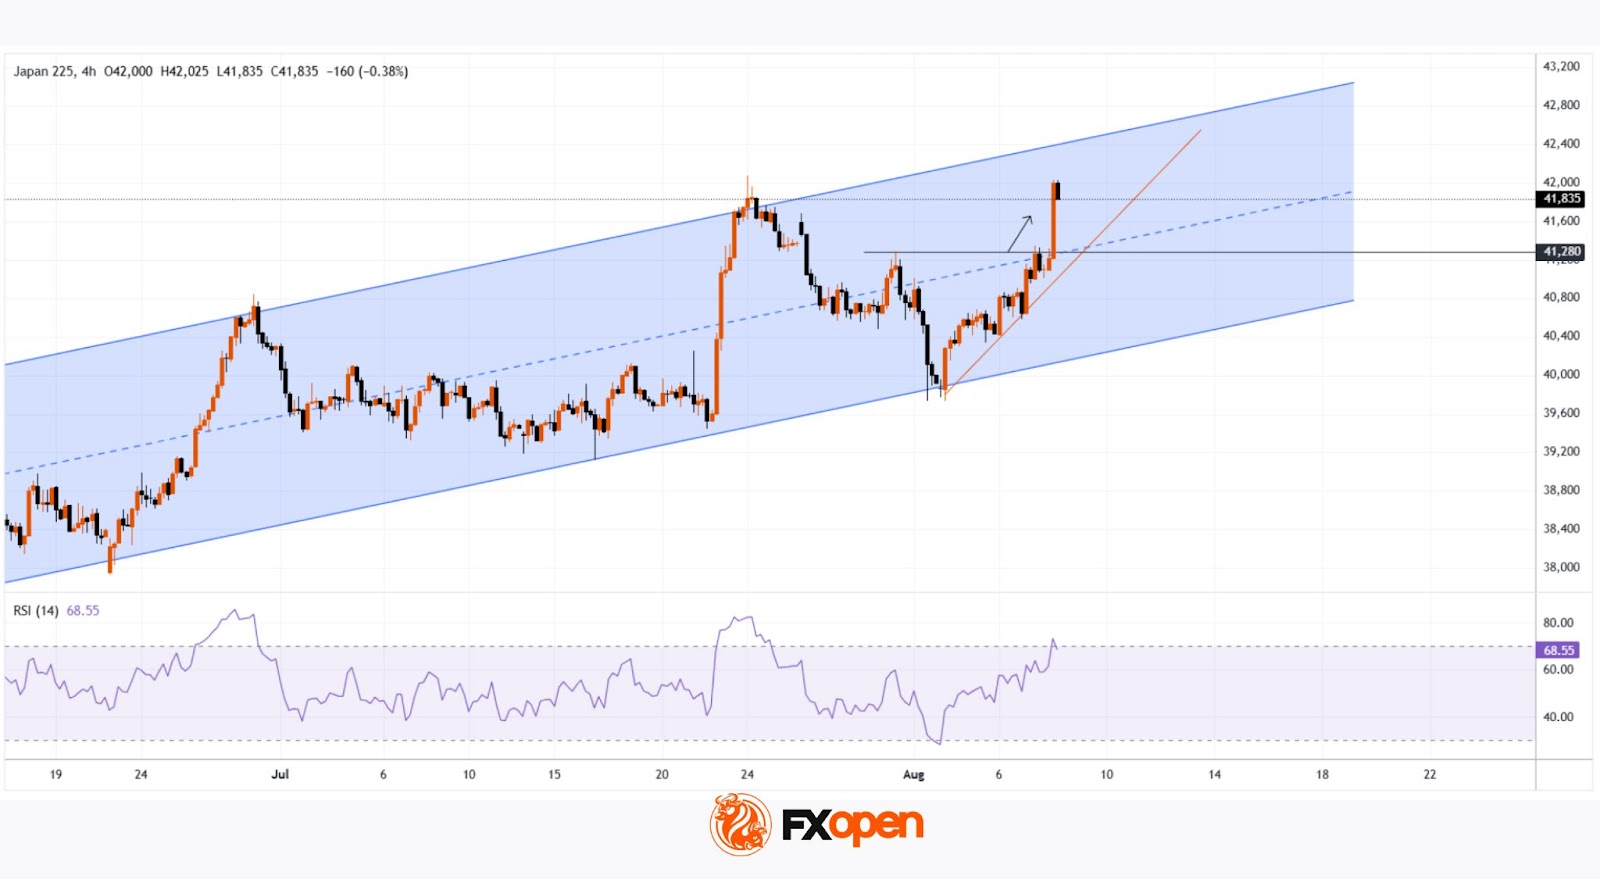
Previously, we highlighted the ascending channel that has shaped price action throughout 2025. This pattern remains valid, with the price now entering the upper half of the channel. The channel’s median line might act as a support level going forward.
The recent price behaviour attracts attention: a long bullish candle has formed on the chart – immediately following a breakout above the 41,280 resistance level (as indicated by the arrow). This signals a clear imbalance in favour of buyers.
From a bearish perspective:
→ The psychological resistance at 42,000 may hold – in late July, the price failed to stay above this level.
→ The RSI indicator has entered overbought territory.
→ Failure by the bulls to sustain a break above 42,000 could validate a potential Double Top bearish pattern.
From a bullish perspective:
→ The price might advance towards the upper boundary of the ascending channel.
→ The bullish candle displays characteristics of an FVG (Fair Value Gap) bullish pattern, which might serve as a future support level.
→ Further support could be provided by the orange trendline, as well as the former resistance at 41,280.
A bullish breakout attempt above 42,000 cannot be ruled out. However, will market optimism persist if the price approaches the upper limit of the channel?
Trade global index CFDs with zero commission and tight spreads. Open your FXOpen account now or learn more about trading index CFDs with FXOpen.
This article represents the opinion of the Companies operating under the FXOpen brand only. It is not to be construed as an offer, solicitation, or recommendation with respect to products and services provided by the Companies operating under the FXOpen brand, nor is it to be considered financial advice.
Oil Slides, Tech Comforts
European equity markets gained recently on hopes that Donald Trump might broker a meeting between Vladimir Putin and Volodymyr Zelensky. However, Putin has not yet agreed to dialogue with Kyiv. Regardless, US crude is below a key support level (and falling) this morning on rising hope of progress – a move that could rapidly reverse as Russia looks much less enthusiastic to end the Ukrainian war then Trump is.
Meanwhile, defense stocks came under pressure yesterday after disappointing earnings from Germany’s Rheinmetall—one of the most popular European defense plays this year amid the US’s scaled-back security involvement in Europe and NATO’s pledges to ramp up military spending. A delay in budget approvals by Germany’s new government, along with timing around the NATO summit, reportedly postponed some orders to the second half. But investors weren’t receptive to excuses. Rheinmetall shares fell 8%, slipping to their 100-day moving average. Elsewhere in the sector, Q2 results were mixed: Leonardo raised its forecast, BAE Systems upgraded its sales and EBIT guidance, while Dassault Aviation missed expectations. Overall, the outlook for European defense remains positive—but valuations may have run ahead of fundamentals.
Despite that, the Stoxx 600 closed above its 50-DMA, and even the Swiss SMI rebounded—this, despite Switzerland leaving Washington without a better deal than the current 39% tariffs on its US-bound exports. Gains in European indices remain fragile, however, as these tariffs could weigh on underlying economies. My guess is that central banks will be forced to step in with further support.
The 39% tariffs have increased speculation that the Swiss National Bank (SNB) might resort to negative rates in the second half. Meanwhile, expectations for the European Central Bank (ECB) remain mixed. The ECB will likely hold rates steady at the next meeting but may signal one or two more cuts by year-end depending on data. While inflation in the eurozone remains contained—helped in part by a stronger euro—there’s growing divergence among member states, which could complicate decision-making. Still, I believe the bias will remain dovish enough to avoid further pressure on already strained economies.
Across the Atlantic, the mood was more downbeat. Energy stocks dragged markets lower as oil prices fell—US crude broke below $65/barrel, returning to a medium-term bearish consolidation zone.
Economic data didn’t help: Initial jobless claims rose to their highest level since November 2021, and a New York Fed survey showed rising inflation expectations, largely attributed to the new tariffs. That combination—rising inflation and slowing growth—fits the classic definition of stagflation, which would typically call for central bank caution. But theory doesn’t seem to apply when Trump is rewriting the rulebook.
US futures are trading higher this morning on news that Stephen Miran will replace outgoing Federal reserve (Fed) Governor Adriana Kugler, and that Christopher Waller is being considered as the next Fed Chair. Both men are viewed as dovish, which aligns with Trump’s rate-cut ambitions. However, the US 2-year yield has barely reacted—reminding us (again) that rate cuts don’t always lower borrowing costs if they aren’t seen as credible or justified. Remember last September, when the Fed unexpectedly slashed rates by 50bps? The 2-year yield jumped nearly 30bps over the following two months. For now, markets still expect the next cut to come in September, keeping the S&P 500 near record highs despite trade uncertainty and policy inconsistency.
Several analysts are warning of a potential 10–15% correction, as August, September, and October are seasonally weaker months. Still, most view any dip as a buying opportunity. And when everyone’s waiting to buy the dip, markets often don’t dip much at all—soft selloffs aren’t enough to trigger broad deleveraging. In short: the positive momentum continues, and AI remains a key driver.
In Japan, the Nikkei is up 1.7% this morning, while the tech-heavy Topix surged to a fresh all-time high. SoftBank shares hit a record after the company returned to profitability last quarter. Sony also approached record highs after raising its full-year profit forecast despite tariffs. Toyota, however, fell sharply after reporting a 37% drop in profit due to US tariffs.
All in all, tech continues to be a virtual comfort zone. Valuations are rich, but AI-driven demand remains strong, corporate spending is resilient, and some firms—like Meta—are successfully converting investment into revenue.
In US chip stocks, Trump’s 100% tariffs paradoxically lifted sentiment. The market expects chipmakers that manufacture domestically to benefit from protectionist measures. Nvidia flirted with record highs, while AMD shrugged off its post-earnings dip.
On the FX front, the US dollar remains under pressure from trade volatility, weak Treasury auctions, and dovish Fed expectations, though we’re seeing a modest rebound in Asian trading. The EURUSD is consolidating after a 2% rally since the start of August. Meanwhile, sterling extended gains against both the euro and the dollar after the Bank of England delivered a ‘hawkish rate cut. Four MPC members voted to keep rates unchanged, and with UK inflation expected to hit 4% in the coming months, prospects for a November rate cut have been mostly priced out.
We’ve come full circle: rising inflation is again translating into currency strength, reversing the early-2025 dynamic where dovish central banks were seen as pro-growth. That shift is particularly relevant for the euro, which had previously rallied on hopes the ECB would support growth.
Trump Strengthens Influence Wth Fed Nominee
In focus today
For Sweden, we note the production and consumption data for June, where the figures are expected to show improvement. According to the preliminary GDP estimate for the second quarter, activity picked up in June, which today's figures should confirm. However, this does not change the outlook of weaker indicators heading into the autumn and is rather a correction following the weak figures in May.
Otherwise, the week wraps up with a quiet day for data releases.
Economic and market news
What happened overnight
In the US, Trump has nominated Stephen Miran for a temporary position on the Federal Reserve Board to serve until 31 January 2026, filling the remaining term of a recently vacated seat. Miran has expressed scepticism about the Fed's independence and has argued for stronger presidential control over Fed Board. Known as a dove and a proponent of a weaker USD, his nomination led to a slight decline in the USD, as markets anticipate his potential alignment with Trump's push for looser monetary policy.
What happened yesterday
The Bank of England cut the Bank Rate by 25bp to 4.00% as widely expected. The vote split delivered a hawkish surprise, with five members supporting a cut and four voting for an unchanged decision. Additionally, the statement adopted a hawkish tone, noting that the monetary policy stance has become less restrictive and that any future cuts will depend on the outlook for further disinflation. Markets reacted with a modest rise in Gilt yields and a decline in EUR/GBP below the 0.87 mark.
In Sweden, CPIF excluding energy came in at 3.15% in July, just below the 3.2% market consensus. However, core inflation remains 0.3 p.p. above the Riksbank's target, with the broader CPIF measure exceeding the June forecast by 0.5 p.p. A positive development is the narrowing gap between actual core inflation and the Riksbank's forecast narrowing from 0.4% in June to 0.3% in July. While the outcome is relatively neutral compared to expectations, a cut by the Riksbank at the 20 August meeting is highly unlikely. Inflation details are due on 14 August.
Equities: Equities edged higher again yesterday, with notable regional divergence as European markets once more led the advance alongside emerging markets, while US indices ended marginally lower. Sector performance offered little in the way of a clear signal, though cyclicals marginally outperformed defensives. Healthcare remained under pressure - less so in the Nordic region - but weighed down by US company-specific headlines. In the US yesterday, Dow -0.5%, S&P 500 -0.1%, Nasdaq +0.4% and Russell 2000 -0.3%. In Asia this morning, the picture is mixed: most markets are in the red, with Japan the clear outperformer, partly on the back of relative "trade-war-position". Futures are pointing higher again in both Europe and the US.
FI and FX: Risk sentiment improved in the European session yesterday with cyclicals pushing equity indices higher. The mood was much more neutral in the US session, where the S&P 500 closed marginally lower. Bonds saw some headwinds through the session as a hawkish BoE and a weak 30Y UST auction added upward pressure on yields. However, market volatility in fixed income market remained muted with very little news to trade on. The USD found some support during the US session before news broke that Trump intends to nominate Stephen Miran as a Federal Reserve Governor, triggering a USD sell-off. EUR/USD is unchanged at 1.166 since yesterday. The upward pressure on EUR/NOK -partly related to the drop in energy prices - continued with the cross now trading above the 11.9 mark.
EUR/USD Daily Outlook
Daily Pivots: (S1) 1.1617; (P) 1.1658; (R1) 1.1705; More...
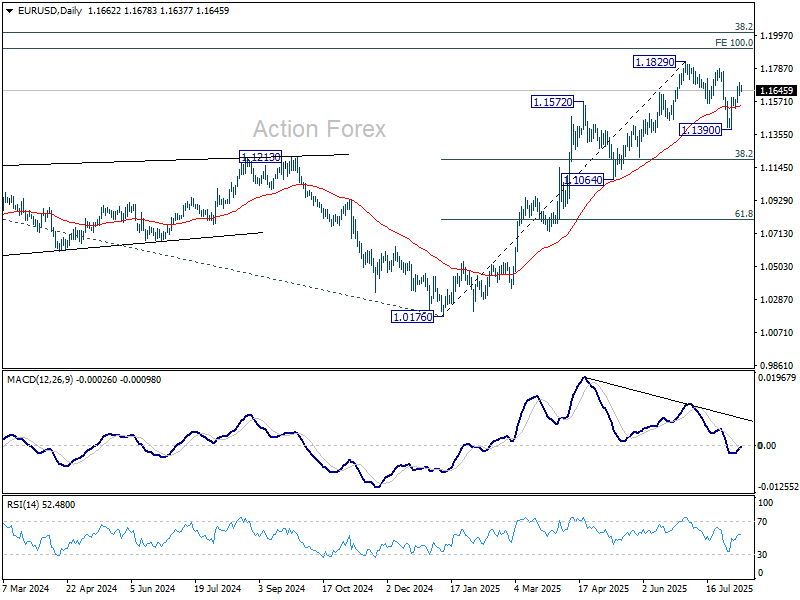
Intraday bias in EUR/USD remains mildly on the upside. As noted before, correction from 1.1829 should have completed with three waves down to 1.1390. Further rally should be seen to retest 1.1788/1820 resistance zone. On the downside, however, break of 1.1526 minor support will dampen this view and bring retest of 1.1390 instead.
In the bigger picture, rise from 0.9534 long term bottom could be correcting the multi-decade downtrend or the start of a long term up trend. In either case, further rise should be seen to 100% projection of 0.9534 to 1.1274 from 1.0176 at 1.1916. This will remain the favored case as long as 1.1604 support holds.
USD/JPY Daily Outlook
Daily Pivots: (S1) 146.66; (P) 147.18; (R1) 147.68; More...
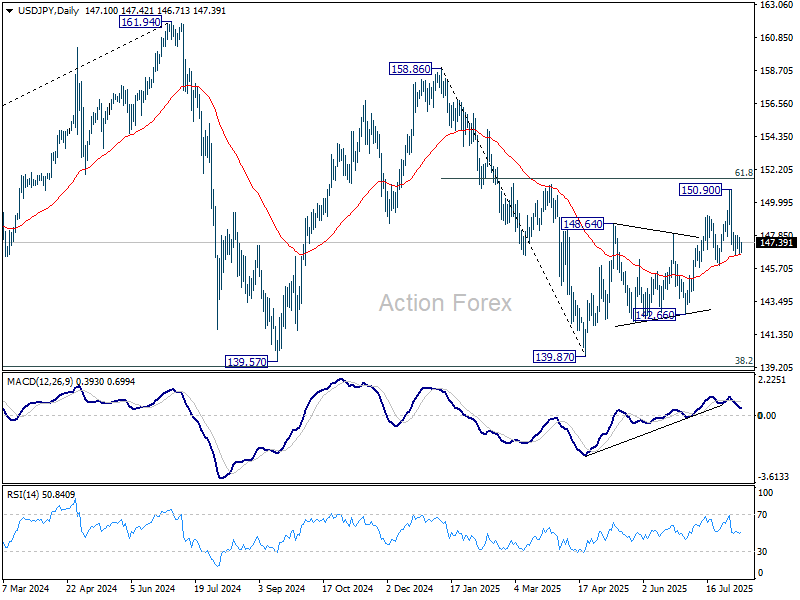
USD/JPY remains bounded in tight range and intraday bias stays neutral. As long as 145.84 support holds, larger rebound from 139.87 is still in favor to continue. On the upside, above 148.07 minor resistance will bring stronger rebound back to retest 150.90. However, on the downside, firm break of 145.84 support will argue that whole rise from 139.87 might have already completed. Deeper fall should then be seen to 142.66 support for confirmation.
In the bigger picture, price actions from 161.94 (2024 high) are seen as a corrective pattern to rise from 102.58 (2021 low). Decisive break of 61.8% retracement of 158.86 to 139.87 at 151.22 will argue that it has already completed with three waves at 139.87. Larger up trend might then be ready to resume through 161.94 high. In case the corrective pattern extends with another fall, strong support is expected from 38.2% retracement of 102.58 to 161.94 at 139.26 to bring rebound.
GBP/USD Daily Outlook
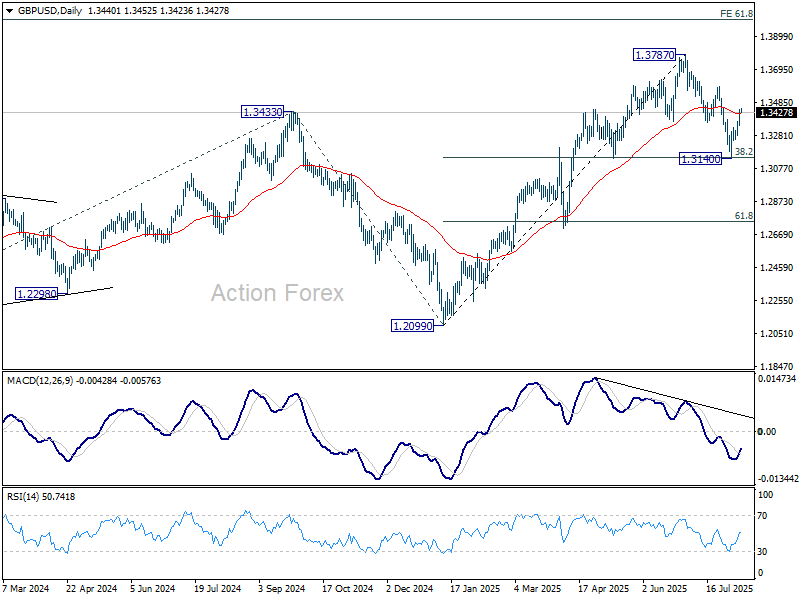
Daily Pivots: (S1) 1.3371; (P) 1.3410; (R1) 1.3484; More...
Intraday bias in GBP/USD remains on the upside at this point. As noted before, correction from 1.3787 should have completed with three waves down to 1.3140. Further rise should be seen to 1.3587 resistance. Firm break there will target 1.3787 high. On the downside, below 1.3344 minor support will turn intraday bias neutral again first.
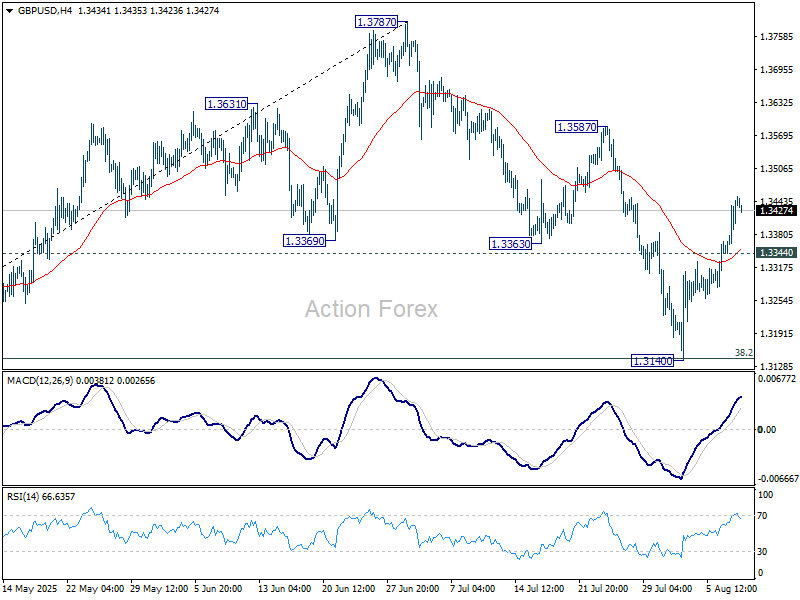
In the bigger picture, up trend from 1.3051 (2022 low) is in progress. Next medium term target is 61.8% projection of 1.0351 to 1.3433 from 1.2099 at 1.4004. Outlook will now stay bullish as long as 55 W EMA (now at 1.3049) holds, even in case of deep pullback.