
Sample Category Title
EUR/JPY Weekly Outlook
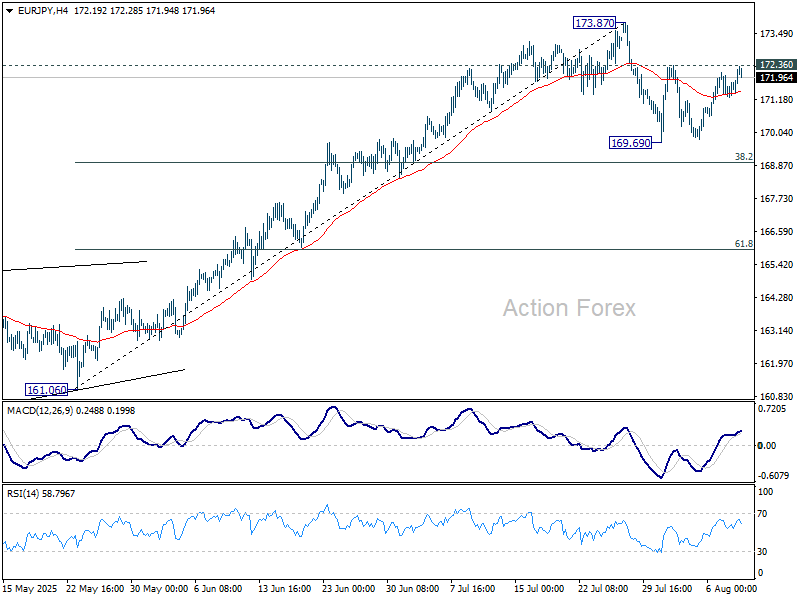
EUR/JPY stayed in range of 169.69/172.36 last week and outlook is unchanged. Initial bias remains neutral this week first. Corrective pattern from 173.87 could extend lower. But downside should be contained by 38.2% retracement of 161.06 to 173.87 at 168.97 to bring rebound. On the upside, above 172.36 will bring retest of 173.87 first. Firm break there will resume larger rally from 154.77 to retest 175.41 high.
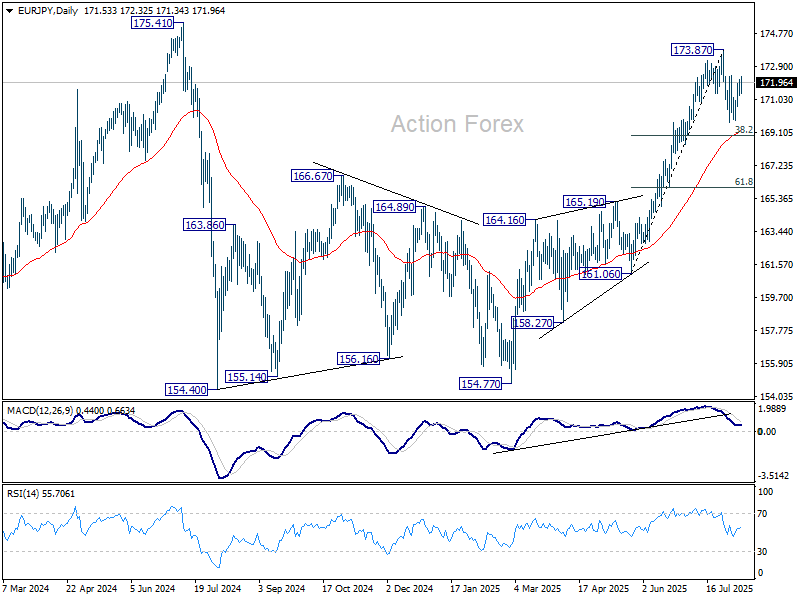
In the bigger picture, considering current strong momentum as seen in the rally from 154.77, corrective pattern from 175.41 could have already completed. Decisive break of 154.77 will confirm long term up trend resumption. Next target is 61.8% projection of 124.37 to 175.41 from 154.77 at 186.31. However, rejection by 175.41, followed by firm break of 55 D EMA (now at 169.27) will delay this bullish case.
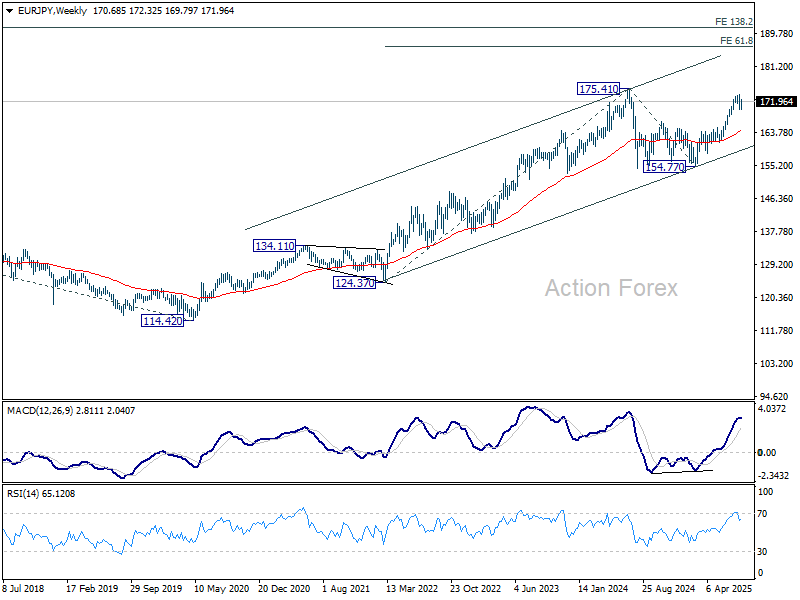
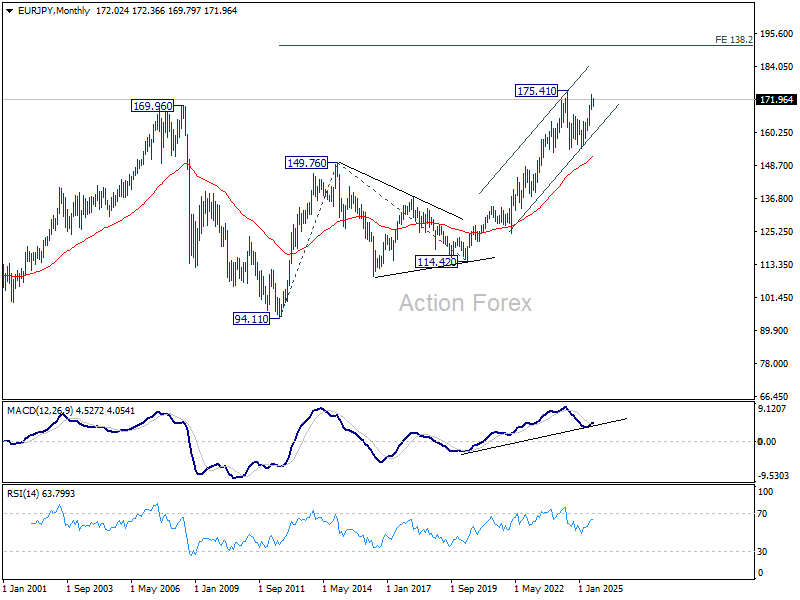
In the long term picture, up trend fro 94.11 (2021 low) is still in progress. On resumption, next target is 138.2% projection of 94.11 to 149.76 (2014 high) from 114.42 (2020 low) at 191.32.
EUR/GBP Weekly Outlook
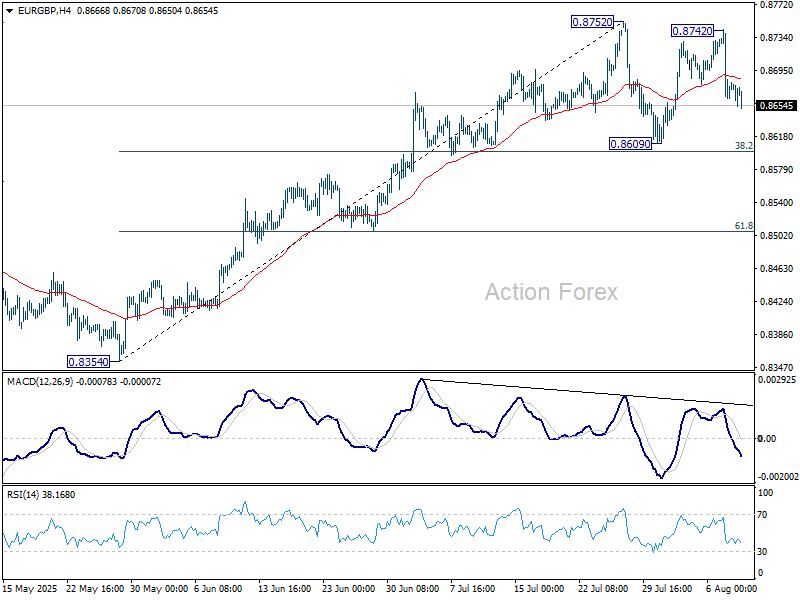
EUR/GBP jumped to 0.8742 last week but reversed ahead of 0.8752 resistance. Consolidations pattern from 0.8752 is still extending and initial bias stays neutral this week first. Downside should be contained by 38.2% retracement of 0.8354 to 0.8752 at 0.8600. On the upside, firm break of 0.8752 will resume the rise from 0.8354 towards 0.8867 fibonacci level.
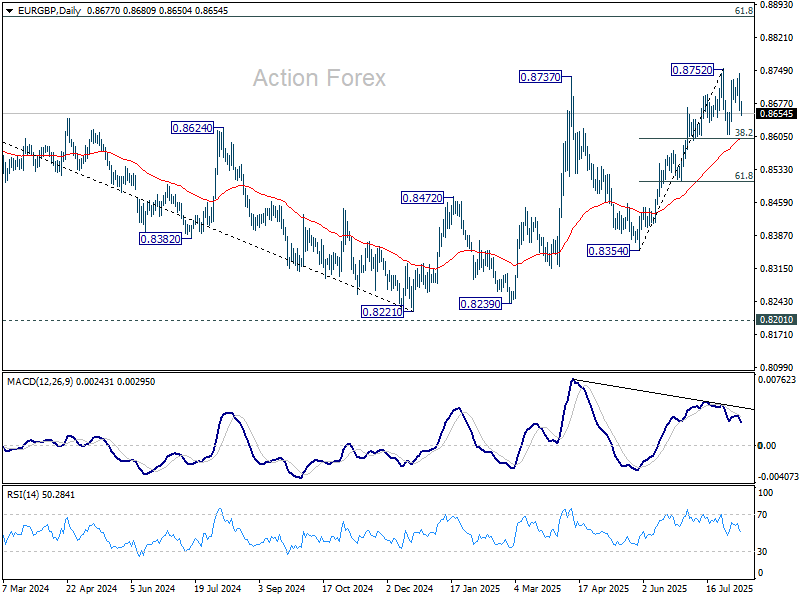
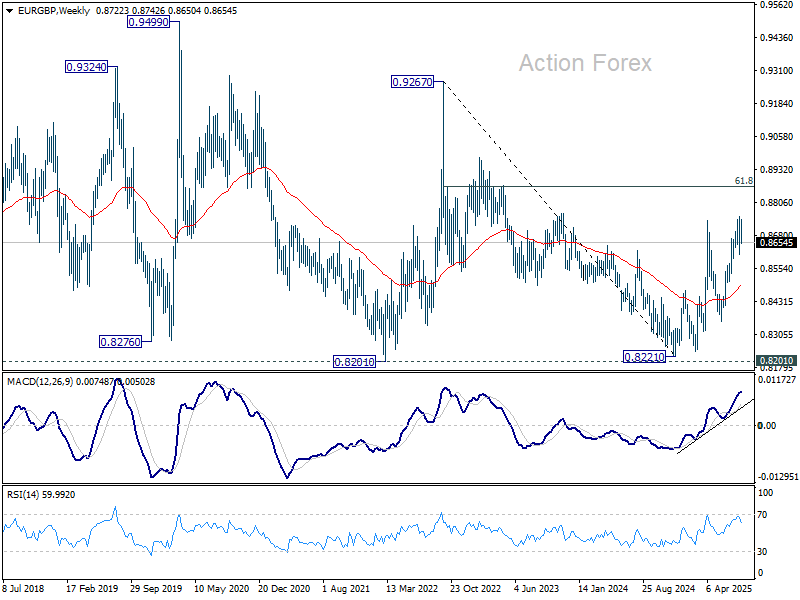
In the bigger picture, the structure from 0.8221 medium term bottom are not impulsive enough to suggest that it's reversing the down trend from 0.9267 (2022 high). But even if it's a correction, further rise is expected to 61.8% retracement of 0.9267 to 0.8221 at 0.8867. This will remain the favored case as long as 55 W EMA (now at 0.8491) holds.
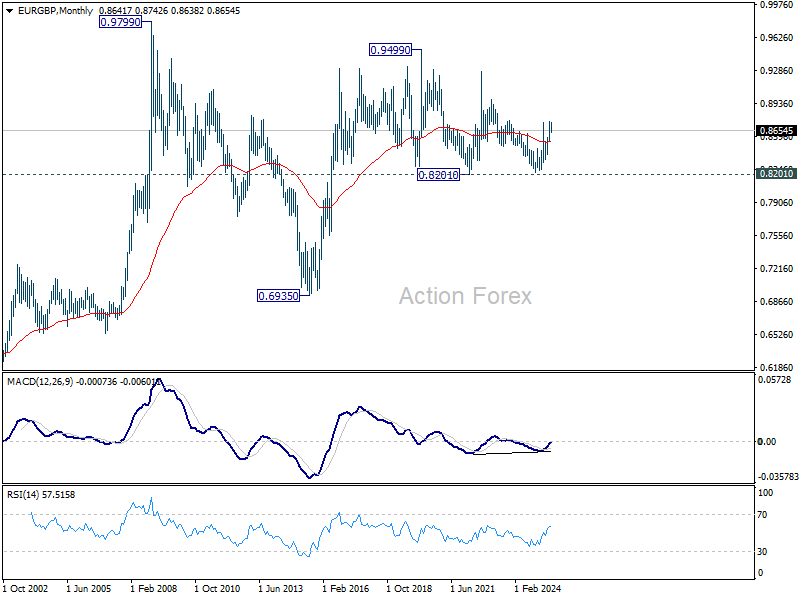
In the long term picture, price action from 0.9499 (2020 high) is seen as part of the long term range pattern from 0.9799 (2008 high). Range trading should continue between 0.8201 and 0.9499, until there is clear signal of imminent breakout.
EUR/AUD Weekly Outlook
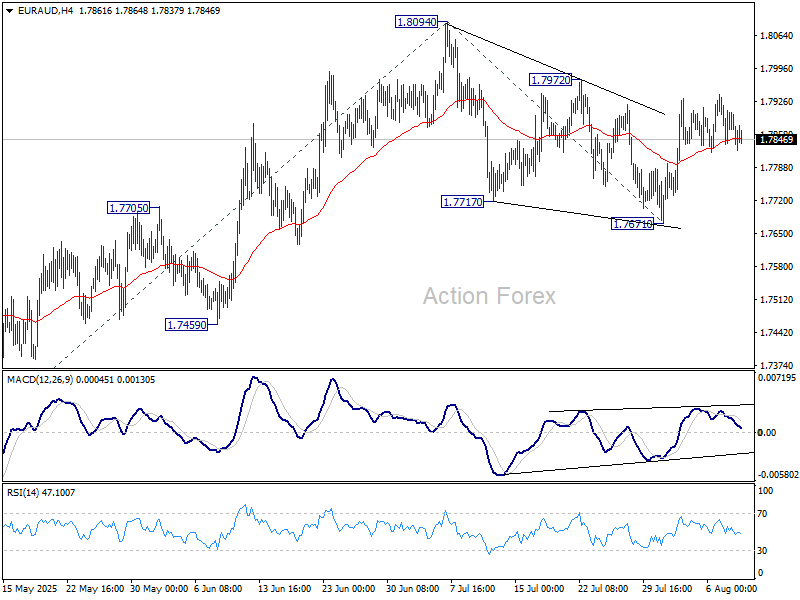
EUR/AUD was bounded in tight range below 1.7972 resistance last week and outlook is unchanged. Initial bias stays neutral this week first. ON the upside, firm break of 1.7972 should confirm that corrective pattern from 1.8094 has completed. Further rise should then be seen through 1.8094, to resume the rebound from 1.7245. Next target is 61.8% projection of 1.7245 to 1.8094 from 1.7671 at 1.8196. On the downside, below 1.7671 will bring deeper fall back to 1.7459 support instead.
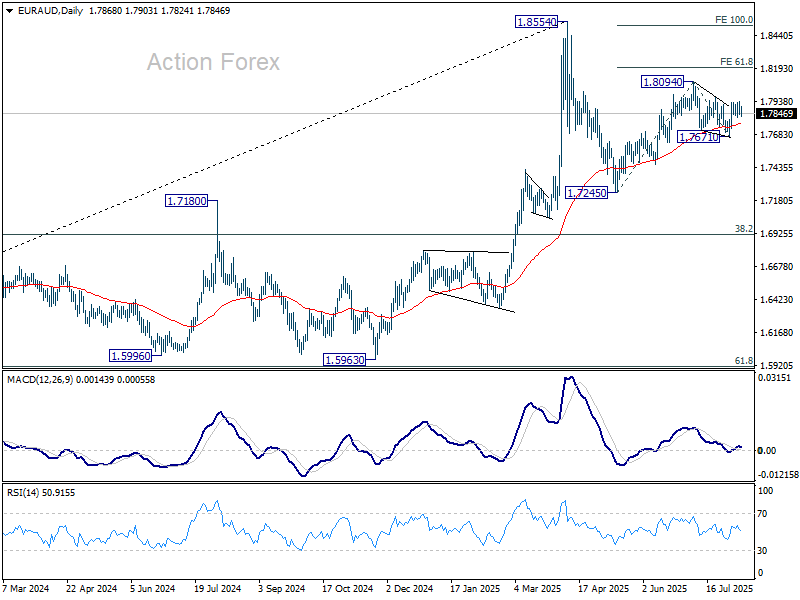
In the bigger picture, price actions from 1.8554 medium term top are seen as a corrective pattern. Such pattern could extend further with another falling leg. But even in that case, downside should be contained by 38.2% retracement of 1.4281 (2022 low) to 1.8554 at 1.6922 to bring rebound. Uptrend from 1.4281 is expected to resume at a later stage.
In the longer term picture, rise from 1.4281 is seen as the second leg of the pattern from 1.9799 (2020 high), which is part of the pattern from 2.1127 (2008 high). As long as 55 M EMA (now at 1.6414) holds, this second leg could still extend higher.
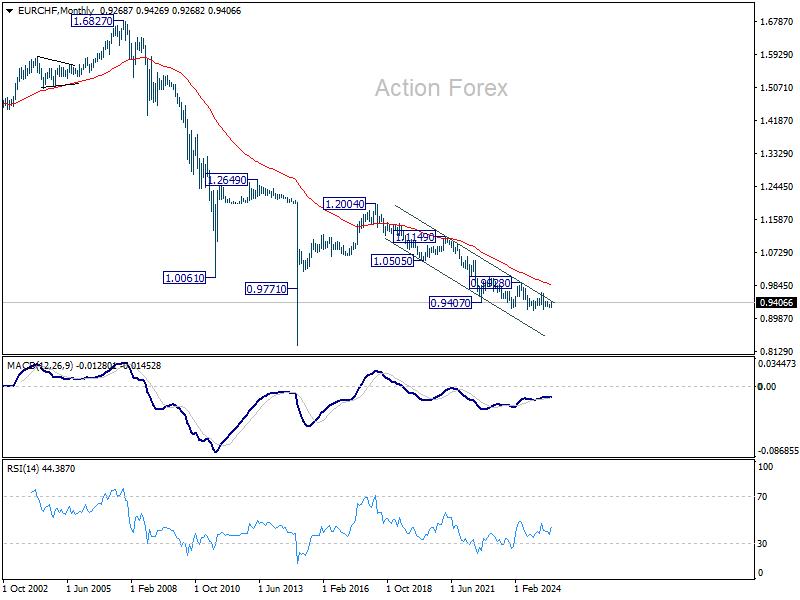
EUR/CHF Weekly Outlook
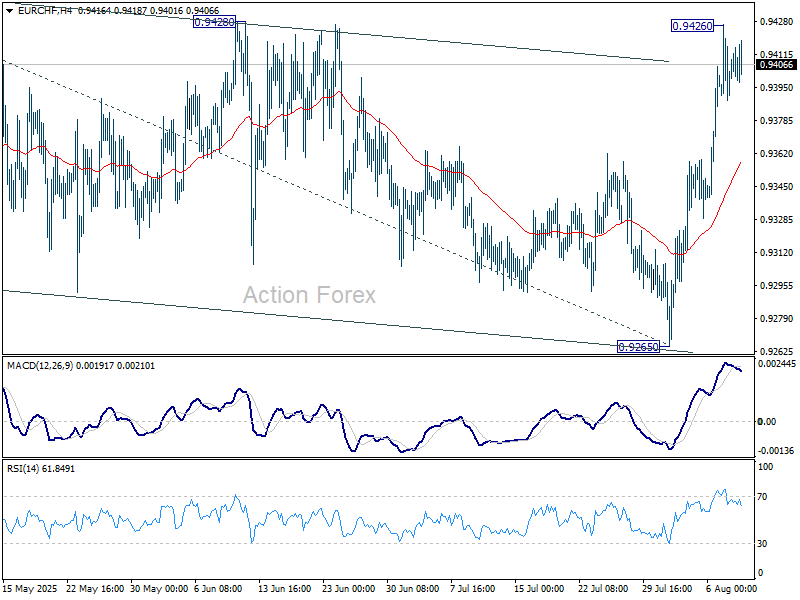
EUR/CHF surged to as high as 0.9426 last week but turned sideway just ahead of 0.9428 resistance. Initial bias is turned neutral this week first. Current development argues that corrective pattern from 0.9445 has completed with three waves down to 0.9265. Firm break of 0.9428 should confirm this bullish case, and target 0.9445 and then 100% projection of 0.9218 to 0.9445 from 0.9265 at 0.9492. However, sustained trading below 55 4H EMA (now at 0.9357) with extend the corrective pattern with another falling leg.
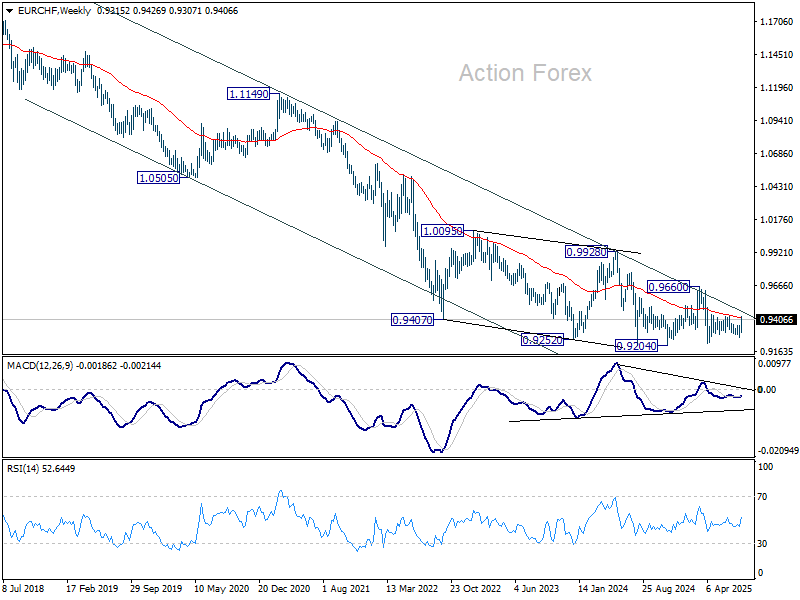
In the bigger picture, the down trend from 0.9204 (2018 high) might still be in progress considering that EUR/CHF is staying well inside the long term falling channel. However, with bullish convergence condition in W MACD, downside position should be limited in case of another fall. Instead, firm break of 0.9660 resistance will be an important sign of medium term bullish trend reversal.

In the long term picture, overall long term down trend is still in progress in EUR/CHF. Outlook will continue to stay bearish as long as 55 M EMA (now at 0.9855) holds.
Summary 8/11 – 8/15
Monday, Aug 11, 2025
| GMT | Ccy | Events | Consensus | Previous |
|---|---|---|---|---|
| 09:00 | EUR | Italy Trade Balance (EUR) Jun | 7.12B | 6.16B |
| 23:50 | JPY | Money Supply M2+CD Y/Y Jul | 0.80% | 0.90% |
| GMT | Ccy | Events | |
|---|---|---|---|
| 09:00 | EUR | Italy Trade Balance (EUR) Jun | |
| Forecast: 7.12B | Previous: 6.16B | ||
| 23:50 | JPY | Money Supply M2+CD Y/Y Jul | |
| Forecast: 0.80% | Previous: 0.90% | ||
Tuesday, Aug 12, 2025
| GMT | Ccy | Events | Consensus | Previous |
|---|---|---|---|---|
| 01:30 | AUD | NAB Business Confidence Jul | 5 | |
| 01:30 | AUD | NAB Business Conditions Jul | 9 | |
| 04:30 | AUD | RBA Interest Rate Decision | 3.60% | 3.85% |
| 06:00 | GBP | Claimant Count Change Jul | 25.9K | |
| 06:00 | GBP | ILO Unemployment Rate (3M) Jun | 4.70% | 4.70% |
| 06:00 | GBP | Average Earnings Including Bonus 3M/Y Jun | 4.70% | 5.00% |
| 06:00 | GBP | Average Earnings Excluding Bonus 3M/Y Jun | 5.00% | |
| 09:00 | EUR | Germany ZEW Economic Sentiment Aug | 40 | 52.7 |
| 09:00 | EUR | Germany ZEW Current Situation Aug | -63 | -59.5 |
| 09:00 | EUR | Eurozone ZEW Economic Sentiment Aug | 28.4 | 36.1 |
| 10:00 | USD | NFIB Business Optimism Index Jul | 98.6 | 98.6 |
| 12:30 | CAD | Building Permits M/M Jun | 12% | |
| 12:30 | USD | CPI M/M Jul | 0.20% | 0.30% |
| 12:30 | USD | CPI Y/Y Jul | 2.80% | 2.70% |
| 12:30 | USD | CPI Core M/M Jul | 0.30% | 0.20% |
| 12:30 | USD | CPI Core Y/Y Jul | 3.00% | 2.90% |
| 23:50 | JPY | PPI Y/Y Jul | 2.50% | 2.90% |
| GMT | Ccy | Events | |
|---|---|---|---|
| 01:30 | AUD | NAB Business Confidence Jul | |
| Forecast: | Previous: 5 | ||
| 01:30 | AUD | NAB Business Conditions Jul | |
| Forecast: | Previous: 9 | ||
| 04:30 | AUD | RBA Interest Rate Decision | |
| Forecast: 3.60% | Previous: 3.85% | ||
| 06:00 | GBP | Claimant Count Change Jul | |
| Forecast: | Previous: 25.9K | ||
| 06:00 | GBP | ILO Unemployment Rate (3M) Jun | |
| Forecast: 4.70% | Previous: 4.70% | ||
| 06:00 | GBP | Average Earnings Including Bonus 3M/Y Jun | |
| Forecast: 4.70% | Previous: 5.00% | ||
| 06:00 | GBP | Average Earnings Excluding Bonus 3M/Y Jun | |
| Forecast: | Previous: 5.00% | ||
| 09:00 | EUR | Germany ZEW Economic Sentiment Aug | |
| Forecast: 40 | Previous: 52.7 | ||
| 09:00 | EUR | Germany ZEW Current Situation Aug | |
| Forecast: -63 | Previous: -59.5 | ||
| 09:00 | EUR | Eurozone ZEW Economic Sentiment Aug | |
| Forecast: 28.4 | Previous: 36.1 | ||
| 10:00 | USD | NFIB Business Optimism Index Jul | |
| Forecast: 98.6 | Previous: 98.6 | ||
| 12:30 | CAD | Building Permits M/M Jun | |
| Forecast: | Previous: 12% | ||
| 12:30 | USD | CPI M/M Jul | |
| Forecast: 0.20% | Previous: 0.30% | ||
| 12:30 | USD | CPI Y/Y Jul | |
| Forecast: 2.80% | Previous: 2.70% | ||
| 12:30 | USD | CPI Core M/M Jul | |
| Forecast: 0.30% | Previous: 0.20% | ||
| 12:30 | USD | CPI Core Y/Y Jul | |
| Forecast: 3.00% | Previous: 2.90% | ||
| 23:50 | JPY | PPI Y/Y Jul | |
| Forecast: 2.50% | Previous: 2.90% | ||
Wednesday, Aug 13, 2025
| GMT | Ccy | Events | Consensus | Previous |
|---|---|---|---|---|
| 01:30 | AUD | Wage Price Index Q/Q Q2 | 0.80% | 0.90% |
| 06:00 | JPY | Machine Tool Orders Y/Y Jul | -0.50% | |
| 06:00 | EUR | Germany CPI M/M Jul F | 0.30% | 0.30% |
| 06:00 | EUR | Germany CPI Y/Y Jul F | 2.00% | 2.00% |
| 14:30 | USD | Crude Oil Inventories | -3.0M | |
| 23:01 | GBP | RICS Housing Price Balance Jul | -5% | -7% |
| GMT | Ccy | Events | |
|---|---|---|---|
| 01:30 | AUD | Wage Price Index Q/Q Q2 | |
| Forecast: 0.80% | Previous: 0.90% | ||
| 06:00 | JPY | Machine Tool Orders Y/Y Jul | |
| Forecast: | Previous: -0.50% | ||
| 06:00 | EUR | Germany CPI M/M Jul F | |
| Forecast: 0.30% | Previous: 0.30% | ||
| 06:00 | EUR | Germany CPI Y/Y Jul F | |
| Forecast: 2.00% | Previous: 2.00% | ||
| 14:30 | USD | Crude Oil Inventories | |
| Forecast: | Previous: -3.0M | ||
| 23:01 | GBP | RICS Housing Price Balance Jul | |
| Forecast: -5% | Previous: -7% | ||
Thursday, Aug 14, 2025
| GMT | Ccy | Events | Consensus | Previous |
|---|---|---|---|---|
| 01:30 | AUD | Employment Change Jul | 25.3K | 2.0K |
| 01:30 | AUD | Unemployment Rate Jul | 4.20% | 4.30% |
| 06:00 | GBP | GDP Q/Q Q2 P | 0.10% | 0.70% |
| 06:00 | GBP | GDP M/M Jun | 0.20% | -0.10% |
| 06:00 | GBP | Industrial Production M/M Jun | 0.50% | -0.90% |
| 06:00 | GBP | Industrial Production Y/Y Jun | -0.30% | |
| 06:00 | GBP | Manufacturing Production M/M Jun | 0.50% | -1.00% |
| 06:00 | GBP | Manufacturing Production Y/Y Jun | 0.30% | |
| 06:00 | GBP | Goods Trade Balance (GBP) Jun | -21.9B | -21.7B |
| 06:30 | CHF | Producer and Import Prices M/M Jul | 0.00% | -0.10% |
| 06:30 | CHF | Producer and Import Prices Y/Y Jul | -0.70% | |
| 09:00 | EUR | Eurozone GDP Q/Q Q2 P | 0.10% | 0.10% |
| 09:00 | EUR | Eurozone Employment Change Q/Q Q2 P | 0.20% | 0.20% |
| 09:00 | EUR | Eurozone Industrial Production M/M Jun | -0.80% | 1.70% |
| 12:30 | USD | PPI M/M Jul | 0.20% | 0.00% |
| 12:30 | USD | PPI Y/Y Jul | 2.30% | |
| 12:30 | USD | PPI Core M/M Jul | 0.20% | 0.00% |
| 12:30 | USD | PPI Core Y/Y Jul | 2.60% | |
| 12:30 | USD | Initial Jobless Claims (Aug 8) | 227K | 226K |
| 14:30 | USD | Natural Gas Storage | 7B | |
| 22:30 | NZD | Business NZ PMI Jul | 48.8 | |
| 23:50 | JPY | GDP Q/Q Q2 P | 0.10% | 0.00% |
| 23:50 | JPY | GDP Deflator Y/Y Q2 P | 3.30% |
| GMT | Ccy | Events | |
|---|---|---|---|
| 01:30 | AUD | Employment Change Jul | |
| Forecast: 25.3K | Previous: 2.0K | ||
| 01:30 | AUD | Unemployment Rate Jul | |
| Forecast: 4.20% | Previous: 4.30% | ||
| 06:00 | GBP | GDP Q/Q Q2 P | |
| Forecast: 0.10% | Previous: 0.70% | ||
| 06:00 | GBP | GDP M/M Jun | |
| Forecast: 0.20% | Previous: -0.10% | ||
| 06:00 | GBP | Industrial Production M/M Jun | |
| Forecast: 0.50% | Previous: -0.90% | ||
| 06:00 | GBP | Industrial Production Y/Y Jun | |
| Forecast: | Previous: -0.30% | ||
| 06:00 | GBP | Manufacturing Production M/M Jun | |
| Forecast: 0.50% | Previous: -1.00% | ||
| 06:00 | GBP | Manufacturing Production Y/Y Jun | |
| Forecast: | Previous: 0.30% | ||
| 06:00 | GBP | Goods Trade Balance (GBP) Jun | |
| Forecast: -21.9B | Previous: -21.7B | ||
| 06:30 | CHF | Producer and Import Prices M/M Jul | |
| Forecast: 0.00% | Previous: -0.10% | ||
| 06:30 | CHF | Producer and Import Prices Y/Y Jul | |
| Forecast: | Previous: -0.70% | ||
| 09:00 | EUR | Eurozone GDP Q/Q Q2 P | |
| Forecast: 0.10% | Previous: 0.10% | ||
| 09:00 | EUR | Eurozone Employment Change Q/Q Q2 P | |
| Forecast: 0.20% | Previous: 0.20% | ||
| 09:00 | EUR | Eurozone Industrial Production M/M Jun | |
| Forecast: -0.80% | Previous: 1.70% | ||
| 12:30 | USD | PPI M/M Jul | |
| Forecast: 0.20% | Previous: 0.00% | ||
| 12:30 | USD | PPI Y/Y Jul | |
| Forecast: | Previous: 2.30% | ||
| 12:30 | USD | PPI Core M/M Jul | |
| Forecast: 0.20% | Previous: 0.00% | ||
| 12:30 | USD | PPI Core Y/Y Jul | |
| Forecast: | Previous: 2.60% | ||
| 12:30 | USD | Initial Jobless Claims (Aug 8) | |
| Forecast: 227K | Previous: 226K | ||
| 14:30 | USD | Natural Gas Storage | |
| Forecast: | Previous: 7B | ||
| 22:30 | NZD | Business NZ PMI Jul | |
| Forecast: | Previous: 48.8 | ||
| 23:50 | JPY | GDP Q/Q Q2 P | |
| Forecast: 0.10% | Previous: 0.00% | ||
| 23:50 | JPY | GDP Deflator Y/Y Q2 P | |
| Forecast: | Previous: 3.30% | ||
Friday, Aug 15, 2025
| GMT | Ccy | Events | Consensus | Previous |
|---|---|---|---|---|
| 02:00 | CNY | Industrial Production Y/Y Jul | 6.00% | 6.80% |
| 02:00 | CNY | Retail Sales Y/Y Jul | 4.60% | 4.80% |
| 02:00 | CNY | Fixed Asset Investment (YTD) Y/Y Jul | 2.70% | 2.80% |
| 04:30 | JPY | Industrial Production M/M Jun F | 1.70% | 1.70% |
| 12:30 | CAD | Manufacturing Sales M/M Jun | 0.40% | -0.90% |
| 12:30 | CAD | Wholesale Sales M/M Jun | 0.30% | 0.10% |
| 12:30 | USD | Retail Sales M/M Jul | 0.50% | 0.60% |
| 12:30 | USD | Retail Sales ex Autos M/M Jul | 0.30% | 0.50% |
| 12:30 | USD | Empire State Manufacturing Index Aug | -1 | 5.5 |
| 12:30 | USD | Import Price Index M/M Jul | 0.00% | 0.10% |
| 13:15 | USD | Industrial Production M/M Jul | 0.00% | 0.30% |
| 13:15 | USD | Capacity Utilization Jul | 77.50% | 77.60% |
| 14:00 | USD | Business Inventories Jun | 0% | |
| 14:00 | USD | UoM Consumer Sentiment Aug P | 62.1 | 61.7 |
| 14:00 | USD | UoM 1-Y Inflation Expectations Aug P | 4.50% |
| GMT | Ccy | Events | |
|---|---|---|---|
| 02:00 | CNY | Industrial Production Y/Y Jul | |
| Forecast: 6.00% | Previous: 6.80% | ||
| 02:00 | CNY | Retail Sales Y/Y Jul | |
| Forecast: 4.60% | Previous: 4.80% | ||
| 02:00 | CNY | Fixed Asset Investment (YTD) Y/Y Jul | |
| Forecast: 2.70% | Previous: 2.80% | ||
| 04:30 | JPY | Industrial Production M/M Jun F | |
| Forecast: 1.70% | Previous: 1.70% | ||
| 12:30 | CAD | Manufacturing Sales M/M Jun | |
| Forecast: 0.40% | Previous: -0.90% | ||
| 12:30 | CAD | Wholesale Sales M/M Jun | |
| Forecast: 0.30% | Previous: 0.10% | ||
| 12:30 | USD | Retail Sales M/M Jul | |
| Forecast: 0.50% | Previous: 0.60% | ||
| 12:30 | USD | Retail Sales ex Autos M/M Jul | |
| Forecast: 0.30% | Previous: 0.50% | ||
| 12:30 | USD | Empire State Manufacturing Index Aug | |
| Forecast: -1 | Previous: 5.5 | ||
| 12:30 | USD | Import Price Index M/M Jul | |
| Forecast: 0.00% | Previous: 0.10% | ||
| 13:15 | USD | Industrial Production M/M Jul | |
| Forecast: 0.00% | Previous: 0.30% | ||
| 13:15 | USD | Capacity Utilization Jul | |
| Forecast: 77.50% | Previous: 77.60% | ||
| 14:00 | USD | Business Inventories Jun | |
| Forecast: | Previous: 0% | ||
| 14:00 | USD | UoM Consumer Sentiment Aug P | |
| Forecast: 62.1 | Previous: 61.7 | ||
| 14:00 | USD | UoM 1-Y Inflation Expectations Aug P | |
| Forecast: | Previous: 4.50% | ||
Markets Weekly Outlook – US Inflation, EU/UK GDP and RBA Meeting to Shape Market Moves
Week in review - Solid Week for Global Equities
It was a quiet week for economic updates, giving analysts time to review last week's data, which clearly showed demand slowing down. While labor productivity remains strong, slower activity and rising service sector prices suggest mild stagflation.
We had a host of Central Bank meetings this week where the U.K., India, and Mexico took cautious actions. The Bank of England and Mexico's Banxico cut rates, while India’s central bank kept rates steady due to currency concerns. Switzerland had an unexpected rise in inflation, and Mexico’s core inflation stayed high despite overall easing. In New Zealand, weak job data points to a likely rate cut.
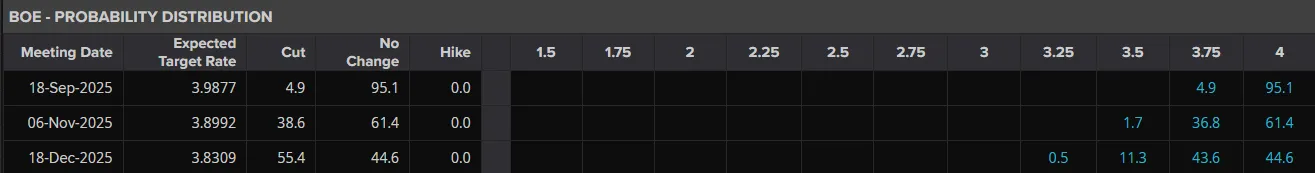
The Bank of England (BoE) meeting was the one that caught the attention of market participants. The BoE cut rates by 25 basis points to 4%, but their statement suggests the rate cuts may soon stop. Policymakers are concerned about stubbornly high inflation, which remains well above their target.
The Bank's statement noted that monetary policy is less restrictive as rates are cut. Markets see this as a signal, now expecting fewer cuts with just two by next summer and none this year.
Source: LSEG
Despite these developments global equity markets continued their impressive run. In the US dip buyers returned Monday, boosted by hopes of Fed action in September and a Trump ally joining the board, signaling a dovish shift. Despite inflation concerns, strong earnings kept investors confident in Wall Street.
In Europe, shares had their best week in 12 weeks, driven by banking stocks and hopes for a Russia-Ukraine ceasefire. The STOXX 600 rose 0.2% Friday, up 2.2% for the week. Eurozone banks gained 1.9% Friday, leading year-to-date with a 56.8% rise.
Of the 198 companies in the STOXX 600 that reported earnings through Tuesday, 53% exceeded analysts' estimates, according to data compiled by LSEG.
The dollar strengthened on Friday but is set for a weekly drop after July's jobs report showed weaker-than-expected hiring and sharp downward revisions to previous months' gains.
Oil prices dipped Friday, heading for their biggest weekly drop since June due to US-Russia deal reports and a weaker economic outlook. Brent crude fell to $66.36, and WTI dropped to $63.67.
US gold futures hit a record high Friday amid uncertainty over U.S. tariffs on common gold bar sizes. Spot gold stayed steady at $3,399.91 per ounce, up 1% for the week. Analysts await clarity, noting tariffs could heavily impact Switzerland, a key gold refining hub.
The Week Ahead
The week ahead has several important data releases lined up. The US and UK will release inflation data and GDP data and from Asia we have a few high impact data releases
Asia Pacific Markets - RBA Meeting, Japan GDP and Chinese Inflation
The Reserve Bank of Australia (RBA) is expected to cut the cash rate by 25 basis points to 3.6% at Tuesday's meeting, following weaker-than-expected growth and inflation data.
Last month, the RBA surprised markets by keeping the rate at 3.85%, seeking more proof that inflation was easing toward its 2.5% target. Since then, softer Q2 inflation and June jobs data suggest the RBA may now opt for a rate cut.
China will release its July inflation data on Saturday, with consumer prices expected to dip into deflation at -0.1% year-on-year due to ongoing pressures. Efforts to curb price competition are unlikely to show immediate results.
Economic data for July, out Friday, may highlight slowing activity. Housing prices have fallen faster in recent months, and without new policies, this trend could continue. Industrial production, which beat expectations in June, is expected to slow to 6.2% YoY. Retail sales, boosted by trade-in policies, may ease to 4.6% YoY as policy effects fade. Fixed asset investment remains weak, with private investment held back by uncertainty, likely growing just 2.8% YoY.
Japan's second-quarter GDP, out Friday, is expected to show modest growth of 0.1% after a 0.04% contraction in Q1. Weak exports and inventory changes may weigh on growth, but a rebound in services and private consumption should support a slight recovery. The data could influence chances of an October rate hike by the Bank of Japan.
Europe, UK and the US Focus on Inflation and GDP Data
From the US inflation data due on Tuesday will be the focus. In June, core goods prices (excluding autos) rose 0.6% MoM, the largest jump since February 2022. For July, we expect a similar increase, with autos also likely driving inflation higher. Vehicle prices, which surprisingly fell in June despite tariff pressures, and rising car auction prices add upside risk. We forecast a 0.4% MoM rise in core CPI, above the 0.3% consensus.
The Fed is unlikely to face a repeat of 2021/22's supply shock-driven 9% inflation. Key factors like oil prices, housing rents, and wage growth, which fueled inflation then, are now cooling and should help offset tariff effects in the coming months.
On Friday we will get retail sales and consumer confidence data. Strong auto sales may boost retail figures, but weak consumer confidence, driven by tariff concerns, job market worries, and household wealth volatility, suggests slower activity in the second half of the year.
In the UK we have jobs data due on Tuesday which will be key given the BoE decision this week as well as the upgraded forecasts.
The BoE remained calm about the job market in August, even as payrolls have steadily declined. Another sharp drop in hiring is possible, though these figures are often revised upward later. GDP data will follow on Thursday where Q1 saw a boost from export surges ahead of US tariffs, but Q2 has been weaker. Still, overall activity likely grew modestly in the spring.
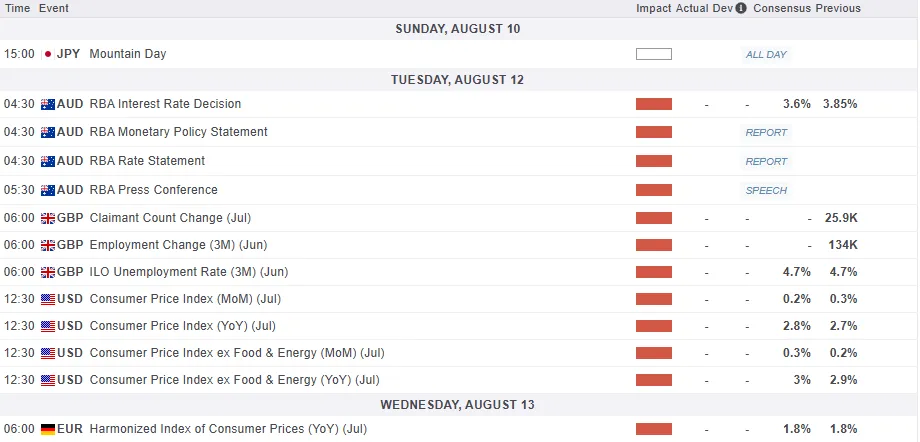
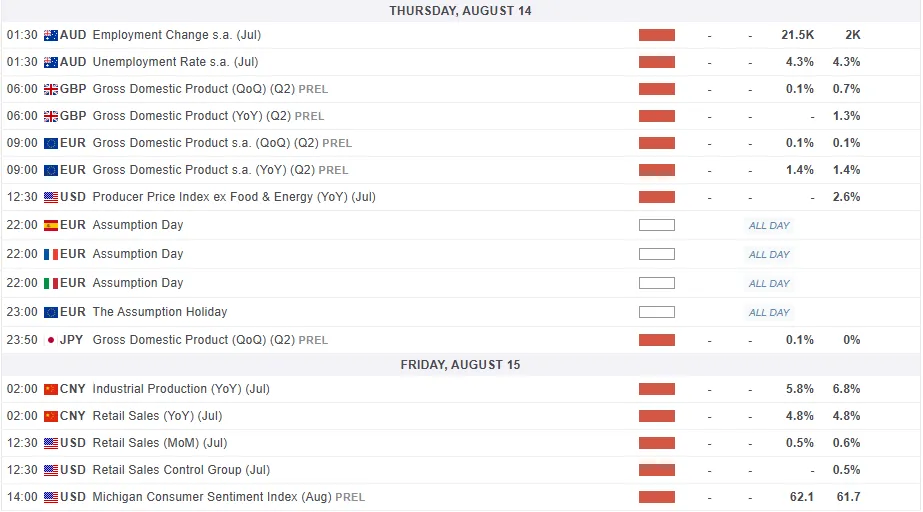
For all market-moving economic releases and events, see the MarketPulse Economic Calendar. (click to enlarge)
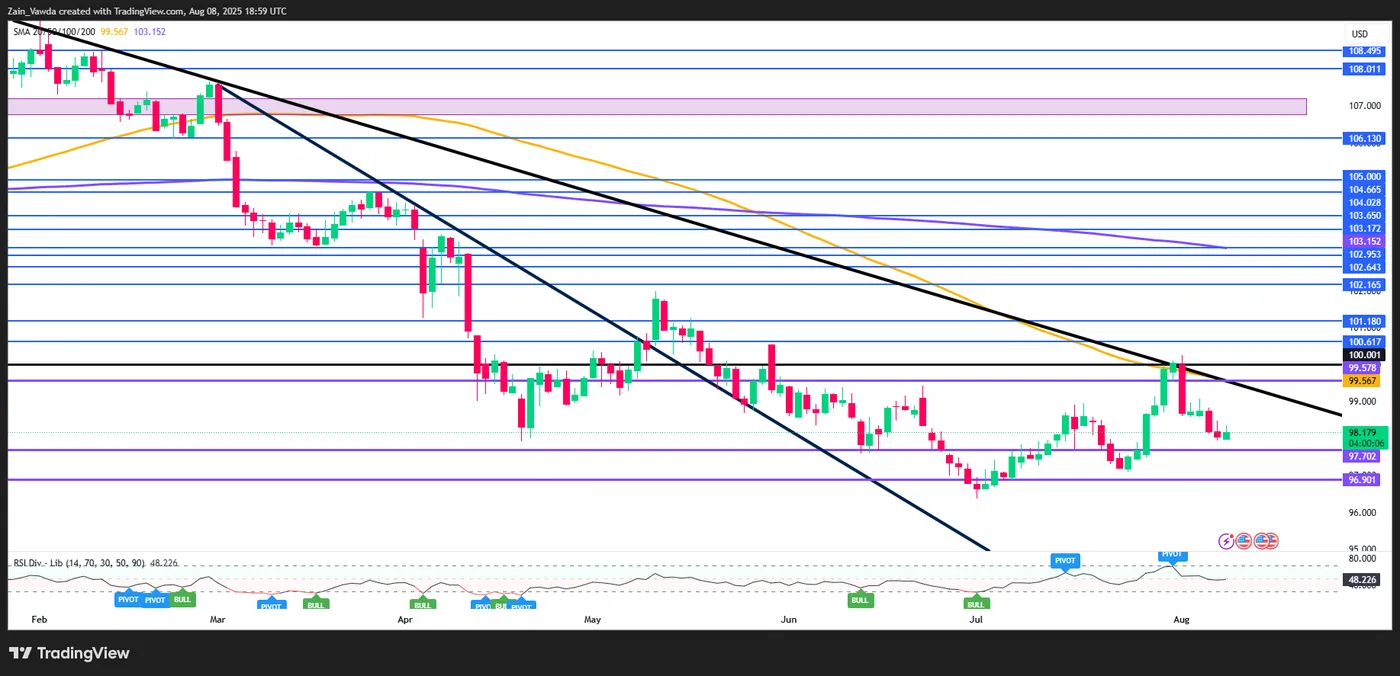
Chart of the Week - US Dollar Index (DXY)
This week's Chart of the week is the US Dollar Index (DXY).
The DXY rally which faded last week Friday, rejected the long-term descending trendline which has been in play since the start of 2025.
There appears to be significant concerns around the US Dollar for now and the fact that the DXY rejection occurred at the 100.00 confluence level is a big deal in my opinion.
The big cuts to U.S. job numbers have definitely challenged the Fed's claim of a 'solid' labor market. This gives the Fed more confidence that the summer inflation rise will be temporary, likely leading to rate cuts in September.
This leaves the US Dollar vulnerable to further downside moving forward with sellers likely to flood in on any short-term rallies higher. We saw a bit of that this week already with Monday and Tuesday seeing attempts at a rally being met by significant selling pressure.
On the RSI period-14 the DXY flirts with the neutral 50 level, with a move lower showing that momentum is indeed with the bears.
For now any rally higher will need to gain acceptance above the descending trendline and the 100.00 confluence level. If this happens and we see some change in the fundamentals around the US Dollar then perhaps i would change my stance. Right now, such a move seems unlikely.
US Dollar Index (DXY) Daily Chart - August 8, 2025
Source: TradingView.Com (click to enlarge)
Key Levels to Consider:
Support
- 97.70
- 96.90
- 96.37 (YTD Low)
Resistance
- 98.56
- 99.56
- 100.00 (confluence level)
The Weekly Bottom Line: U.S. Economy Stagnating Just as Tariff Rates Reset
Canadian Highlights
- Canada’s labour market took a step back in July after June’s job surge. Despite a sizeable job loss, the unemployment rate remained steady.
- Canadian exports recovered modestly in June, but the trade damage in the second quarter has been done.
- This week’s data inches the Bank of Canada toward a rate cut in either September or October.
U.S. Highlights
- As of August 7th, dozens of U.S. trading partners face significantly higher tariff rates, pushing the U.S. effective rate to roughly 19%.
- July’s reading of ISM services provided further evidence that the U.S. economy is stagnating, with employment, new-orders and business activity all turning lower.
- Following last week’s employment report, Fed officials appear to be pivoting their communication. A September cut is more likely than not.
Canada – Trade Tensions Weighing on Labour Market
Canada’s labour market found itself in choppy waters in July. The nation shed around 40k jobs, coming in well below consensus expectations for a modest gain and unwinding around half of June’s hiring surge. A similar drop in July’s labour force growth kept the unemployment rate steady at 6.9%, a silver lining in an otherwise weak report. Markets reacted by pushing yields on the 2 and 10-year bonds down around 5 bps, while the Loonie depreciated three-tenths of a cent against the U.S.
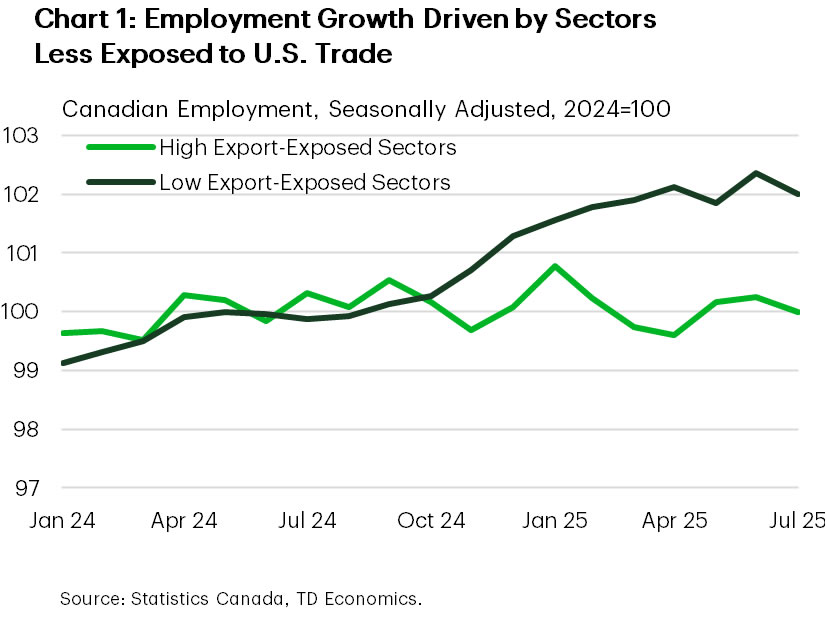
The labour market is showing clear evidence of loosening in response to U.S. tariffs and broader uncertainty. This is even more pronounced in the performance of more trade-exposed sectors. Of the 180k jobs created since Trump won the presidency, highly export-exposed industries accounted for only 10% of the gain, despite accounting for around a third of total employment (Chart 1). Notably, trade-exposed sectors like manufacturing, natural resources, agriculture, and transportation have experienced outright job losses over the last six months. The path forward is a little less clear, but we expect hiring sentiment to remain weak through the third quarter as firms navigate trade-related headwinds.
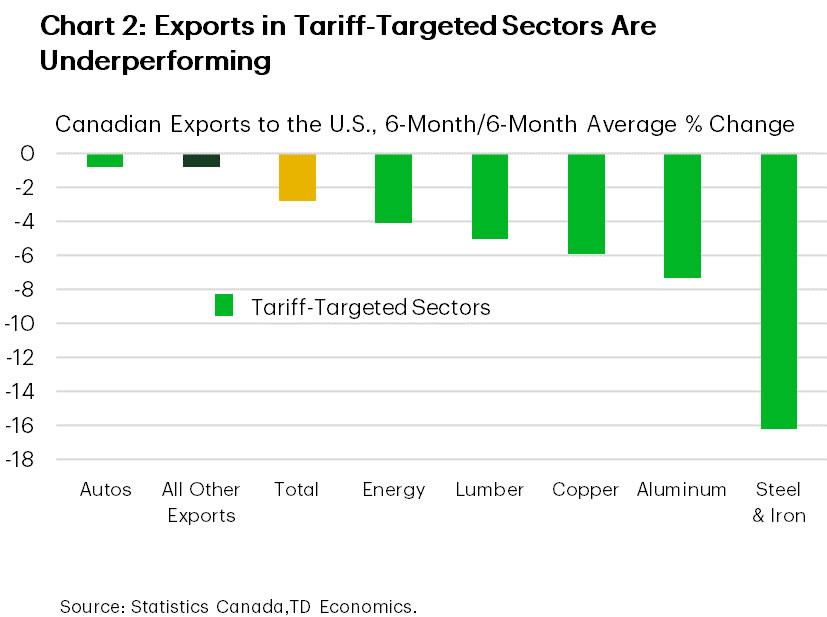
We also received Canadian trade data for June this week. Exports managed to edge forward for a second consecutive month, but levels remain depressed compared to March. The slight advance in imports was skewed by a near $2-billion high-value import of equipment for an oil project in Newfoundland. All told, Q2 GDP growth–due out at the end of the month–will likely see a contraction as exports tumbled. Mirroring the trend in labour markets, exports of tariff-impacted sectors are showing signs of underperformance. Chart 2 illustrates that exports of steel, aluminum, copper and energy have suffered more than the rest of the Canadian export basket over the past six months. Encouragingly, shipments to the U.S. as a share of total exports have dropped sharply in recent months, suggesting Canada may be slowly diversifying trade away from the U.S.
Elsewhere, the federal government stepped up its support for the ailing softwood lumber sector. In total, the lumber industry will receive $1.2 billion in financial supports ($700 million in loan guarantees and $500 million in grants and contributions). The lumber industry now joins the automotives and steel/aluminum sectors in receiving direct federal government supports meant to address negative impacts from U.S. trade policy.
We think this week’s events only marginally move the BoC in the direction of a cut at their meeting in September. Markets agree, having re-priced the probability of a 25% bps cut to north of 40% (30% probability prior to the jobs report). Inflation data later this month will be more telling and could move the needle further toward a September cut should core inflation pressures show any signs of easing. Taken altogether, we think there is a strong argument for further rate easing later this year.
U.S. – U.S. Economy Stagnating Just as Tariff Rates Reset
It was a quiet week on the economic data calendar, but with earnings season in full swing, further trade announcements, and several Fed officials out speaking, there were no shortage of developments for investors to sift through. To say this earnings season has gone better than expected would be an understatement. At this point, over 80% of companies included in the S&P 500 have reported second-quarter earnings. According to Reuters, after factoring in analysts’ forecasts for the remaining 20%, profit growth is tracking close to 12% annualized. That’s more than double what was expected just one month ago, and has without question been a driving force sustaining the recent strength in equities. At the time of writing, the S&P 500 is up 2% on the week and 8.5% on the year. Meanwhile, term-yields climbed a bit higher on the week, even after President Trump appointed Stephen Miran to complete Adriana Kugler’s brief remaining term on the FOMC, and more dovish leaning Governor Waller was reported to be the frontrunner for Fed Chair.
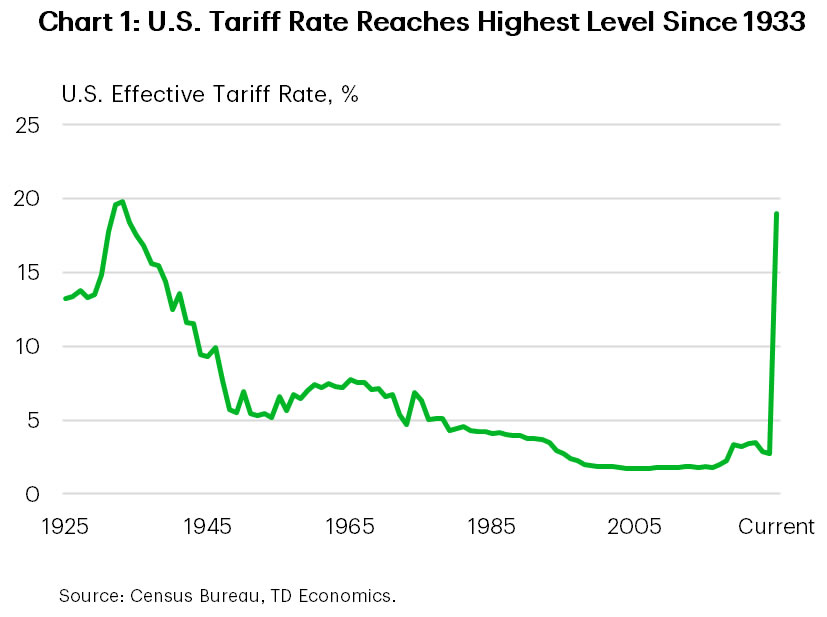
But we would argue that the run in equity markets this year is built on a shaky foundation. Inventory stockpiling and a haphazard rollout of the administration’s tariff policies meant that many businesses were able to circumvent or significantly limit tariff exposure last quarter. But that’s not going to continue. As of August 7th, dozens of trading partners now face significantly higher tariffs as per the Executive Order released by the White House on July 31st. By our estimates, the current effective tariff rate in the U.S. is around 19%, or the highest level since 1933 (Chart 1).
Over the near-term, it’s very likely that the U.S. tariff rate pushes even higher. The Trump administration singled out India this week, threatening an additional 25% tariff on August 27th and hinted at further tariffs on semiconductors – potentially as a 100% – and pharmaceuticals over the coming weeks.
While the economy had demonstrated unwavering resilience earlier in the year, more recent data has shown that ground is starting to shift. This week’s ISM services report provided further evidence that the economy is slowing, with the services index slipping to 50.1 or just barely remaining in expansionary territory. Details of the report came with plenty of ‘stagflationary undertones’, with new-orders, business activity and employment all turning lower, while the prices paid sub-component remained near its cyclical high.
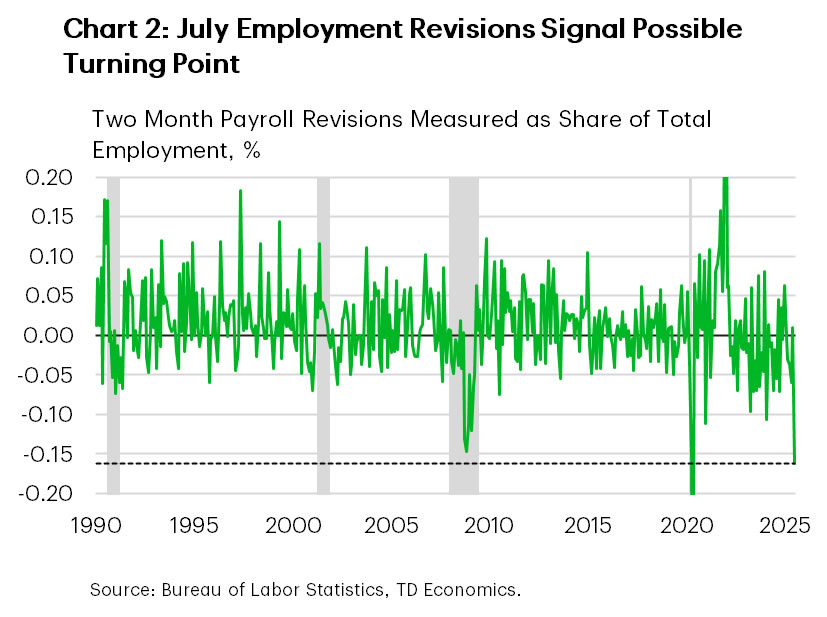
The shift in economic data has led Fed officials to pivot on their communication, with regional Fed President’s including Neel Kashkari and Mary Daly – neither of whom are voting members – to suggest that rate cuts are coming in the months ahead. Meanwhile, Governor Cook characterized last week’s tepid jobs report as ‘concerning’ and noted that the significant downward revisions to the May/June figures, which were some of the largest on record, are ‘typical of turning points in the economy’ (Chart 2). Next week’s CPI inflation data will shed more light on the extent of tariff passthrough, but even that is feeling somewhat backward looking given this week’s reset on tariff rates. Ultimately, the weakness in the labor market cannot be ignored and (in our view) solidifies the case for a September rate cut.
Weekly Economic & Financial Commentary: Tariff Headwinds Meet Productivity Tailwinds
Summary
United States: Tariff Headwinds Meet Productivity Tailwinds
- It was a quiet week on the economic indicator calendar, allowing analysts to continue to digest the array of data released last week that provided unambiguous signs of demand materially slowing. Solid labor productivity remains a bright spot, but slowing activity and broadening price pressures in the service sector point to mild stagflation.
- Next week: Consumer Price Index (Tue.), Retail Sales (Fri.), Industrial Production (Fri.)
International: Mixed Data from Foreign Economies Amid Global Uncertainties
- This week, central banks across the U.K., India and Mexico made cautious policy decisions. The Bank of England and Banxico cut rates, while the Reserve Bank of India held steady amid currency stability concerns. Switzerland saw a surprise rise in inflation, and Mexico’s core inflation remained sticky despite headline easing. And finally, down under, soft labor market data in New Zealand supports expectations for a rate cut.
- Next week: Reserve Bank of Australia Policy Rate (Tue.), Norges Bank Policy Rate (Thu.), China Industrial Production and Retail Sales (Fri.)
Interest Rate Watch: For (Term) Premium Subscribers
- In this week's Interest Rate Watch section, we discuss the outlook for the neutral rate and term premiums in the context of the fair value for the 10-year Treasury yield. If we add our estimate of the overnight rate to current estimates of the 10-year term premium, we get a long-run, fair value estimate of the 10-year Treasury yield around 4%, not too far from the current spot rate.
Topic of the Week: Duty Calls
- In a recent escalation of trade policy, the Trump administration announced updated reciprocal tariffs ranging from 10% to 41% on goods from over 60 countries. The overall macroeconomic effect remains uncertain, and while the updated tariffs offer some clarity and stability in the short term, significant uncertainties remain.
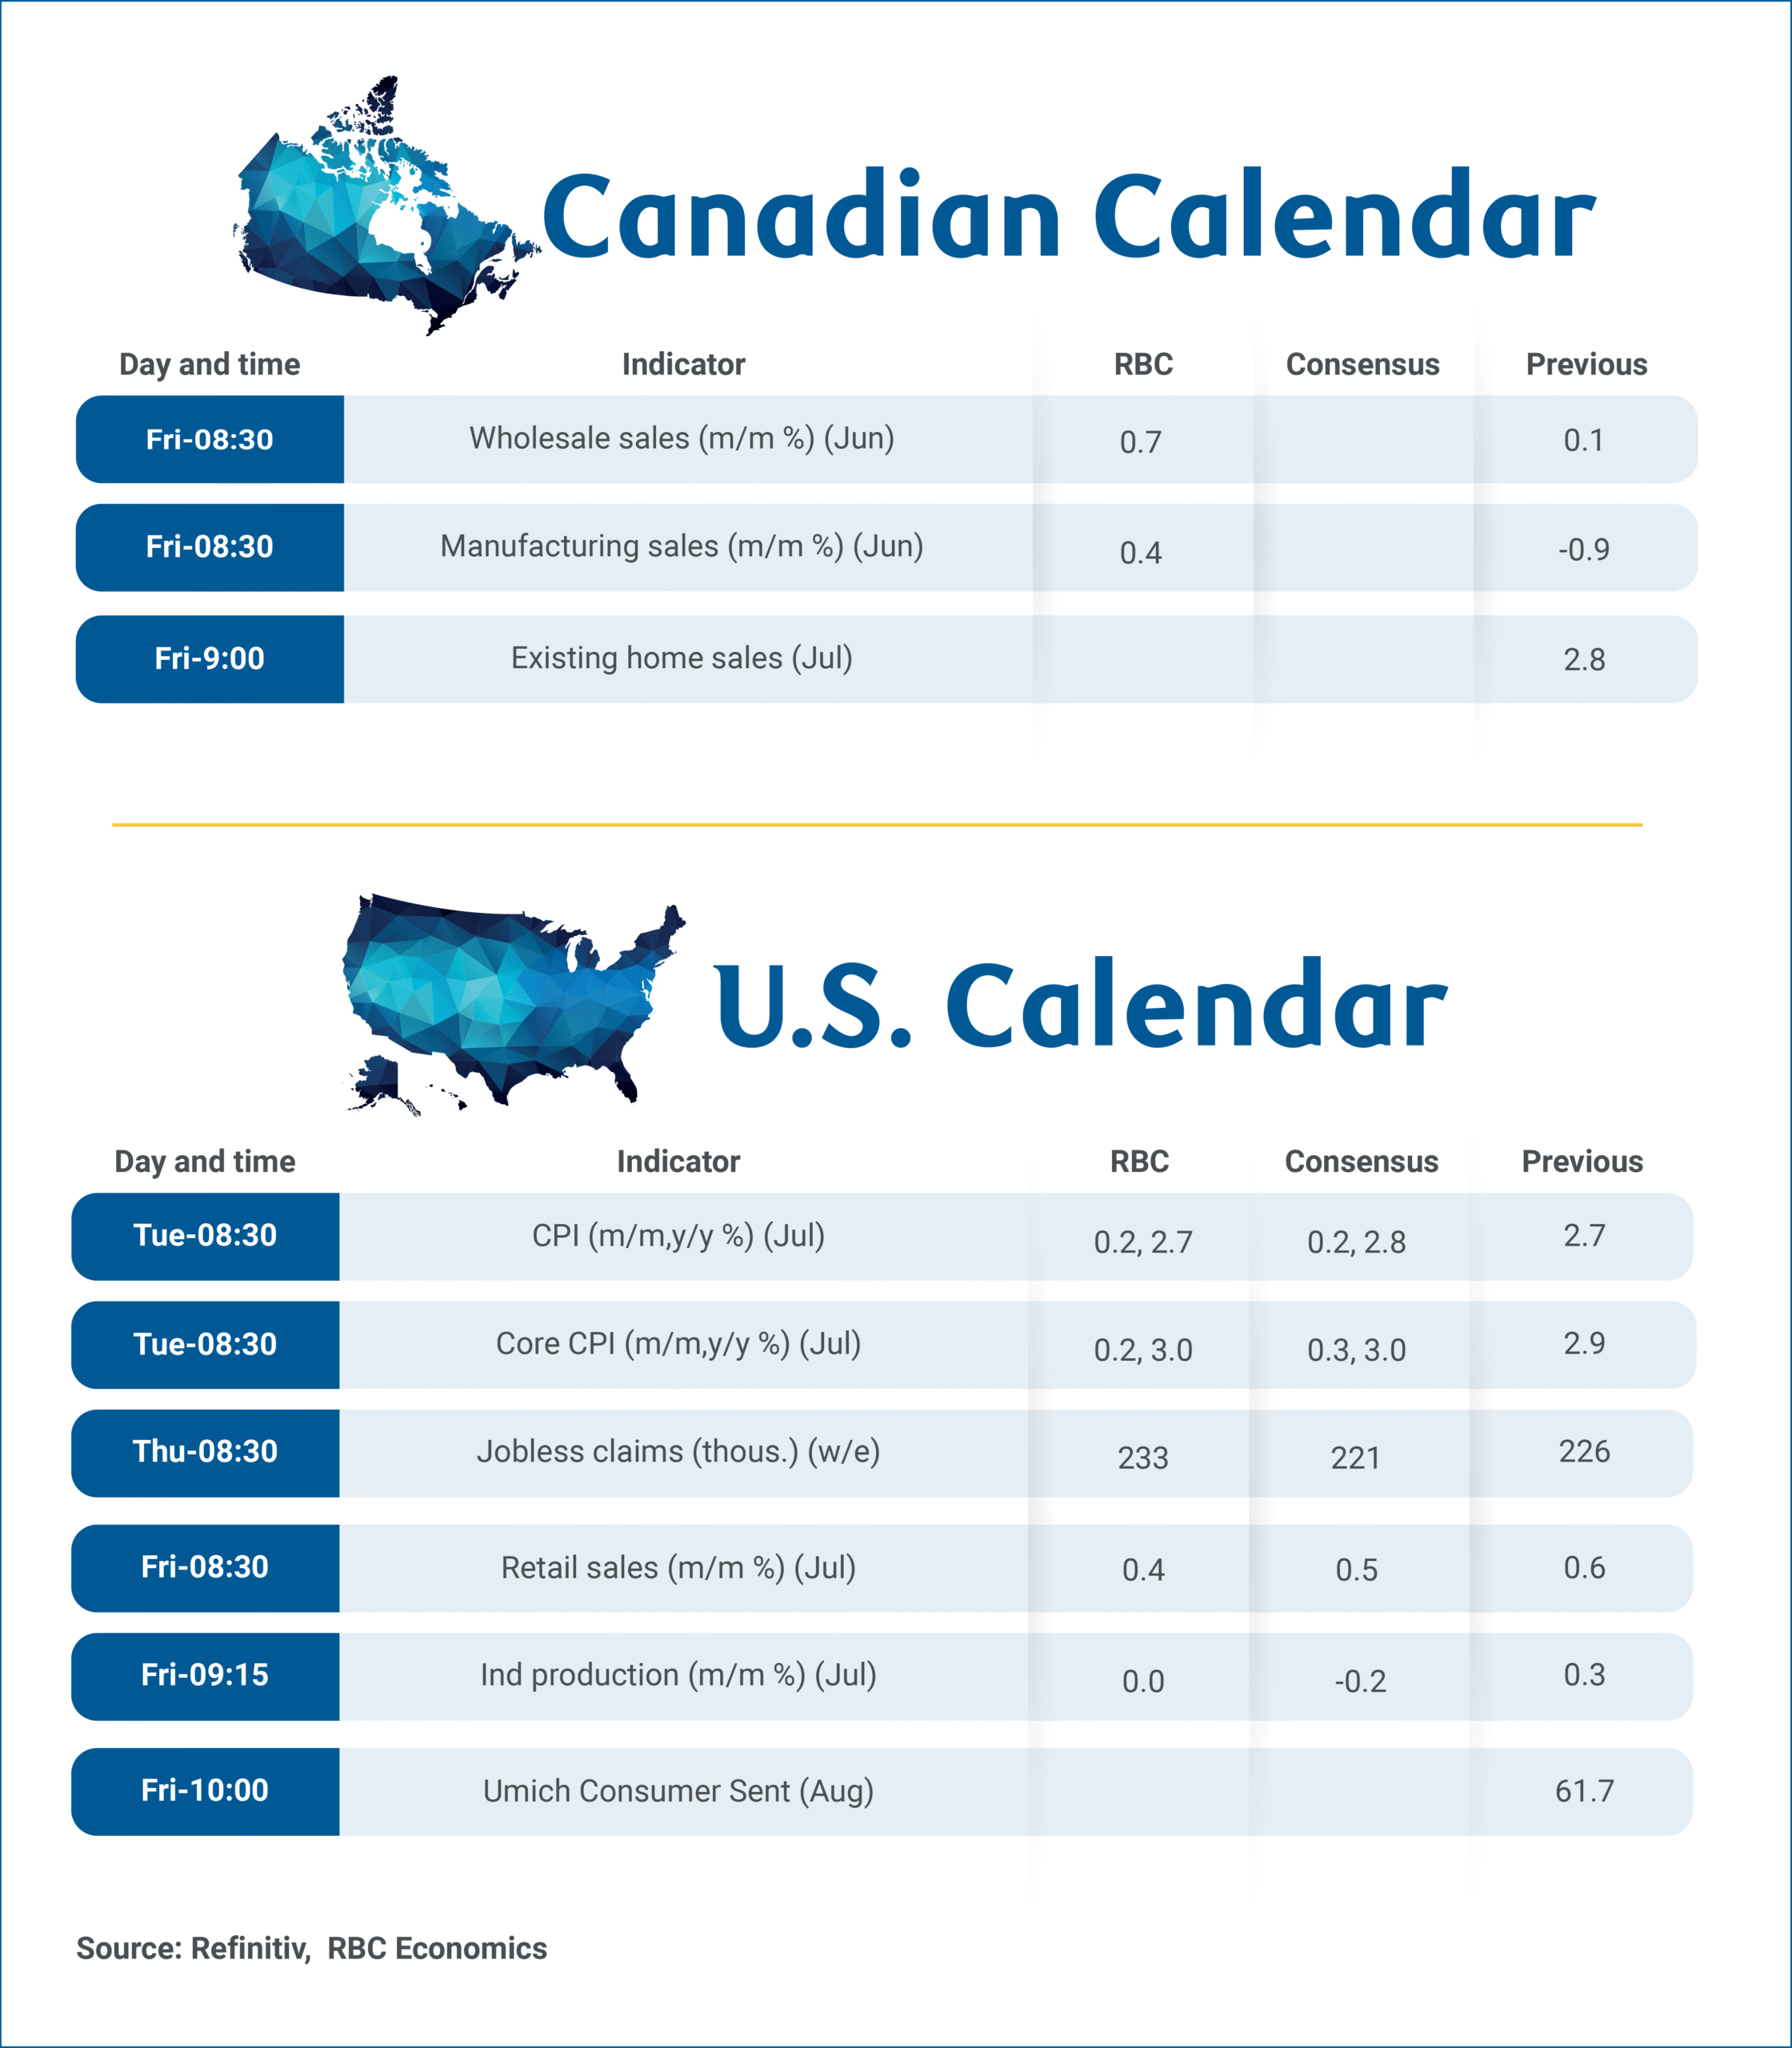
Canada’s Industrial Data to Highlight Q2 Growth While U.S. Inflation to Remain Steady
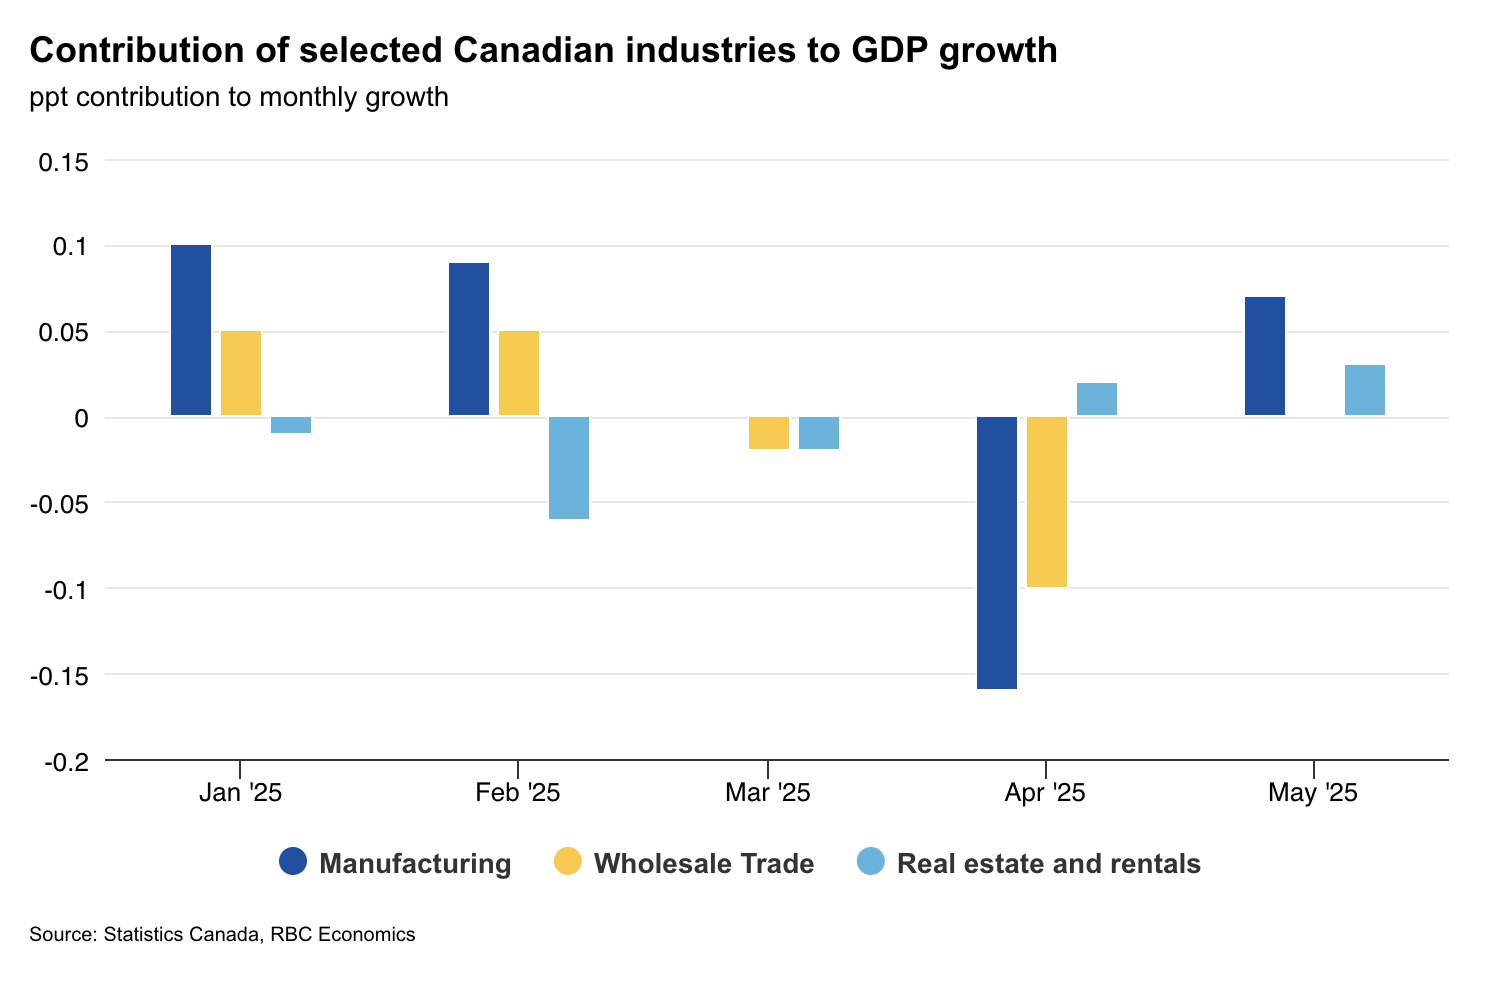
Canadian manufacturing and wholesale trade reports on Friday will be in focus to help gauge the impact that U.S. tariffs are having on the trade-exposed industrial sector.
Early trade reports have been showing most Canadian exports continue to enter the U.S. duty free under an exemption from tariffs for products compliant with the CUSMA. Canada has maintained a relative advantage in accessing the U.S. market.
But, sector specific tariffs on steel, aluminum, and the non-U.S. content of motor vehicle exports, along with new tariffs on copper products in August still apply. Those tariffs are raising costs for U.S. buyers and a slowdown in their manufacturing activity could spill over to Canada, given heavily integrated cross-border supply chains.
Statistics Canada’s advance indicator for manufacturing sales rose 0.4% in June, led by petroleum and coal products likely reflecting a jump in oil prices as well as food manufacturing sales. A rise in manufacturing industrial product prices suggests that real (volume) manufacturing sales were likely little changed compared to May, and still down about 3% from the end of 2024.
We expect core wholesale sales, which exclude petroleum and its products, oilseed and grain, to rise 0.7% from 0.1% in May. Growth appeared to be broad based with five of seven subsectors contributing to the increase.
Meanwhile, early data is expected to continue to confirm that domestic household spending is resilient compared to the externally exposed industrial sector. Early housing reports are pointing to further recovery in home resales in July after plunging consumer confidence sent prospective buyers to the sidelines in the spring.
U.S. consumer prices and spending key for policymakers
In the U.S., the focus will be on inflation on Tuesday and consumer spending on Friday after a softer-than-expected July jobs report increased speculation that the Federal Reserve could cut interest rates sooner than previously expected.
A bounce back in auto sales in July points to an increase in retail sales, but policymakers will also be watching the consumer price index for further signs on whether tariffs are beginning to show up in store prices.
Headline inflation is expected to remain steady at 2.7% year-over-year as a modest rise in food prices will likely be offset by a decline in energy costs. Meanwhile, core inflation, which excludes food and energy, is projected to edge slightly higher to 3% from 2.9% in June on an annual basis.
Weekly Focus – Mixed Feelings
The mood in financial markets has remained upbeat towards the late summer as peak uncertainty over US trade policies appears to ease. Even if the US July Jobs Report showed that employment growth has been clearly weaker than previously thought, economic surprise indices have otherwise stabilized at neutral or slightly positive levels across all major economies. Risky assets, like equities have performed well while most measures of implied volatility are hovering near long-term median levels.
The array of updated tariff rates, which now cover practically all major US trading partners, took effect yesterday. US importers paid more tariffs for their H1 imports than they did during the entire 2024 despite unusually low import volumes after April's Liberation Day.
Firms have likely drawn down their front-loaded inventories while anticipating further clarity on tariffs. And at the same time, the latest July trade data from China revealed that Chinese firms have diversified their exports towards third countries especially in South-East Asia. But as the broad-based tariffs leave little room for re-routing, US importers will eventually have to accept further increases in tariff costs towards the fall. This week's ISM services index provided sense of the stagflationary risks that might await ahead, as growth in business activity and new orders slowed down while the sub-index for price pressures reached its highest level since October 2022.
The combination of upside risks to inflation and downside risks to growth continues to divide views across the world's central bankers. This week, Bank of England cut its policy rate by 25bp, but the decision was closer than expected, with four out of nine committee members voting against the cut. Read more from our BoE Review, 7 August.
On the other side of the Atlantic, Trump nominated Stephen Miran to temporarily fill the vacant seat in the FOMC after Adriana Kugler stepped down from the Board of Governors last week. Miran, who is known as a Trump loyalist and as the author of the article outlining the so-called 'Mar-a-Lago accord', has downplayed the inflation risks related to tariffs and called for structural reforms within the Fed. The nomination will still need to be approved by Senate, which reconvenes after its summer recess on 2 September. While his term will last only until the end of January, he will likely be among the candidates for the next 14-year term as well. The search for Fed chair Powell's successor continues as well, and after Treasury Secretary Scott Bessent ruled himself out of the considerations, top contenders include Christopher Waller, Kevin Warsh and Kevin Hassett.
On the geopolitical front, Trump is scheduled to meet Russian president Putin over the coming days to discuss the war in Ukraine, after US special envoy Witkoff visited Moscow this week. The exact time and location of the meeting are still unclear, but we remain doubtful that major breakthroughs will be reached. US imposed an additional 25% tariff on India yesterday to curb the country's imports of Russian oil.
Next week, the focus will remain on the US as the July CPI is due for release on Tuesday. We expect headline inflation to land at +0.2% m/m SA (2.8% y/y) but core inflation to accelerate to +0.3% m/m SA (3.0% y/y) as tariff costs ramp up.