

Sample Category Title
Gold and WTI Crude Oil Climb Higher Amid Market Optimism
Gold price started a fresh increase above the $3,350 resistance level. WTI Crude Oil price climbed higher above $66.50 and might extend gains.
Important Takeaways for Gold and WTI Crude Oil Price Analysis Today
- The gold price started a fresh surge and traded above $3,330.
- A key bullish trend line is forming with support at $3,350 on the hourly chart of gold at FXOpen.
- WTI Crude Oil price started a decent increase above the $66.60 resistance levels.
- There was a break above a connecting bearish trend line with resistance at $67.15 on the hourly chart of XTI/USD at FXOpen.
Gold Price Technical Analysis
On the hourly chart of Gold at FXOpen, the price formed a base near the $3,280 zone. The price started a steady increase above the $3,330 and $3,350 resistance levels.
There was a decent move above the 50-hour simple moving average and $3,360. The bulls pushed the price above the $3,365 resistance zone. A high was formed near $3,373 and the price is now consolidating.
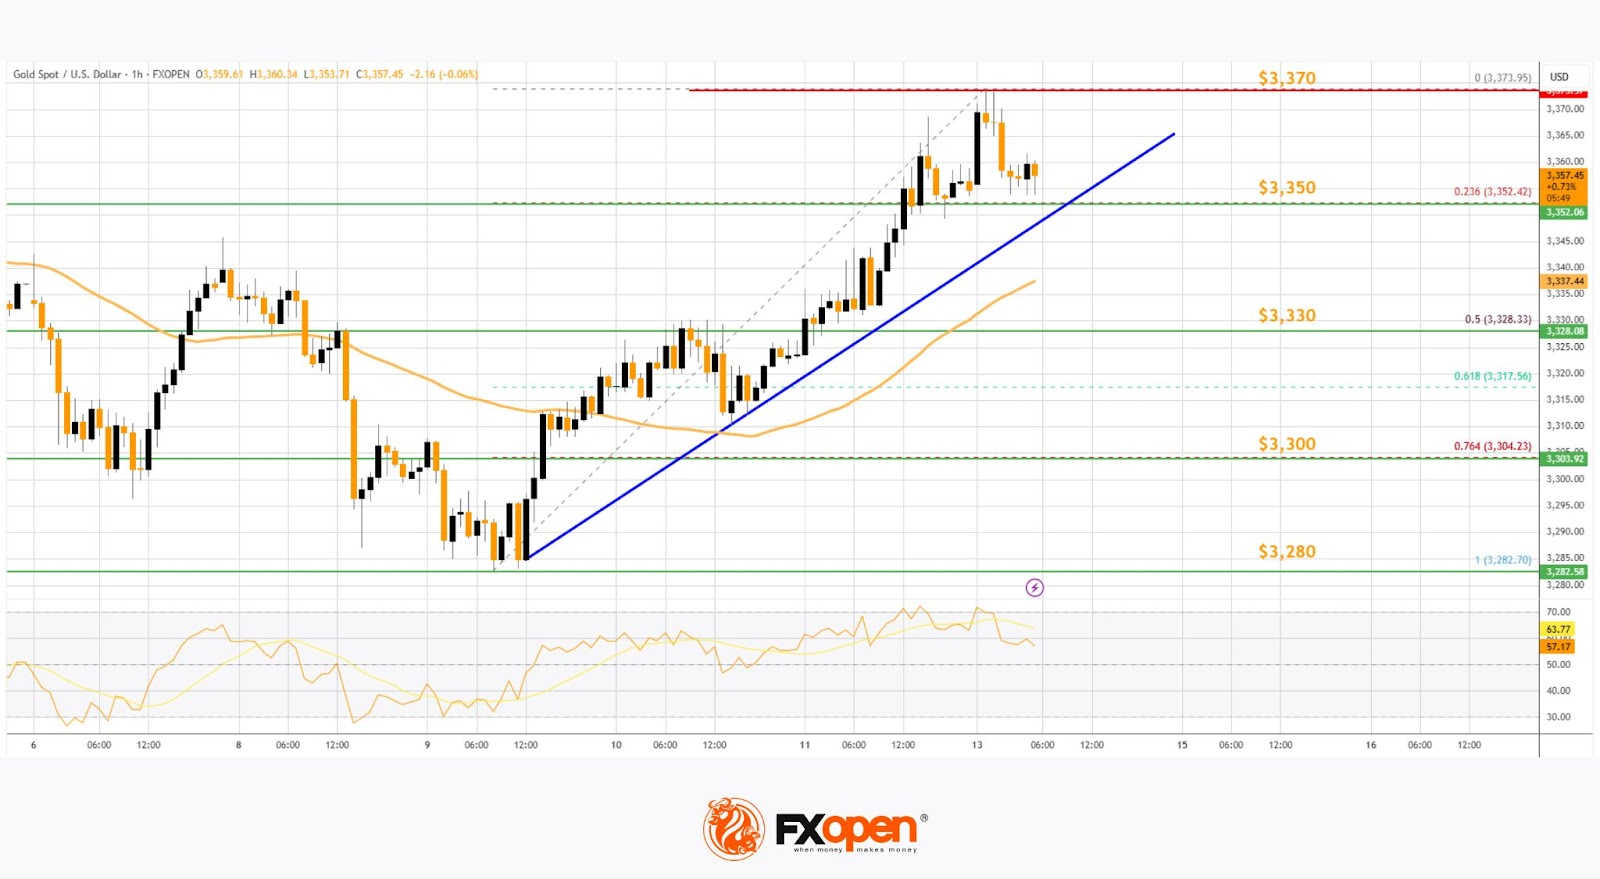
On the downside, immediate support is near the $3,350 level and the 23.6% Fib retracement level of the upward move from the $3,282 swing low to the $3,373 high.
Besides, there is a key bullish trend line forming with support at $3,350. The next major support sits at $3,330 and the 50% Fib retracement level.
A downside break below the $3,330 support might send the price toward $3,300. Any more losses might send the price toward the $3,280 support zone.
Immediate resistance is near the $3,370 level. The next major resistance is near $3,380. An upside break above $3,380 could send Gold price toward $3,400. Any more gains may perhaps set the pace for an increase toward the $3,420 level.
Oil Price Technical Analysis
On the hourly chart of WTI Crude Oil at FXOpen, the price started a decent upward move from $65.50. The price gained bullish momentum after it broke the $66.50 resistance and the 50-hour simple moving average.
The bulls pushed the price above the $67.00 and $67.50 resistance levels. There was a break above a connecting bearish trend line with resistance at $67.15.
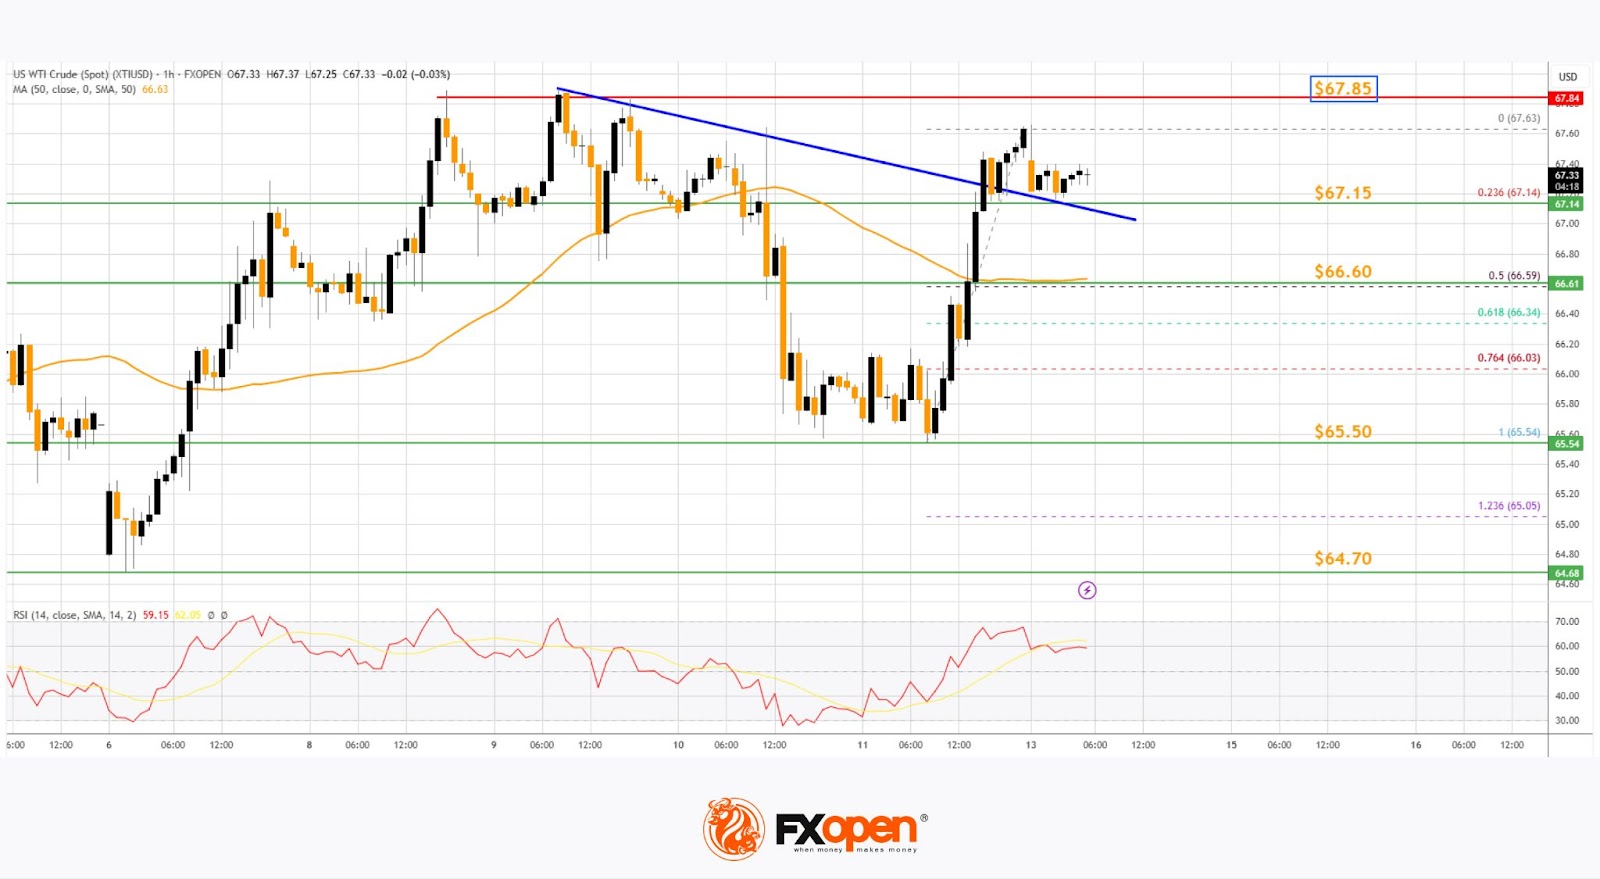
The recent high was formed at $67.63 and the price started a downside correction. There was a minor move toward the 23.6% Fib retracement level of the upward move from the $65.54 swing low to the $67.63 high.
The RSI is now above the 60 level. Immediate support on the downside is near the $67.15 zone. The next major support on the WTI Crude Oil chart is near the $66.60 zone or the 50% Fib retracement level, below which the price could test the $65.50 level. If there is a downside break, the price might decline toward $64.70. Any more losses may perhaps open the doors for a move toward the $63.50 support zone.
If the price climbs higher again, it could face resistance near $67.85. The next major resistance is near the $70.00 level. Any more gains might send the price toward the $72.50 level.
Start trading commodity CFDs with tight spreads. Open your trading account now or learn more about trading commodity CFDs with FXOpen.
This article represents the opinion of the Companies operating under the FXOpen brand only. It is not to be construed as an offer, solicitation, or recommendation with respect to products and services provided by the Companies operating under the FXOpen brand, nor is it to be considered financial advice.
USD/JPY Extends Gains as Market Monitors US Tariff Policy
The USD/JPY pair climbed to 147.42 on Monday. Early in the session, the yen staged a partial recovery from last week’s losses amid heightened global trade risks, but the rebound proved short-lived as the currency resumed its downward trajectory.
Former US President Donald Trump announced plans to impose 30% tariffs on imports from the EU and Mexico, effective from 1 August. In response, officials from both the EU and Mexico signalled their willingness to engage in further negotiations with the US administration, hoping to secure more favourable terms.
Meanwhile, the EU is broadening consultations with other nations affected by the tariffs, including Canada and Japan, potentially paving the way for a coordinated response.
Domestic data from Japan revealed that core machinery orders fell by 0.6% in May (month-on-month), reaching ¥913.5 billion. While still negative, the figure outperformed expectations of a 1.5% decline and marked a notable improvement over April’s steep 9.1% drop.
With a busy week ahead, further volatility in USD/JPY is anticipated.
Technical Analysis: USD/JPY
H4 Chart:
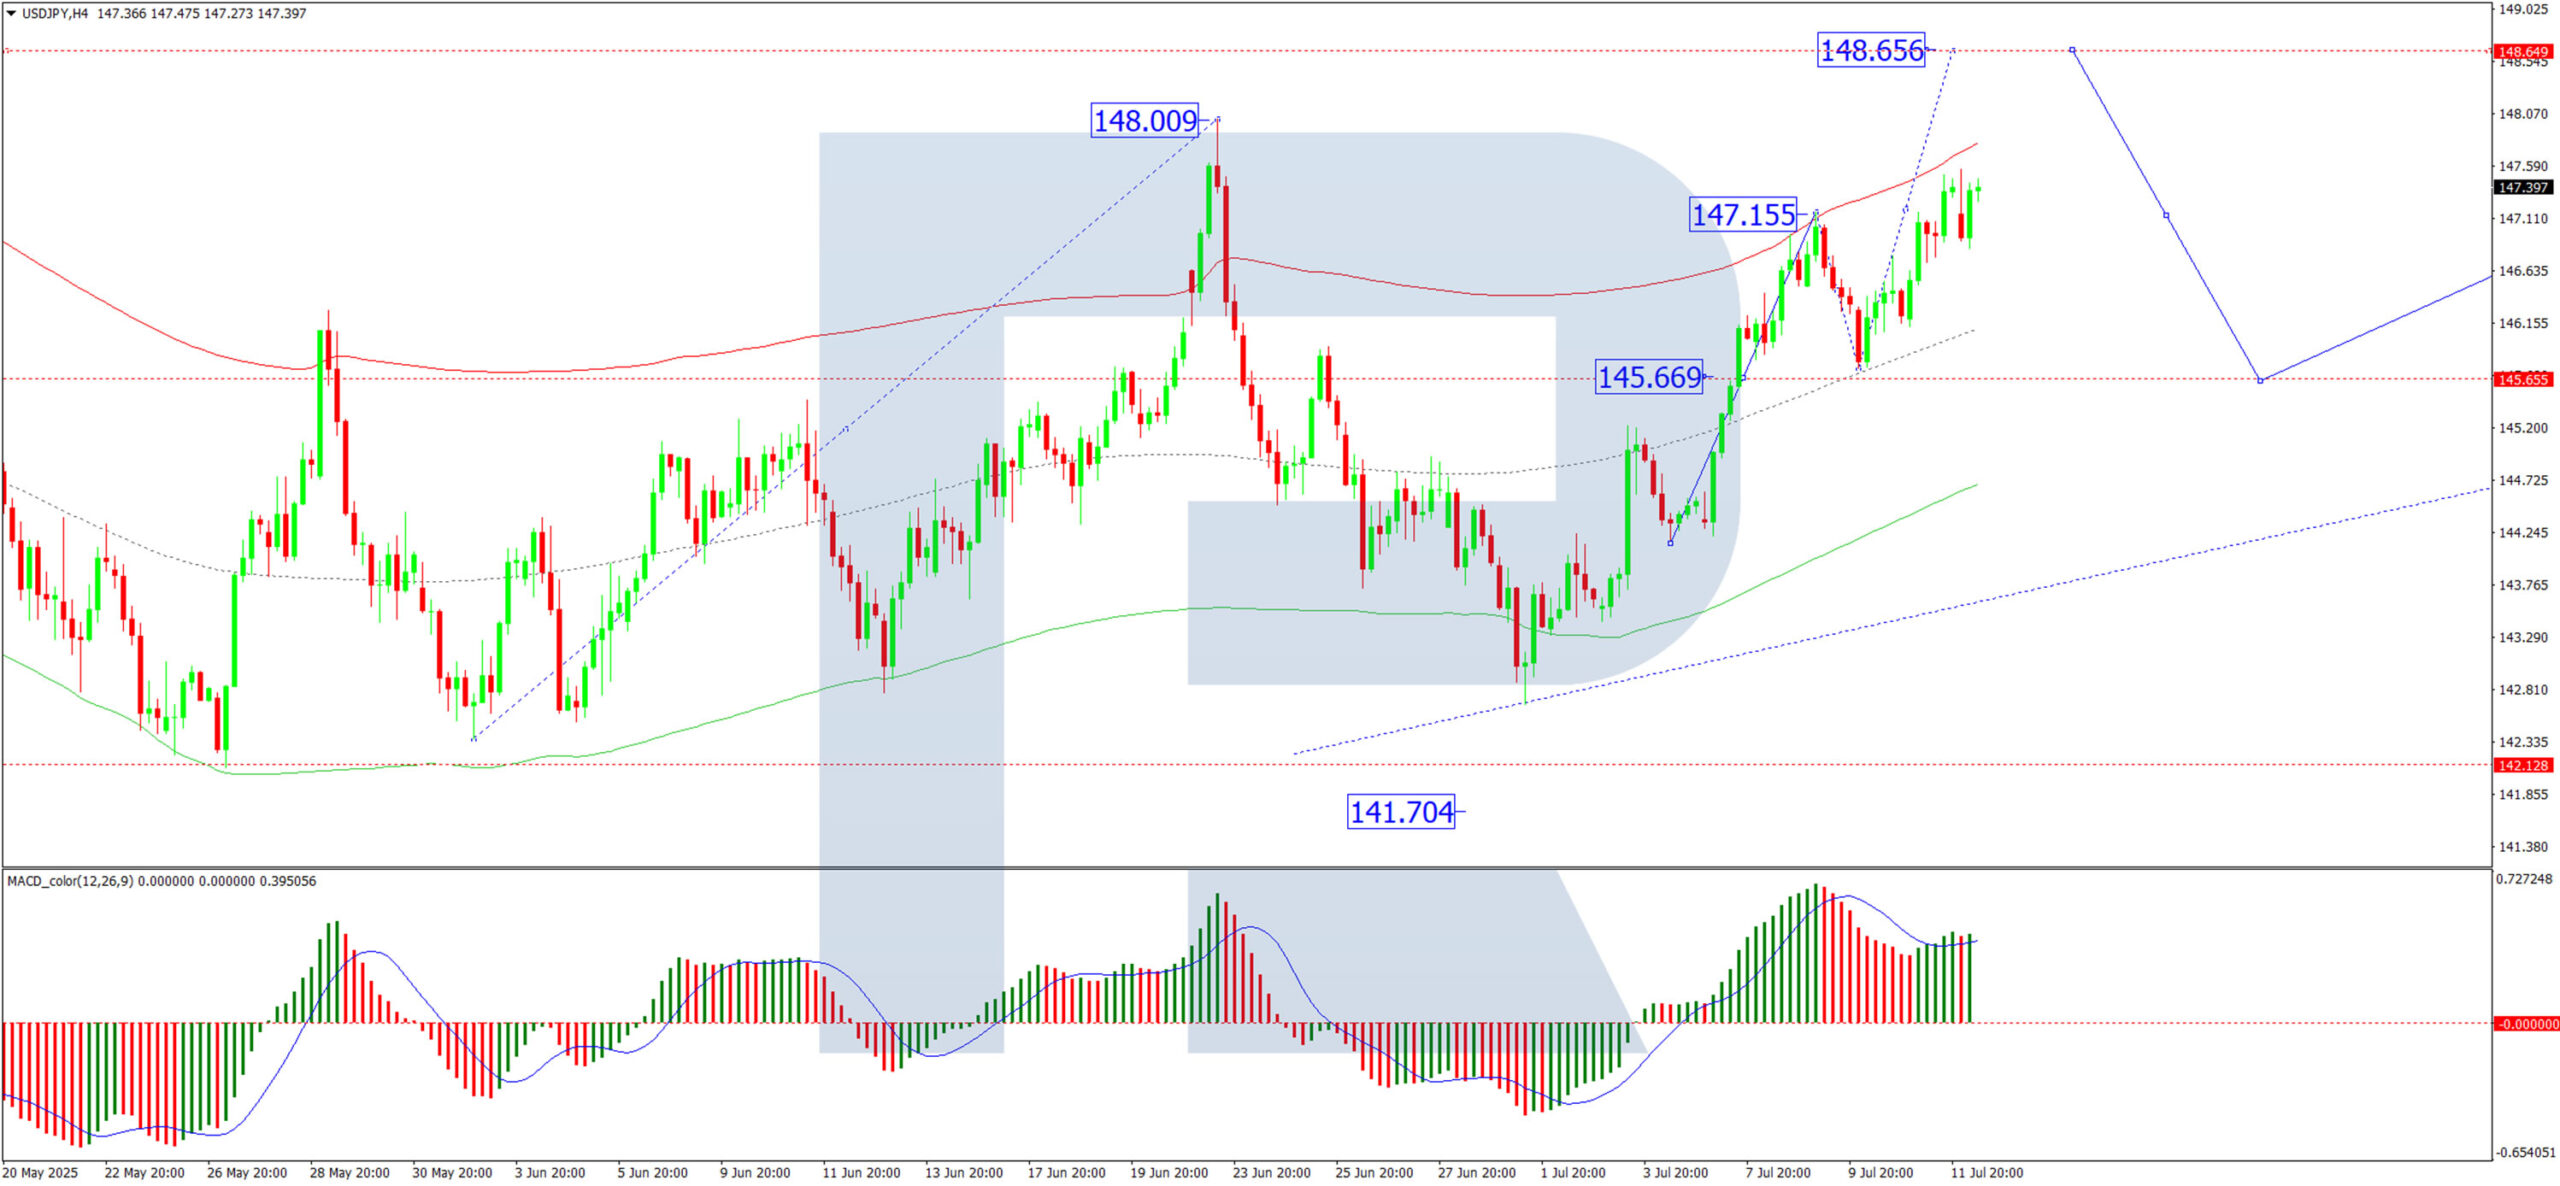
On the H4 chart, USD/JPY continues to advance within the third wave of its corrective movement towards 148.65. Today, we expect the pair to test this level before a potential pullback to 145.65 (testing from above). Subsequently, another upward wave could materialise, targeting at least 150.66. This scenario is supported by the MACD indicator, where the signal line remains above zero and points firmly upward.
H1 Chart:
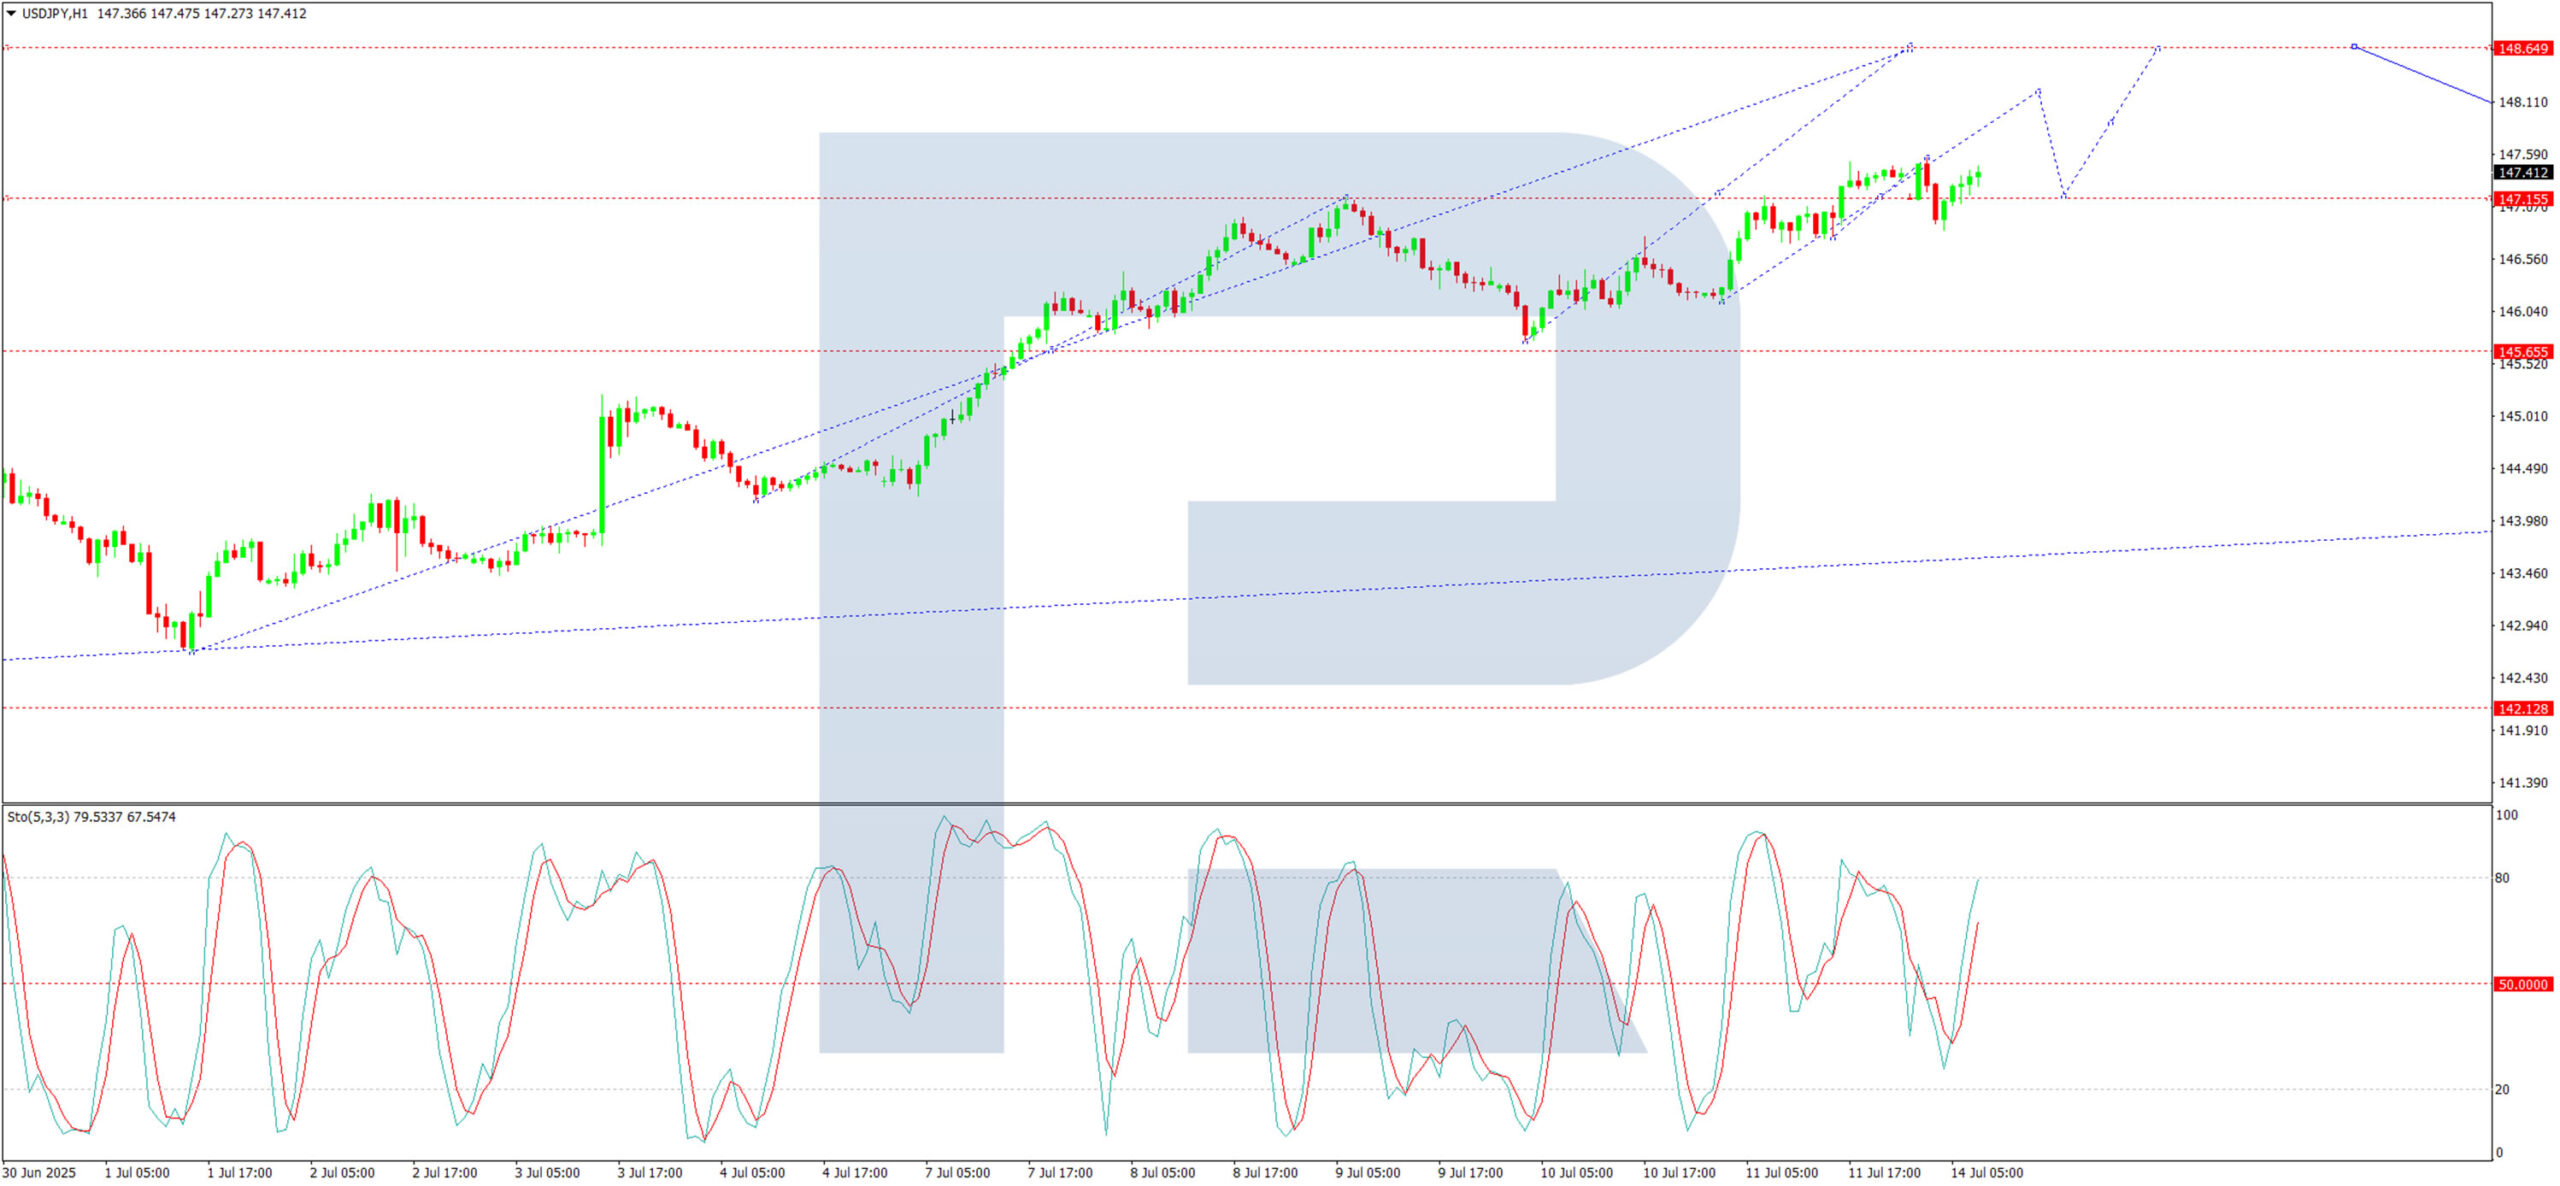
The H1 chart shows the pair consolidating around 147.17, with the current structure suggesting further upside towards 148.65. Today, we anticipate an initial push to 148.18, followed by a retracement to 147.17, before another rise towards 148.65. The Stochastic oscillator corroborates this outlook, with its signal line positioned at 50 and trending upward.
Conclusion
The USD/JPY pair remains on an upward trajectory, supported by trade policy uncertainties and technical bullish signals. Traders should prepare for potential swings as the market digests incoming economic and political developments.
Asia Stocks Rally on China, Singapore Data; US Futures Dip on Trump’s EU Tariff Threat & Gold Shines
Major US stock indices extended their losses from last Friday into today’s Asian session. Both S&P 500 and Nasdaq 100 E-mini futures dropped by 0.5% at the time of writing, weighed down by renewed tariff anxieties. US President Trump issued a surprise escalation, threatening the European Union with a 30% tariff—an increase from April’s proposed 20%, if no improved trade terms are reached before the 1 August deadline.
This move follows a series of aggressive tariff demand letters sent to US trading partners over the past week. Hopes for a preliminary US-EU trade deal were dashed after recent media reports hinted at progress, only for negotiations to hit fresh roadblocks. Germany’s DAX reflected this disappointment with a second straight loss of 0.8% last Friday.
Asia stocks resilient on strong China, Singapore data
Despite Trump’s latest tariff salvo, Asia Pacific stock markets remained broadly resilient, supported by upbeat economic data from China and Singapore.
Hong Kong’s Hang Seng Index posted a third consecutive gain, rising 0.4% intraday as it rebounded from its 20-day moving average, now acting as support near 24,050. Singapore’s Straits Times Index (STI), known for its defensive and dividend-yielding components, rallied 0.4%, approaching the psychological 4,100 level. It’s on track for a sixth consecutive record close. In contrast, Japan’s Nikkei 225 slipped 0.2%, while Australia’s ASX 200 remained flat.
China and Singapore surprise to the upside in key data
China’s June exports rose 5.8% year-on-year to US$325 billion, beating expectations (consensus: 5%). The growth was driven by manufacturers shifting focus to alternative markets amid the ongoing trade friction with the US. Notably, exports to 10 South Asian countries surged by 17% year-on-year.
Singapore also exceeded expectations. Its Q2 GDP grew by 1.4% quarter-on-quarter (seasonally adjusted), beating forecasts of 0.7%, and reversing Q1’s revised 0.5% contraction—helping the city-state avoid a technical recession.
Gold rebounds on safe-haven demand amid tariff tensions
Gold (XAU/USD) regained momentum last Friday, rallying 0.9% to a three-week high and moving back above its 20-day and 50-day moving averages. Safe-haven demand has resurfaced, particularly after gold’s recent underperformance relative to silver.
In today’s Asia session, the precious metal edged up another 0.1%, testing the key intermediate resistance at US$3,360. It briefly hit an intraday high of US$3,374. Technical signals remain constructive, and a daily close above US$3,360 could confirm a new bullish phase over the next several sessions.
Economic data releases
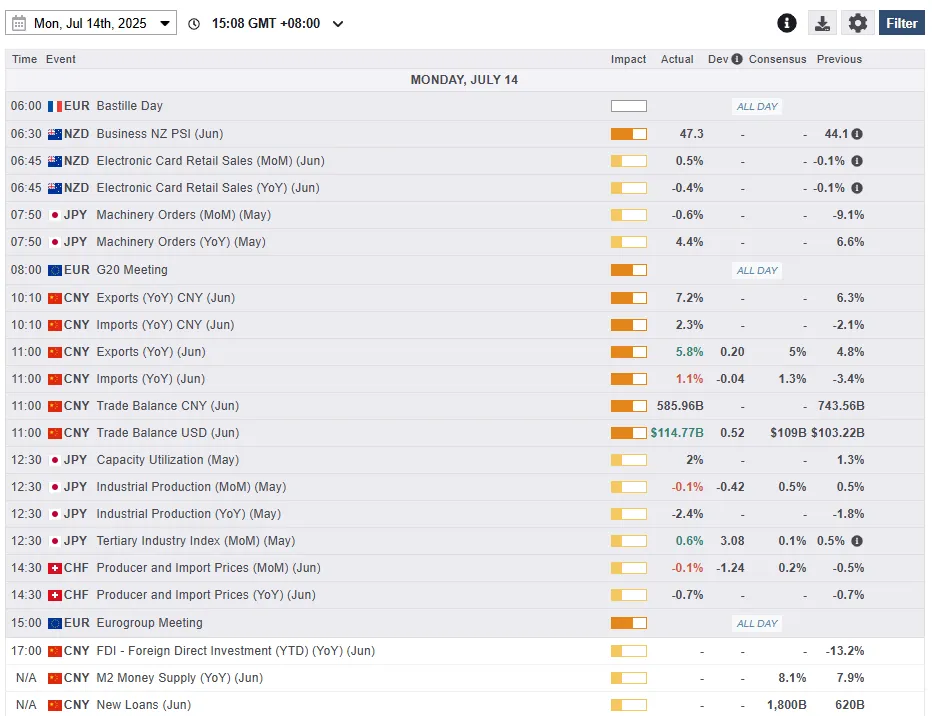
Fig 1: Key data for today’s Asia mid-session (Source: MarketPulse)
Chart of the day – Gold (XAU/USD) looks set for a potential minor bullish breakout
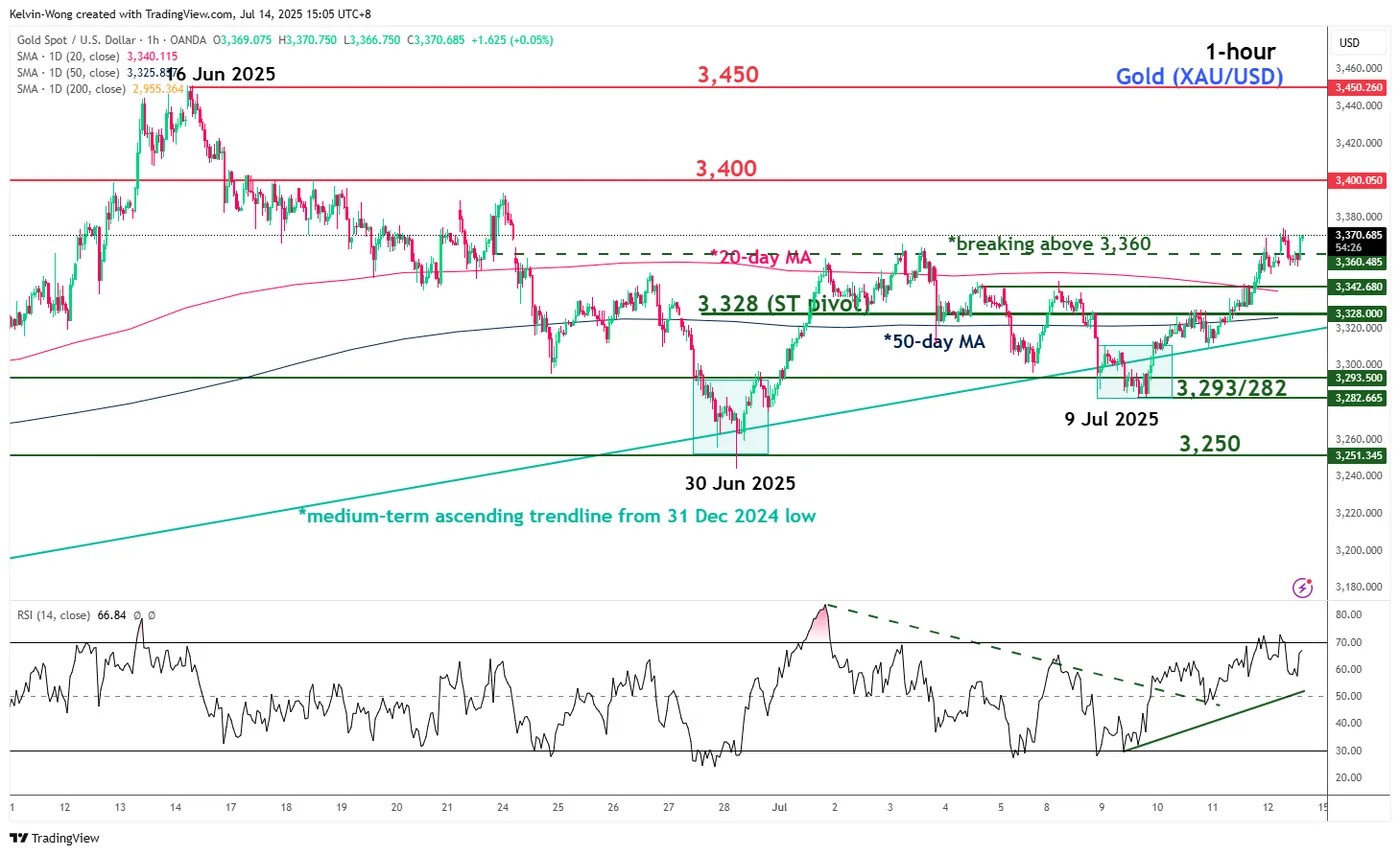
Fig 2: Gold (XAU/USD) minor trend as of 14 July 2025 (Source: TradingView)
Recent price actions of Gold (XAU/USD) have managed to retest and stage a rebound from its medium-term ascending trendline in place since the 31 December 2024 low.
It has formed a minor “Double Bottom” bullish reversal configuration, taking into account the two swing lows of 30 June and 9 July. Right now, Gold (XAU/USD) is breaking above the US$3,360 intermediate neckline resistance of the minor “Double Bottom” configuration (see Fig 2)
In addition, the hourly RSI momentum indicator has continued to flash a bullish momentum condition. Watch the US$3,328 key short-term pivotal support (also the 50-day moving average) for the next intermediate resistances to come in at US$3,400 and US$3,450 in the first step.
On the other hand, a break below US$3,328 negates the bullish tone for another choppy minor corrective decline sequence to expose the next intermediate support at US$3,293/3,282.
Bitcoin Price Surpasses $120K for the First Time: What’s Next?
Last week, while analysing the potential for a new all-time high in Bitcoin’s price, we highlighted that the amount of BTC held on cryptocurrency exchanges had dropped to its lowest level in months. This dynamic creates the potential for accelerated price growth should a wave of buyers – including institutional participants – enter the market.
It appears this may help explain the sharp rally in BTC/USD, which surged by over 12% in the past seven days, breaking through the key psychological resistance level of $120K for the first time in history.
Market sentiment is being further bolstered by US Crypto Week, which kicks off today. How might the situation develop from here?
BTC/USD Technical Analysis
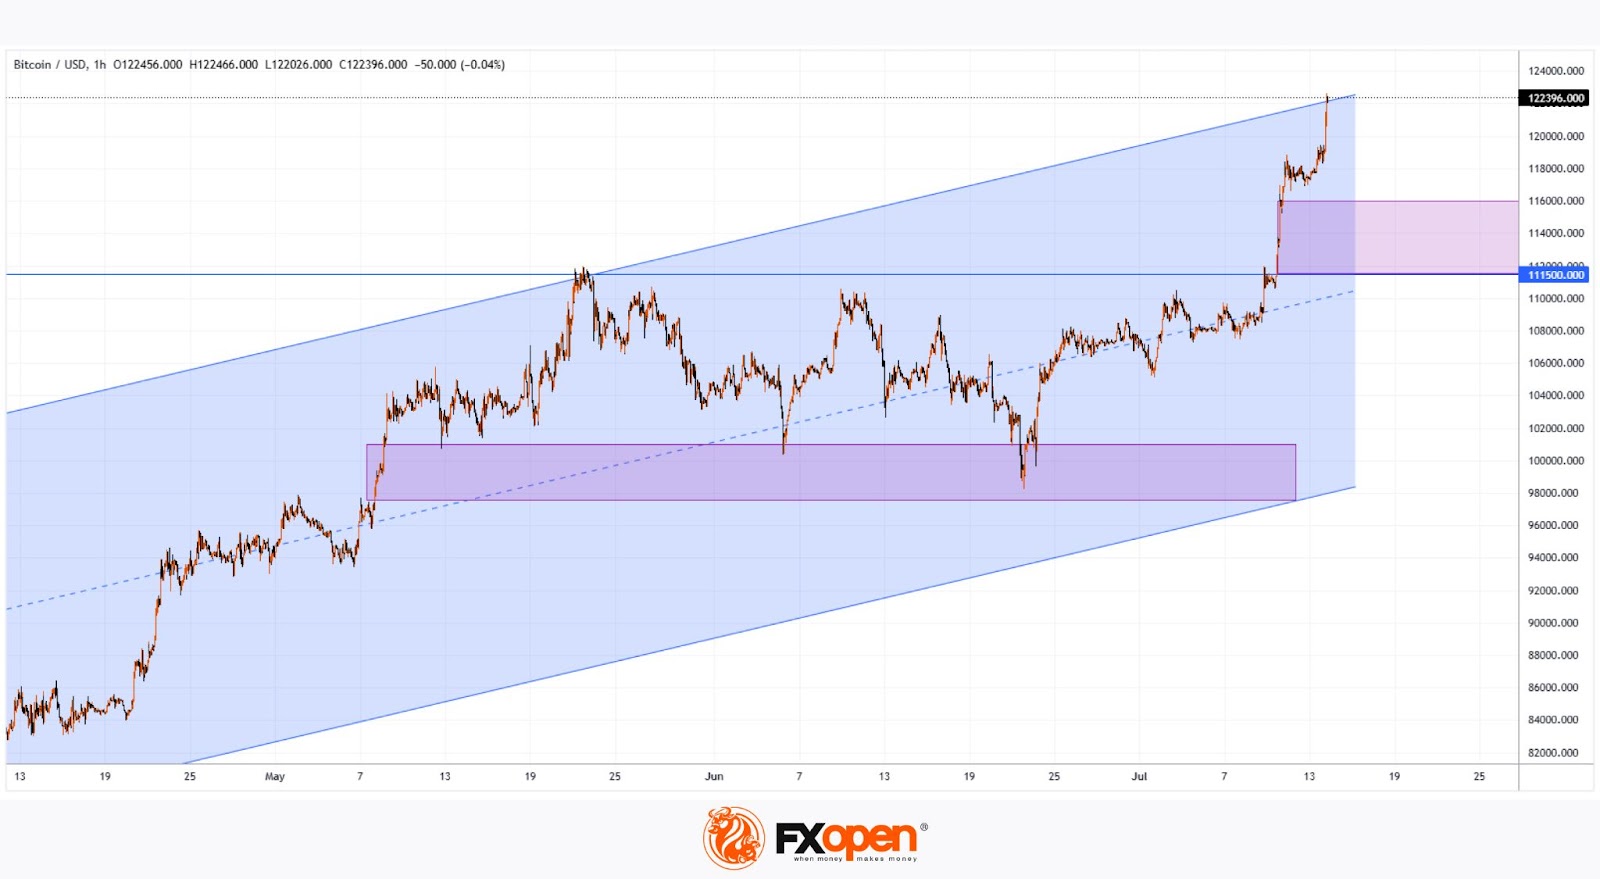
Over the past three months, Bitcoin’s price action has been forming an ascending channel (highlighted in blue), with the current BTC/USD rate sitting near its upper boundary. Most, if not all, oscillators added to the chart would now indicate strong overbought conditions.
Given this setup, it is reasonable to assume that the market is vulnerable to a potential pullback. However, such a correction is unlikely to lead to a fundamental shift in sentiment.
We may see a repeat of the price pattern observed in May–June:
- Price consolidates near the midline of the channel;
- Bulls break out, pushing the price toward the upper boundary and creating a zone of imbalance (Fair Value Gap in the Smart Money Concept) – highlighted with a purple rectangle;
- Price retests the imbalance zone following a rejection from the upper channel boundary.
It is worth noting that the current zone is further supported from below by the $111.5K level, which previously acted as a significant resistance. As long as Bitcoin’s price remains above this threshold, any short-selling strategies may carry elevated risk.
FXOpen offers the world's most popular cryptocurrency CFDs*, including Bitcoin and Ethereum. Floating spreads, 1:2 leverage — at your service. Open your trading account now or learn more about crypto CFD trading with FXOpen.
*Important: At FXOpen UK, Cryptocurrency trading via CFDs is only available to our Professional clients. They are not available for trading by Retail clients. To find out more information about how this may affect you, please get in touch with our team.
This article represents the opinion of the Companies operating under the FXOpen brand only. It is not to be construed as an offer, solicitation, or recommendation with respect to products and services provided by the Companies operating under the FXOpen brand, nor is it to be considered financial advice.
EUR/USD Daily Outlook
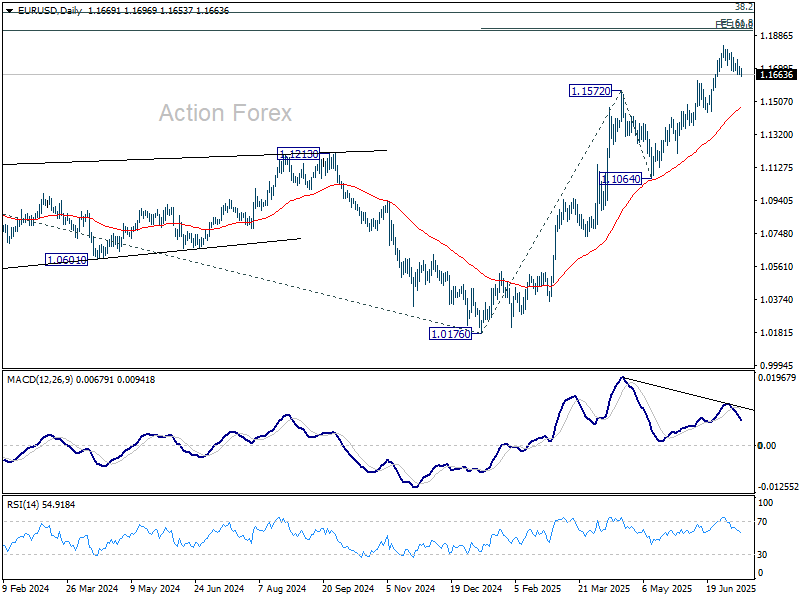
Daily Pivots: (S1) 1.1665; (P) 1.1690; (R1) 1.1714; More...
Intraday bias in EUR/USD remains neutral for the moment. Correction from 1.1829 is in progress but downside should be 1.1630 resistance turned support to bring rebound. Firm break of 1.1829 will resume the rise from 1.0176 and target 61.8% projection of 1.0176 to 1.1572 from 1.1064 at 1.1927. However, sustained break of 1.1630 will bring deeper fall to 55 D EMA (now at 1.1474) instead.
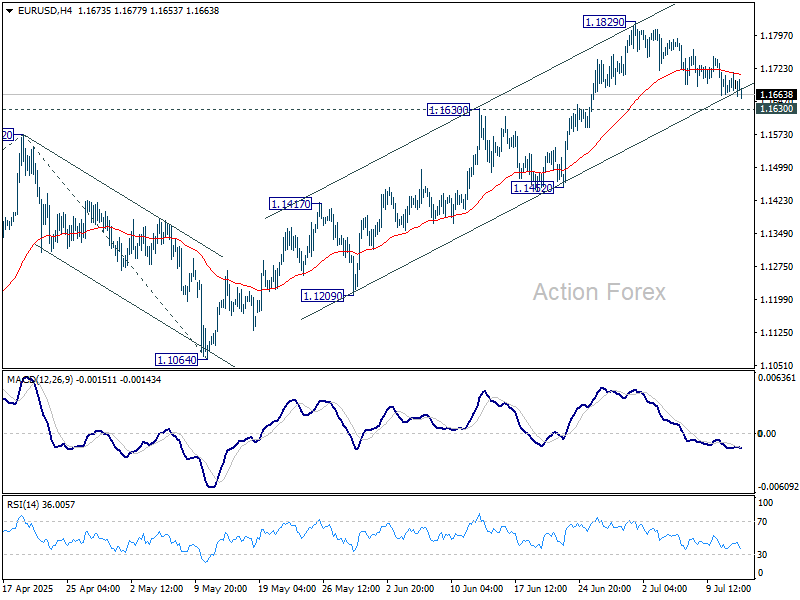
In the bigger picture, rise from 0.9534 long term bottom could be correcting the multi-decade downtrend or the start of a long term up trend. In either case, further rise should be seen to 100% projection of 0.9534 to 1.1274 from 1.0176 at 1.1916. This will now remain the favored case as long as 1.1604 support holds.
USD/JPY Daily Outlook
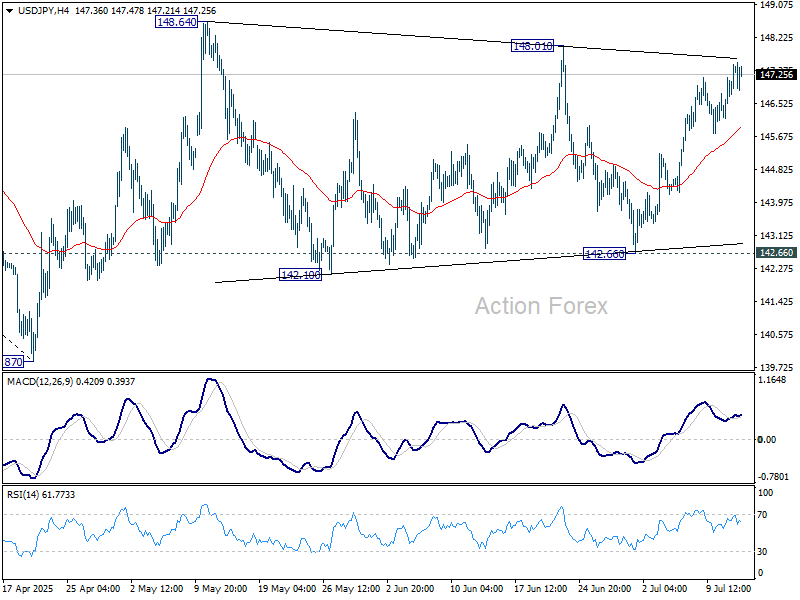
Daily Pivots: (S1) 146.53; (P) 147.03; (R1) 147.91; More...
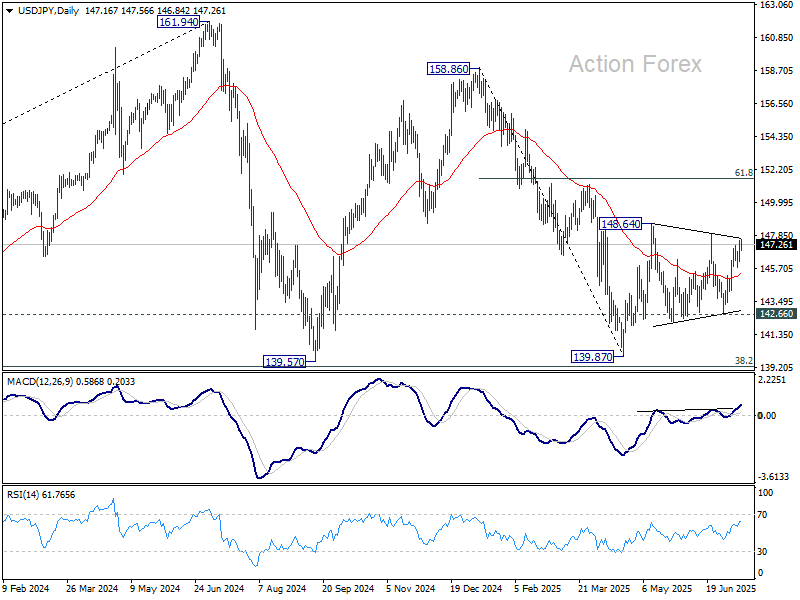
Focus is now on 148.01 resistance as rebound from 142.66 extends. Firm break there will indicate that consolidations pattern from 148.64 has completed. Further rise should then be seen to resume the rally from 139.87, to 61.8% retracement of 158.86 to 139.87 at 151.22.
In the bigger picture, price actions from 161.94 (2024 high) are seen as a corrective pattern to rise from 102.58 (2021 low). There is no clear sign that the pattern has completed yet. But still, strong support is expected from 38.2% retracement of 102.58 to 161.94 at 139.26 to bring rebound.
GBP/USD Daily Outlook
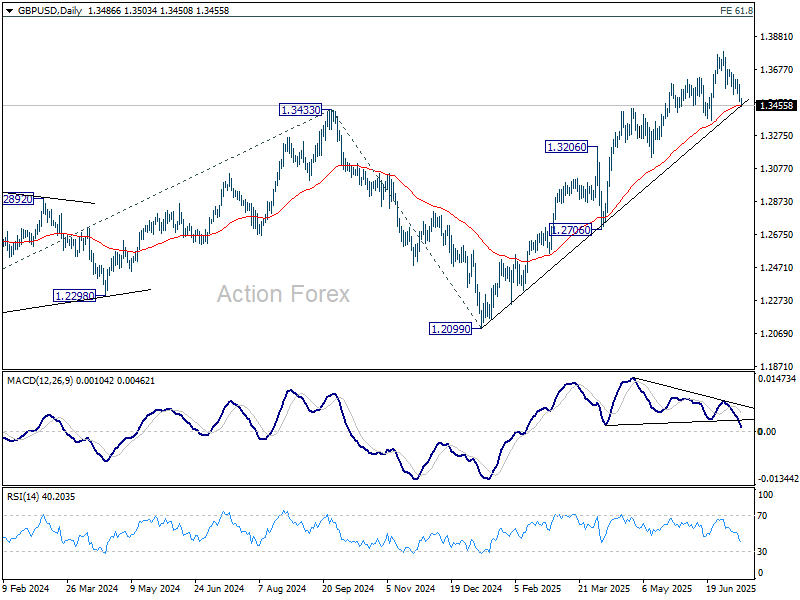
Daily Pivots: (S1) 1.3454; (P) 1.3520; (R1) 1.3559; More...
GBP/USD's pullback from 1.3787 extends lower today and deeper fall could be seen. But downside is expected to be contained by 1.3369 support to bring rebound. On the upside, above 1.3680 minor resistance will bring retest of 1.3787. Firm break of 1.3787 will resume larger up trend to 100% projection of 1.2099 to 1.3206 from 1.3138 at 1.3813. However, firm break of 1.3369 will bring deeper correction back to 1.2706/3206 support zone.
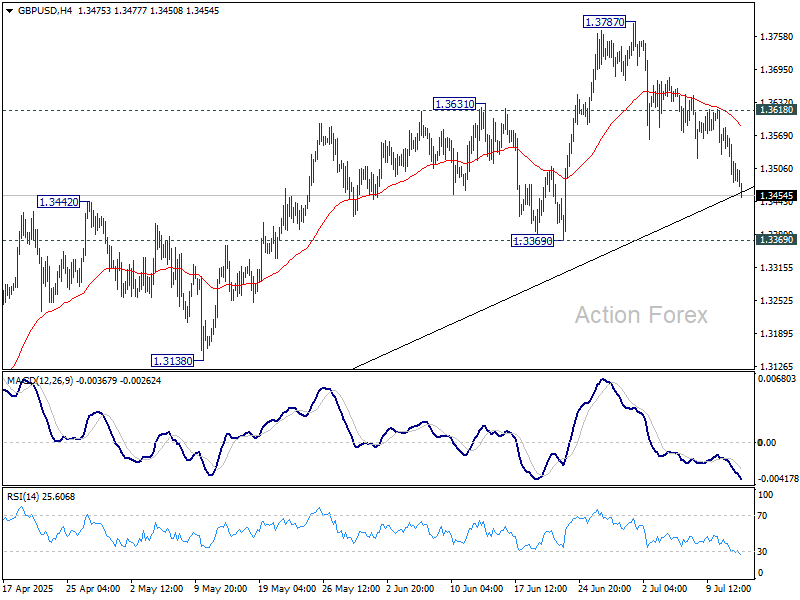
In the bigger picture, up trend from 1.3051 (2022 low) is in progress. Next medium term target is 61.8% projection of 1.0351 to 1.3433 from 1.2099 at 1.4004. Outlook will now stay bullish as long as 55 W EMA (now at 1.3019) holds, even in case of deep pullback.
USD/CHF Daily Outlook
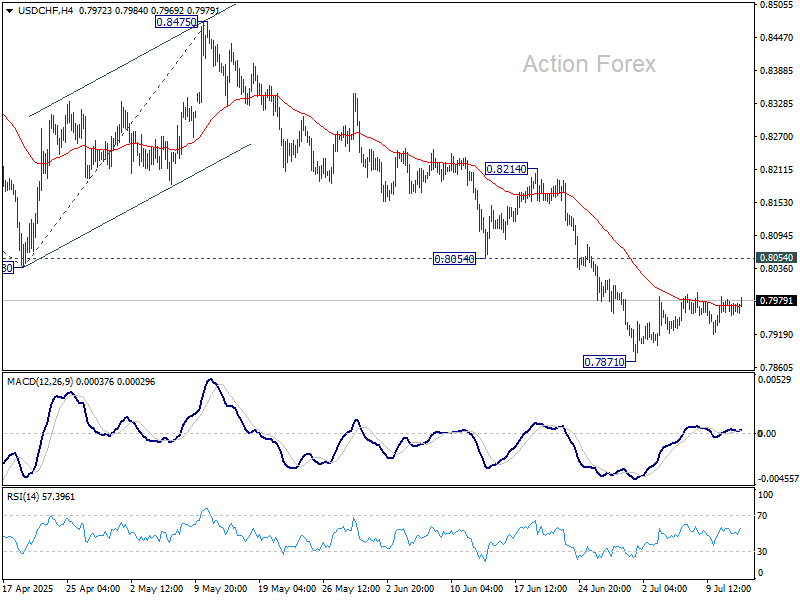
Daily Pivots: (S1) 0.7953; (P) 0.7968; (R1) 0.7981; More….
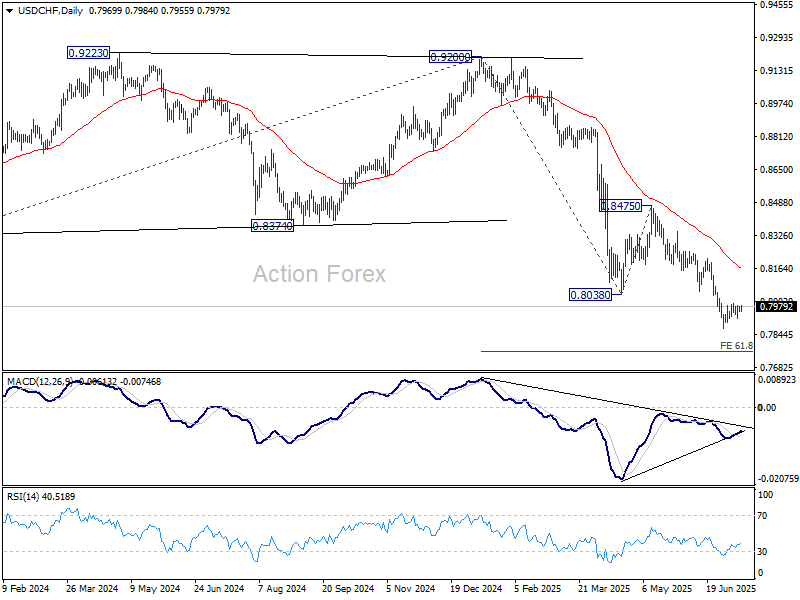
Intraday bias in USD/CHF remains neutral as consolidations continues above 0.7871. Stronger recovery might be seen but upside should be limited by 0.8054 support turned resistance. On the downside, firm break of 0.7871 will extend the larger down trend to 61.8% projection of 0.9200 to 0.8038 from 0.8475 at 0.7757.
In the bigger picture, long term down trend from 1.0342 (2017 high) is still in progress. Next target is 100% projection of 1.0146 (2022 high) to 0.8332 from 0.9200 at 0.7382. In any case, outlook will stay bearish as long as 0.8475 resistance holds.
Market Reaction to Tomorrow’s US Inflation Numbers Might be a Point in Case,
Markets
US Treasuries sold off in a steepening move last Friday as the US informed more countries on the reciprocal tariff rate that would apply to them unless they secured a trade deal by August 1st. Mexico and Canada for example, which were exempt on Liberation Day, now face reciprocal charges of respectively 30% and 35%. US yields rose by 1.4 bps (2-yr) to 8 bps (30-yr) on a daily basis with the 30-yr tenor (4.97% this morning) dangerously close to piercing the psychological 5% barrier. The YtD high is situated at 5.15% and the short term direction of travel as stagflation vibes return. The market reaction to tomorrow’s US (June) inflation numbers might be a point in case, especially should we see an upward surprise. Friday’s sell-off was limited to US Treasuries (bonds in general) and contrasted with the sell America trade seen earlier this year. US stock markets corrected only 0.2%-0.6% while the trade-weighted dollar added slightly to this month’s gentle recovery. We warn against reading too much into this as (anti-US) sentiment could return quickly. Equity markets look more vulnerable than the US dollar given rather dovish Fed-positioning, rising inflation risks and with currencies from US trading partners vulnerable to negative growth risks. Over the weekend, the US also informed the EU that the tariff level would be set at 30% (instead of the 20% announced early April). Negotiations between the two remain ongoing with the EU in a first reaction backing down from retaliation (which according to the US letter would be matched one-on-one on top of the 30% rate). Simultaneously, the EU is stepping up its efforts to side with other countries hit by US tariffs, looking to deepen trade agreements.
Today’s empty eco calendar puts the spotlight on bear steepening trends in global bond markets. The Japanese 30-yr bond yield for example adds 10 bps this morning, coming with 3 bps of the 3.2% YtD high. Bonds and stock markets might sell-off in lockstep given the short window of time before reciprocal tariffs kick in.
News & Views
Both rating agencies Fitch and S&P raised the credit rating of Bulgaria to BBB+ from BBB (stable outlook). The rating upgrade comes after the ECOFIN council on July 8 approved the country’s application to adopt the euro on January 1st, 2026. Amongst others, Fitch mentions it will strengthen the monetary policy framework, reduce transaction costs, eliminate exchange-rate risk to corporate and household balance sheets and open up additional external funding options. Bulgarian banks will also have access to the ECB's liquidity facilities. Bulgaria's ratings are supported by its strong external and public finance balance sheets versus 'BBB' peers. Even as Fitch sees the debt-to GDP ratio increasing from 24.1% in 2024 to 34.7% in 2029, amongst others due to higher defense spending, it remains among the lowest in the BBB category. S&P also refers to the positive factors of policy support from joining the EU and removing residual FX risk, even as it admits that ECB policies likely align more with the cycles of larger members than Bulgaria.
Uncertainty on the business outlook and budget constraints led UK companies to reduce their hiring activity again in June, according to the KPMG and REC Jobs survey complied by S&P. The survey of recruitment consultancies signals an accelerated decline in hiring activity across the UK at the end of Q2. Permanent placements dropped at the fastest pace in 22 months. Temporary billings decreased at the fastest pace since February on a reduced confidence on the outlook with worries over higher costs. Supply of labour expanded at the steepest pace since November 2020. On the demand side, the survey sees a steeper decline in overall vacancies, especially in permanent vacancies. Lower demand for workers, tighter budgets and improvements in candidate supplies also have dampened wage growth. The survey indicates staring salaries and temporary wages to have increased at a pace notably weaker than historical trends. However, analysis of REC and KPMG executives on the survey outcome overall sounds a bit more balanced in particular on the outlook, especially if the government would be able to deliver on clear commitments and provide transparency on its (Labor) policy.
More Tariffs
Donald Trump continued his tariff reveals over the weekend, announcing that the EU and Mexico would be hit with 30% tariffs from August 1st. That’s far more than what the EU expected — they were hoping for a figure closer to what the UK secured: a 10% tariff, with exceptions for key sectors like metals and pharmaceuticals. Instead, they got a big, fat 30%.
Trump did leave the door open for further negotiations and some fine-tuning, but given the level of tariffs unveiled since last week, you have to wonder whether it’s worth the time and energy to negotiate with a government that appears to have lost the plot — or if it's better to pursue other deals with other nations. That’s what the Europeans are now discussing: finding new friends.
So, US and European futures are in the red this morning. DAX futures are the hardest hit as of writing — down 0.60%, while FTSE futures are flat. It’s becoming increasingly clear that the UK will be one of the rare privileged partners to retain 10% tariff access to US markets. But even that doesn’t seem to help much.
Friday’s UK production and growth figures were weak: GDP declined for the second month, and both industrial and manufacturing production dropped more than expected, dragged down by rising energy prices, property taxes, and trade uncertainty. This sent Cable below the 1.35 level, which also coincides with the 50-day moving average. Trend and momentum indicators in sterling remain firmly negative, reflecting weakening growth expectations and a shrinking fiscal headroom — pointing to higher taxes and lower spending, both of which are growth-negative. As such, the EURGBP is also marching higher, targeting the 88–89 cents range in the next three months.
Zooming out, the US dollar starts the week weaker, with renewed trade tensions limiting dollar appetite. However, the USDJPY is pushing higher, as political uncertainty in Japan is weighing more heavily than dollar softness. Japanese yields are once again under solid upside pressure this morning ahead of Sunday’s Upper House elections. Investors worry that if the LDP retains its majority, it will proceed with ample fiscal spending to support the economy, including a possible consumption tax cut. Remember, the Japanese pension funds and insurers are among the biggest buyers of US Treasuries, and rising Japanese yields could encourage them to repatriate funds back to Japan, potentially impacting global flows and causing volatility in global bond and stock markets.
In China, the new week begins with some encouraging data: exports rose 5.8% in May, beating expectations of 5%, partly thanks to partial tariff relief with the US. The CSI 300 looks better, while the Hang Seng Index is approaching its 2025 highs. If China can leverage US weakness to repair global relations, it could be a win for Beijing.
“But note that tensions between the EU and China are rising, as Europeans accuse China of undermining their industries — because they can’t match Chinese prices. There is, of course, a structural reason: basic salaries on a Chinese production line range from $500–800/month, while a similar worker in Germany may earn €2,500–3,000, €1,000–1,500 in Southern Europe, and around €600 in Bulgaria. But lower labour costs often come with capacity constraints. China has earned its ‘factory of the world’ status over the last two to three decades, and shifting that dynamic — by reshoring jobs to Europe or the US — would dent Western purchasing power with a structurally higher inflation and also weaker central bank support.
Anyway, the EURUSD is slightly better bid this morning on the back of a softer dollar. Interestingly, 30% tariffs on EU goods should, in theory, dampen euro demand, but the dollar’s weakness is dominating the narrative for now — not euro strength.
Elsewhere, gold is no longer reacting positively to trade turmoil, while silver is catching up on dollar softness, trading at $39/oz. Meanwhile, Bitcoin is extending its rally to fresh records, pushing above $120K this morning. It’s now back in overbought territory, suggesting that a correction to the $105K–$110K range wouldn’t be surprising. Still, the rally is underpinned by a crypto-friendly US policy shift and growing emerging market adoption — both remain intact.
This week, investors will keep an eye on trade news and shift focus to earnings, with big US banks and Netflix reporting Q2 results. Meanwhile, US and UK inflation figures will offer more insight into how tariffs and fiscal policies are feeding into prices. It's shaping up to be a busy week.