

Sample Category Title
USD/JPY Mid-Day Outlook
Daily Pivots: (S1) 146.53; (P) 147.03; (R1) 147.91; More...
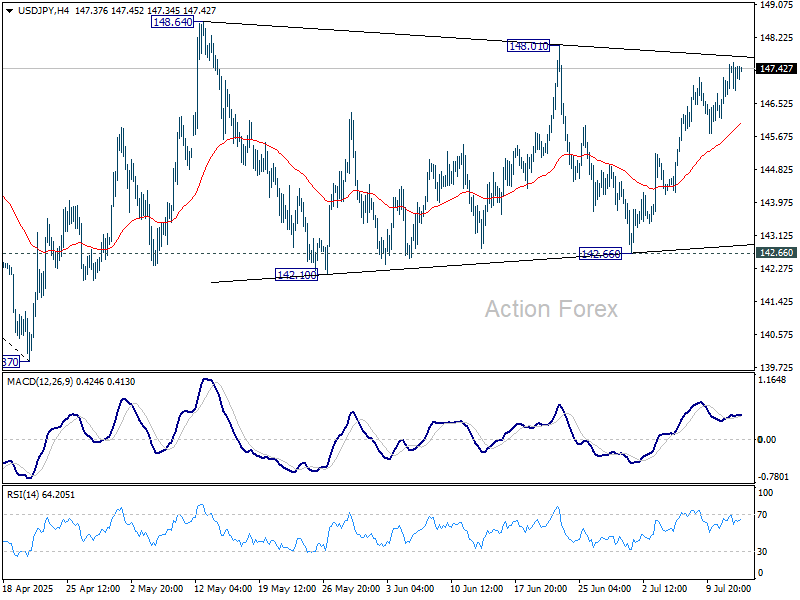
Intraday bias in USD/JPY stays neutral with focus on 148.01 resistance. Firm break there will indicate that consolidations pattern from 148.64 has completed. Further rise should then be seen to resume the rally from 139.87, to 61.8% retracement of 158.86 to 139.87 at 151.22.
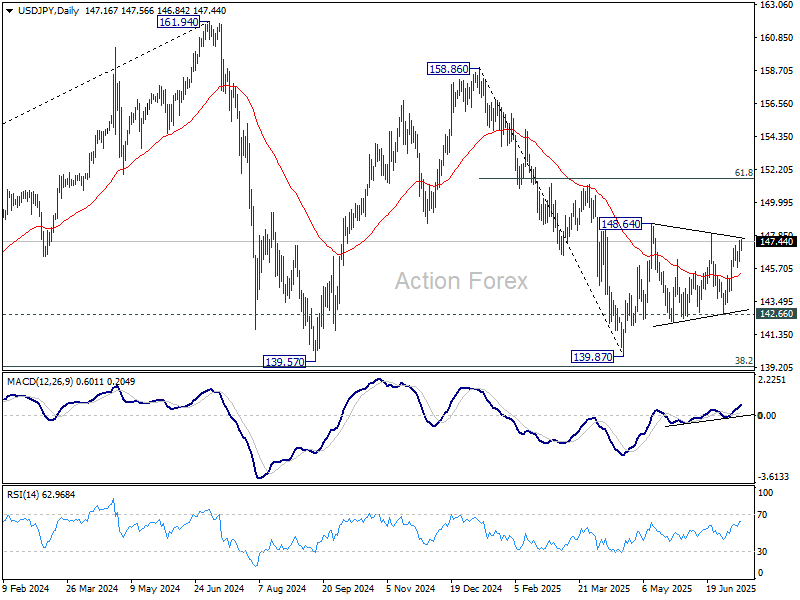
In the bigger picture, price actions from 161.94 (2024 high) are seen as a corrective pattern to rise from 102.58 (2021 low). There is no clear sign that the pattern has completed yet. But still, strong support is expected from 38.2% retracement of 102.58 to 161.94 at 139.26 to bring rebound.
USD/CHF Mid-Day Outlook
Daily Pivots: (S1) 0.7953; (P) 0.7968; (R1) 0.7981; More….
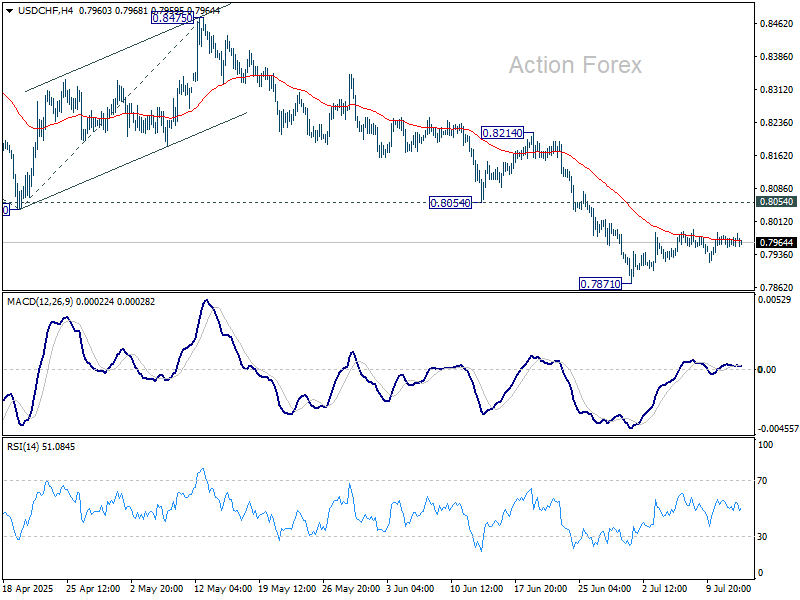
USD/CHF is still extending the consolidations from 0.7871 and intraday bias stays neutral. Stronger recovery might be seen but upside should be limited by 0.8054 support turned resistance. On the downside, firm break of 0.7871 will extend the larger down trend to 61.8% projection of 0.9200 to 0.8038 from 0.8475 at 0.7757.
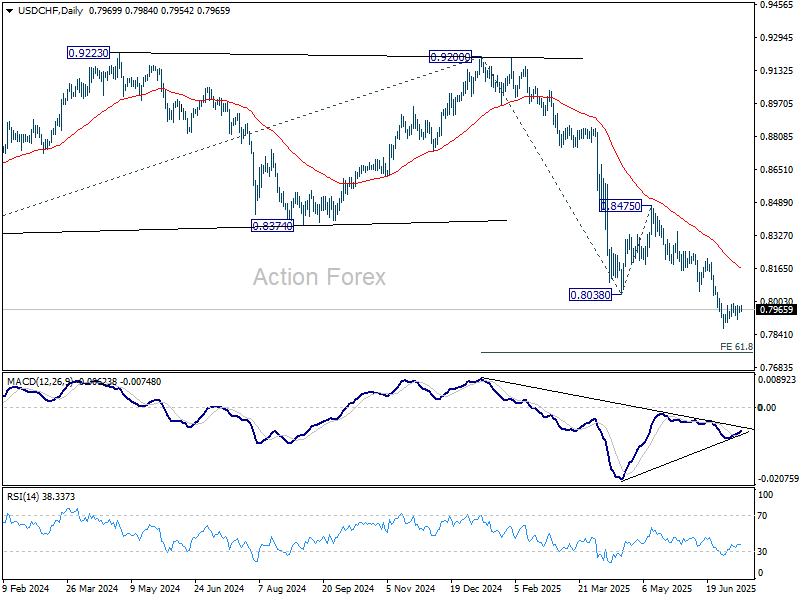
In the bigger picture, long term down trend from 1.0342 (2017 high) is still in progress. Next target is 100% projection of 1.0146 (2022 high) to 0.8332 from 0.9200 at 0.7382. In any case, outlook will stay bearish as long as 0.8475 resistance holds.
GBP/USD Mid-Day Outlook
Daily Pivots: (S1) 1.3454; (P) 1.3520; (R1) 1.3559; More...
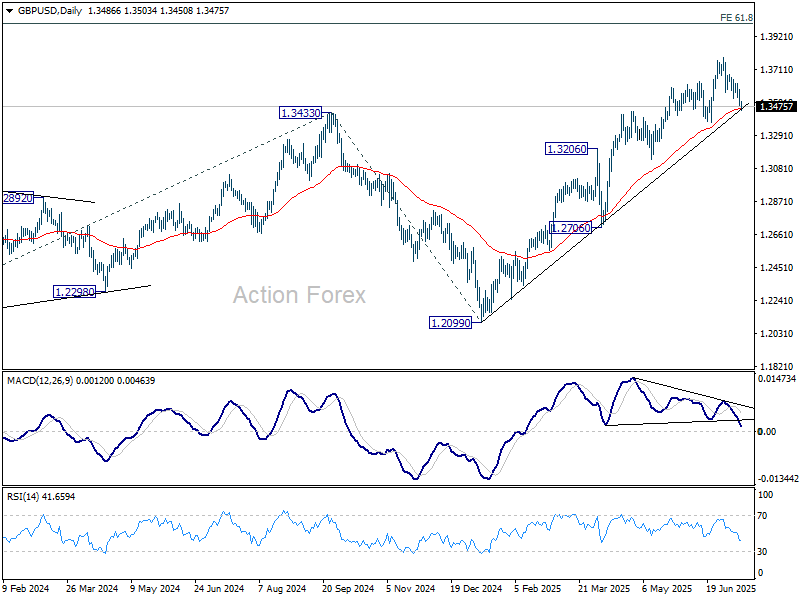
Intraday bias in GBP/USD stays neutral first. Pullback from 1.3787 could extend lower but downside is expected to be contained by 1.3369 support to bring rebound. On the upside, above 1.3680 minor resistance will bring retest of 1.3787. Firm break of 1.3787 will resume larger up trend to 100% projection of 1.2099 to 1.3206 from 1.3138 at 1.3813. However, firm break of 1.3369 will bring deeper correction back to 1.2706/3206 support zone.
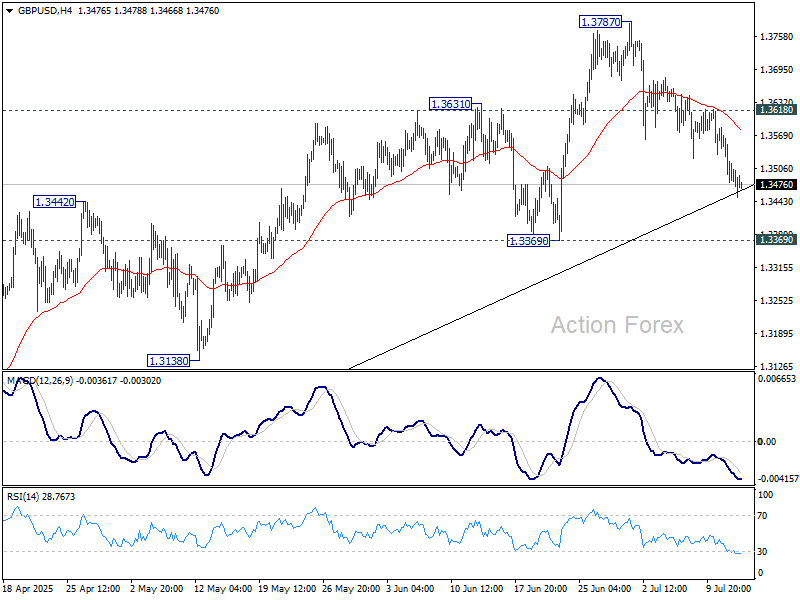
In the bigger picture, up trend from 1.3051 (2022 low) is in progress. Next medium term target is 61.8% projection of 1.0351 to 1.3433 from 1.2099 at 1.4004. Outlook will now stay bullish as long as 55 W EMA (now at 1.3019) holds, even in case of deep pullback.
EUR/USD Mid-Day Outlook
Daily Pivots: (S1) 1.1665; (P) 1.1690; (R1) 1.1714; More...
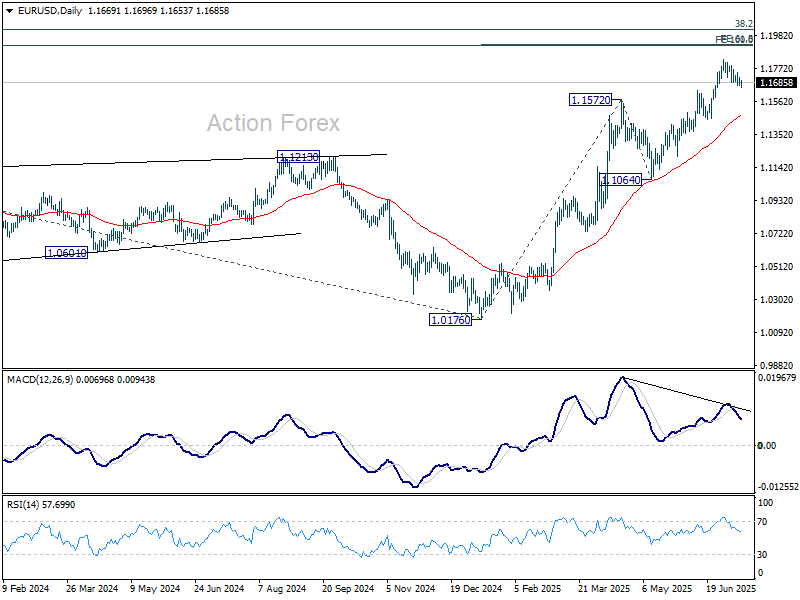
EUR/USD is still extending the correction from 1.1829 and intraday bias remains neutral for the moment. Downside should be 1.1630 resistance turned support to bring rebound. Firm break of 1.1829 will resume the rise from 1.0176 and target 61.8% projection of 1.0176 to 1.1572 from 1.1064 at 1.1927. However, sustained break of 1.1630 will bring deeper fall to 55 D EMA (now at 1.1474) instead.
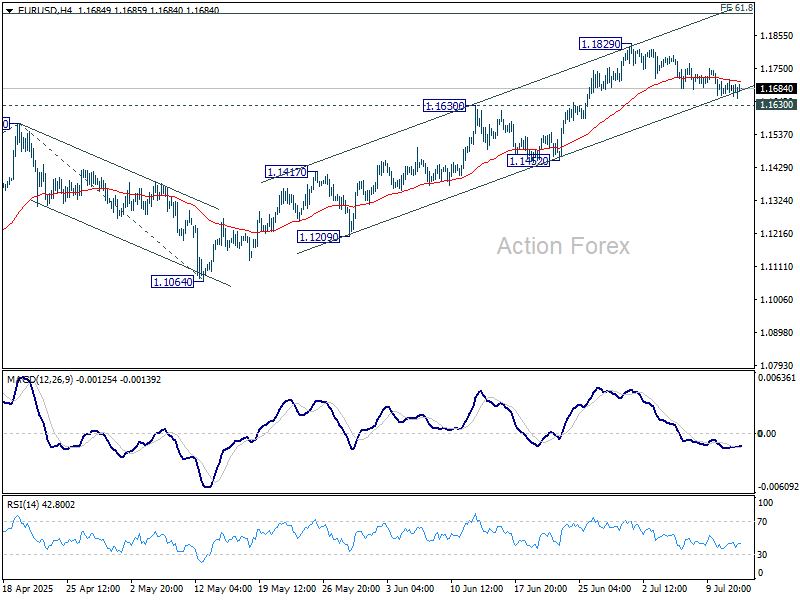
In the bigger picture, rise from 0.9534 long term bottom could be correcting the multi-decade downtrend or the start of a long term up trend. In either case, further rise should be seen to 100% projection of 0.9534 to 1.1274 from 1.0176 at 1.1916. This will now remain the favored case as long as 1.1604 support holds.
Markets Cautious But Not Panicked, Hope for US-EU Deal Remains
The reaction to US President Donald Trump’s latest tariff salvo has been relatively muted so far. Germany’s DAX and France’s CAC opened mildly lower, but losses remain limited. In currency markets, Euro is holding steady, trading largely inside Friday’s ranges without triggering major downside momentum. The market appears to be bracing for drawn-out negotiations rather than immediate escalation.
Optimism is underpinned by Trump’s negotiation history—often characterized by bold opening demands followed by compromise. The fact that the 30% tariff on EU imports is scheduled to take effect in August, not immediately, reinforces the view that space remains for a diplomatic resolution. The final rate will likely land well below 30%, even though above the UK's 10% benchmark.
European Trade Commissioner Maros Sefcovic warned Monday that the 30% tariff would severely disrupt transatlantic trade, but voiced hope that a resolution could still be achieved. “We have to do everything we can to prevent this super-negative scenario,” he said. Talks between the EU and Washington are ongoing, and the EU has not yet announced any retaliatory measures, which has helped temper market nerves.
Elsewhere, South Korea is also looking for a way out of the tariff web. Trade Minister Yeo Han-koo said an in-principle agreement might be achievable before August 1. Speaking to local media, he hinted Seoul may open up its agricultural markets while protecting strategic industrial sectors. “Twenty days are not enough to come up with a perfect treaty,” he acknowledged, but reiterated the urgency of preventing damaging tariffs on Korean exports.
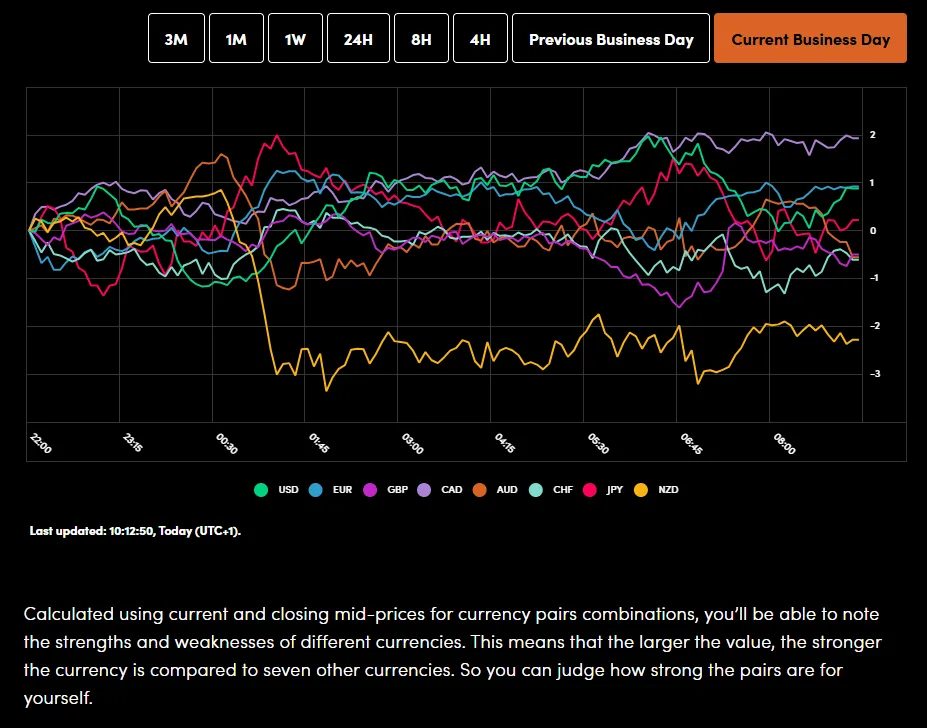
In currency markets, the Canadian Dollar is leading gains, while Swiss Franc and Yen are benefitting from mild safe-haven demand. New Zealand and Australian Dollars remain under pressure, despite China’s better-than-expected trade numbers. Sterling is weak as well. Dollar and Euro are trading near mid-pack.
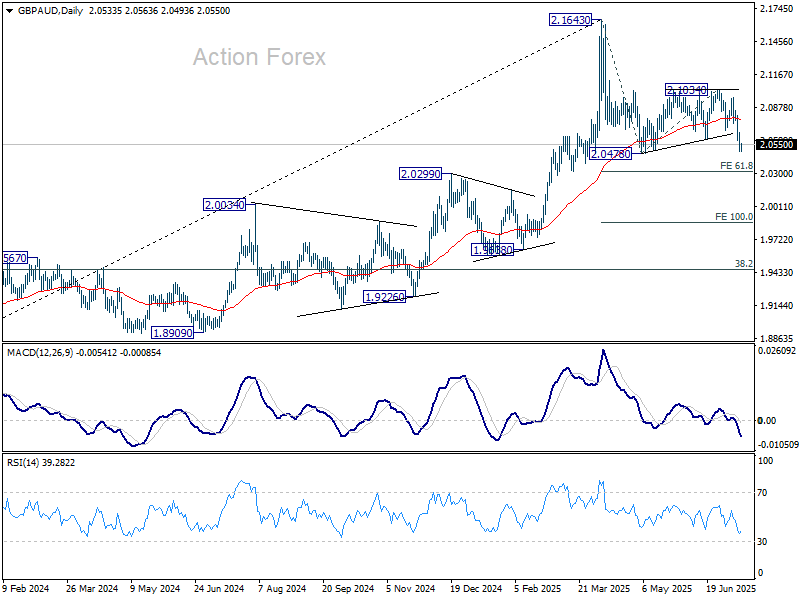
Technically, one pair to watch is GBP/AUD. After last week's extended decline, it's now pressing 2.0478 support. Firm break there will resume whole fall from 2.1643, and target 61.8% projection of 2.1643 to 2.0478 from 2.1034 at 2.0314. Decisive break there could prompt further acceleration to 100% projection at 1.9869.
In Europe, at the time of writing, FTSE is up 0.36%. DAX is down -0.89%. CAC is down -0.42%. UK 10-year yield is down -0.009 at 4.620. Germany 10-year yield is up 0.01 at 2.735. Earlier in Asia, Nikkei fell -0.28%. Hong Kong HSI rose 0.26%. China Shanghai SSE rose 0.27%. Singapore Strait Times rose 0.52%. Japan 10-year JGB yield rose 0.07 to 1.577.
Silver hits near 14-year high and targest 40 as global flows accelerate
Silver’s rally picked up pace on Monday, hitting its highest level since late 2011 after last week’s decisive upside breakout. The metal has surged alongside broad-based strength in precious metals, with Palladium reaching its highest since October 2024 and Gold rebounding to a three-week high. Renewed investor interest across the complex suggests increasing demand for portfolio diversification amid geopolitical and trade policy risks.
One notable driver has been rising demand out of India, where investors are shifting from Gold to Silver as a catch-up trade after years of underperformance. Silver is also seeing structural demand growth tied to industrial applications—especially in solar energy and electric vehicles—which is outpacing domestic production. This dual push from both speculative and real-economy buyers is adding fuel to the current run.
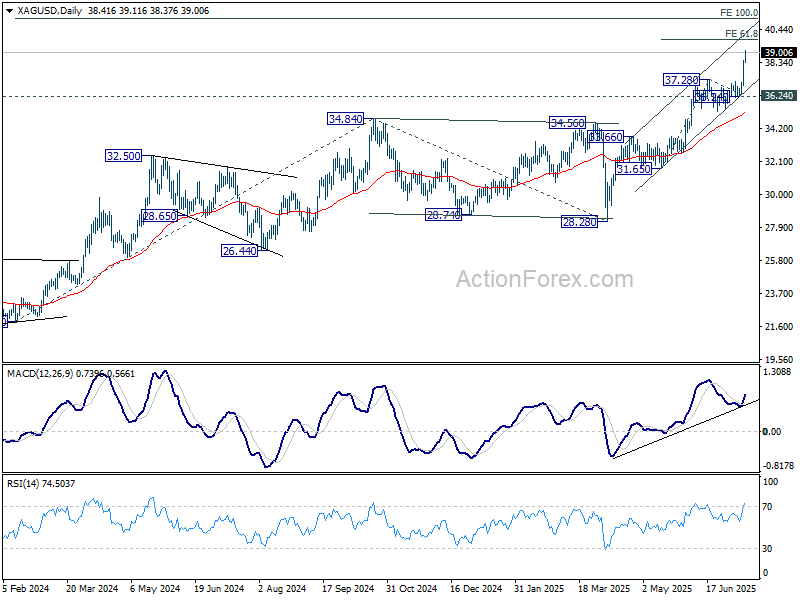
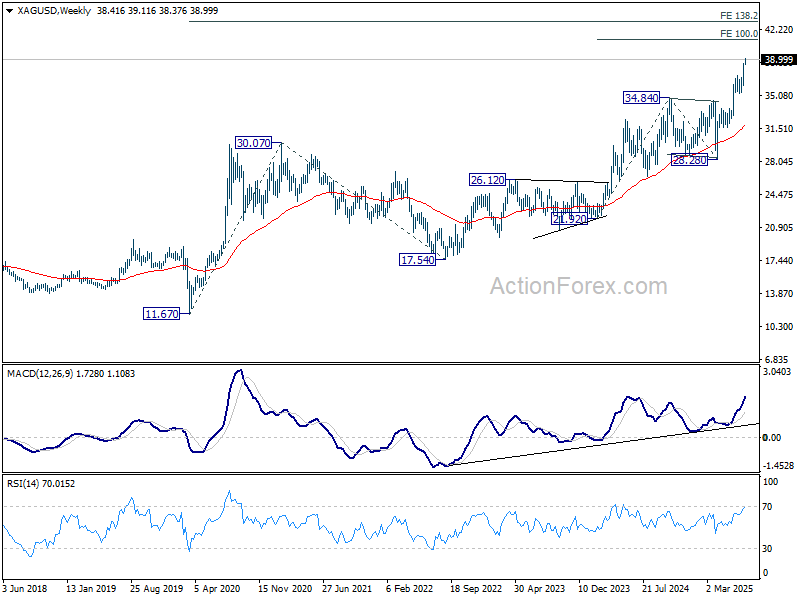
Technically, Silver is on track to 61.8% projection of 31.65 to 37.28 from 36.24 at 39.71, or even further to 40 pscyholgical level. However, upside could be capped by medium term level of 100% projection of 21.92 to 34.83 from 28.28 at 41.20 on first attempt.
NZ BNZ services rises to 47.3, but outlook remains grim
New Zealand’s services sector showed mild improvement in June, with BusinessNZ Performance of Services Index rising to 47.3 from May’s 44.1. Despite the gain, the index remains well below its long-run average of 52.9 and firmly in contraction territory. Subcomponents showed modest upticks—new orders rose from 43.4 to 48.8, employment edged up from 47.1 to 47.4, and activity/sales climbed to 44.5. Inventories just breached the 50-mark at 50.6.
Still, the broader backdrop remains discouraging. 66.2% of surveyed businesses offered negative comments, citing subdued consumer confidence, elevated living costs, and policy-related uncertainty. Public sector retrenchment, inflation, and rising interest rates continue to bite, while seasonal factors like winter and lower tourist activity weigh on demand. BNZ’s Doug Steel summed it up bluntly: “The timeline for New Zealand’s long-awaited economic recovery just keeps getting pushed further and further out.”
China’s exports growth accelerates to 5.8% yoy in June on tariff truce window
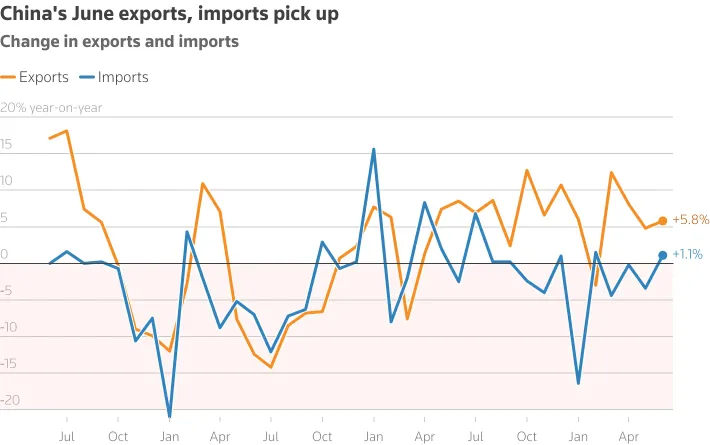
China’s exports rose 5.8% yoy in June, beating expectations of 5.0% yoy and marking a pickup from May’s 4.8% yoy. The improvement comes as exporters moved quickly to take advantage of the 90-day tariff truce with the US, front-loading shipments ahead of anticipated disruptions.
The stronger-than-expected performance helped lift China’s trade surplus to USD 114.8B, slightly above consensus and up from USD 103.2B in May.
Imports rose 1.1% yoy, the first positive reading of the year and a tentative sign of stabilization in domestic demand.
EUR/USD Mid-Day Outlook
Daily Pivots: (S1) 1.1665; (P) 1.1690; (R1) 1.1714; More...
EUR/USD is still extending the correction from 1.1829 and intraday bias remains neutral for the moment. Downside should be 1.1630 resistance turned support to bring rebound. Firm break of 1.1829 will resume the rise from 1.0176 and target 61.8% projection of 1.0176 to 1.1572 from 1.1064 at 1.1927. However, sustained break of 1.1630 will bring deeper fall to 55 D EMA (now at 1.1474) instead.
In the bigger picture, rise from 0.9534 long term bottom could be correcting the multi-decade downtrend or the start of a long term up trend. In either case, further rise should be seen to 100% projection of 0.9534 to 1.1274 from 1.0176 at 1.1916. This will now remain the favored case as long as 1.1604 support holds.
Silver hits near 14-year high and targest 40 as global flows accelerate
Silver’s rally picked up pace on Monday, hitting its highest level since late 2011 after last week’s decisive upside breakout. The metal has surged alongside broad-based strength in precious metals, with Palladium reaching its highest since October 2024 and Gold rebounding to a three-week high. Renewed investor interest across the complex suggests increasing demand for portfolio diversification amid geopolitical and trade policy risks.
One notable driver has been rising demand out of India, where investors are shifting from Gold to Silver as a catch-up trade after years of underperformance. Silver is also seeing structural demand growth tied to industrial applications—especially in solar energy and electric vehicles—which is outpacing domestic production. This dual push from both speculative and real-economy buyers is adding fuel to the current run.
Technically, Silver is on track to 61.8% projection of 31.65 to 37.28 from 36.24 at 39.71, or even further to 40 psychological level. However, upside could be capped by medium term level of 100% projection of 21.92 to 34.83 from 28.28 at 41.20 on first attempt.
Gold: Is the Latest Bounce Sustainable?
- Gold crosses above 3,355 resistance as tariffs threats return.
- Short-term bias is positive but key obstacles still lie ahead.
- Support at 3,300–3,325 critical for downside risk.
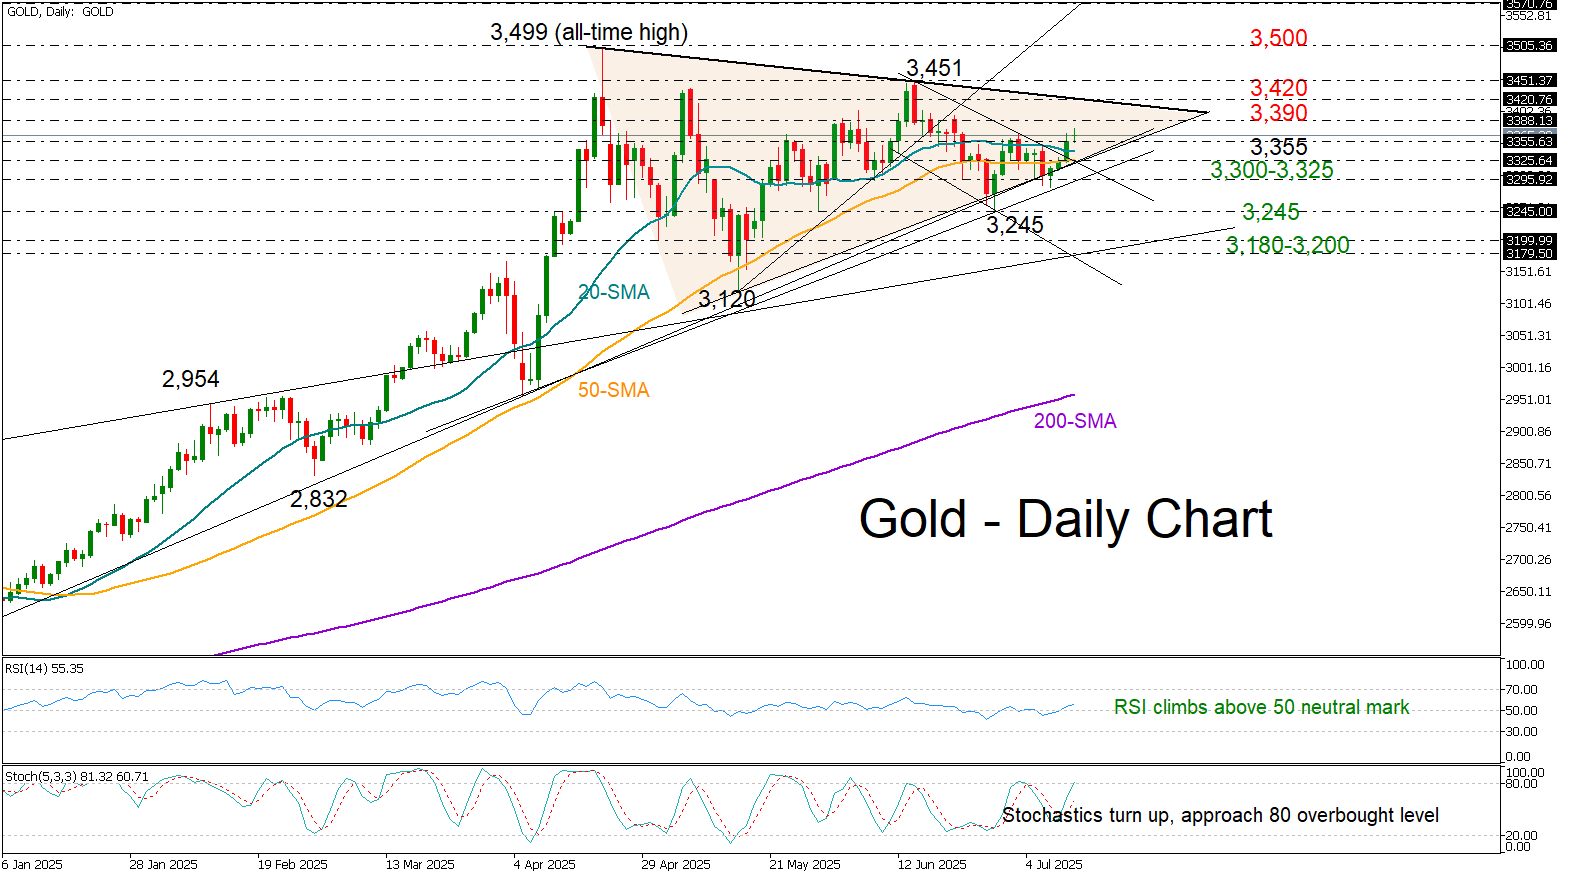
Gold opened Monday’s session with a mild upside gap at 3,363 and above its short-term simple moving averages (SMAs), following President Trump’s announcement of increased tariffs on European Union and Mexican goods – raising them to 30% effective August 1.
Investors did not react aggressively, interpreting the move as another negotiating tactic by the U.S. president to accelerate progress in the trade talks. Nevertheless, Friday’s channel breakout, followed by Monday’s modest upside move, was enough to lift the price above the key 3,355 barrier – a level that has repeatedly capped bullish momentum since April.
The next upside target is the 3,390 resistance zone from June, followed by a tentative descending trendline drawn from April’s peak, currently near 3,420. A decisive break above this trendline could pave the way for a retest of the previous high at 3,450, with the psychological 3,500 level coming into focus next. Further gains could even push the price toward the 161.8% Fibonacci extension of the previous downleg at 3,570, and eventually to the round 3,600 mark.
However, with the stochastic oscillator nearing the 80 overbought threshold, a sustainable breakout above 3,420 cannot be taken for granted. On the downside, the support trendline between 3,300 and 3,325 will be closely monitored. If this floor gives way, selling pressure could intensify, dragging the price toward 3,245, and then potentially down to the 3,180–3,200 zone.
All in all, the precious metal could gain fresh bullish momentum in the coming sessions. However, whether it can strengthen its outlook above 3,420 – and more crucially, resume its record rally beyond 3,500 – remains to be seen.
Bitcoins Surge to $123k. China Exports Rise, DAX Retests 24000 Support
Asian Market Wrap
U.S. and European stock futures dropped at the start of the week after President Trump announced a 30% tariff on goods from the EU and Mexico.
S&P 500 futures fell 0.4%, and European stock futures dipped 0.6%. Meanwhile, Asian stocks stayed mostly flat, with small gains in Hong Kong and China.
President Trump’s new tariff threats are challenging the market’s strength after he increased trade measures on countries like Canada, Brazil, and Algeria last week. Despite warnings, investors seem to expect Trump to back down, as he has done before. This confidence helped the S&P 500 and MSCI All Country World Index hit record highs this month.
The EU had been working on a deal with the U.S. to avoid higher tariffs, but Trump’s latest move has dampened optimism in Brussels. However, he hinted at possible adjustments. The EU is now planning to work more closely with other countries affected by Trump’s tariffs, according to sources.
China Exports Beat Forecasts Ahead of Trump’s Latest Tariff Deadline
China's exports picked up in June as companies hurried to fulfill orders during a temporary tariff truce between Beijing and Washington. Shipments to Southeast Asian transit hubs were especially strong ahead of next month's deadline.
China's exports grew by 5.8% in June 2025, reaching $325.2 billion. This was slightly better than the expected 5% rise and faster than May's 4.8% growth. The increase came as tariff pressures eased temporarily before the August deadline.
Rare-earth exports jumped 32% from May, likely due to agreements made in June to ease restrictions and restore global supply. Last month, the U.S. and China signed deals to reopen rare-earth trade after China's export controls in April disrupted supply chains and caused some auto factories to shut down.
Source: LSEG
European Open
European stocks dropped on Monday, led by carmakers. The STOXX 600 index fell 0.6% to 544.3 points, while most regional indexes also declined. However, the UK's FTSE 100 rose 0.2%.
Adding to trade tensions, Italy's Foreign Minister Antonio Tajani said the EU has prepared $24.5 billion worth of tariffs on U.S. goods if no deal is reached.
In the market, European car stocks fell 1.4%, and the retail sector dropped 1%.
On the bright side, AstraZeneca shares rose 1.9% after announcing that its drug Baxdrostat successfully met key goals in a study for patients with hard-to-treat high blood pressure.
On the FX Front, The euro dropped to a three-week low on Monday, while the U.S. dollar gained slightly, benefiting from tariff uncertainty though it’s unclear if this will continue.
The dollar rose 0.28% against the Mexican peso to 18.6763.
Other currencies saw mixed movements:
The British pound fell 0.15% to 1.3470.
The Japanese yen rose slightly to 147.31 per dollar.
The Australian dollar dropped 0.12% to 0.6566.
The New Zealand dollar slid 0.37% to 0.5987.
Outside of tariffs, Trump said on Sunday it would be "great" if Federal Reserve Chair Jerome Powell stepped down, again pressuring the Fed to lower interest rates.
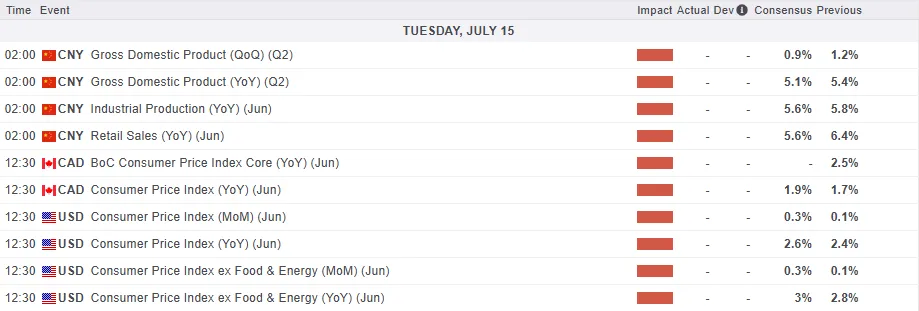
Traders are waiting for June inflation data, due Tuesday, which could give clues about future U.S. rate cuts. Markets expect the Fed to lower rates by over 50 basis points by December.
Currency Power Balance
Source: OANDA Labs
Looking at commodities and Oil prices edged higher this morning and trades above the 200-day MA..
Gold prices have been mixed since the market opened last night with choppy price action a sign of the uncertainty at present.
Economic Data Releases and Final Thoughts
Looking at the economic calendar, it is a quiet start to what is expected to be a busy week from a data perspective.
ECB policymakers will be speaking today which is the highlight before Tuesday's US CPI release which will be followed by inflation releases from Canada, UK and Japan later in the week.
Earnings season also gets underway this week with some heavyweights reporting on their Q2 performance and outlook for the rest of the year. Add to this the ongoing tariff and trade developments and markets could be set for a volatile week.
For all market-moving economic releases and events, see the MarketPulse Economic Calendar. (click to enlarge)
Chart of the Day - Bitcoin (BTC/USD)
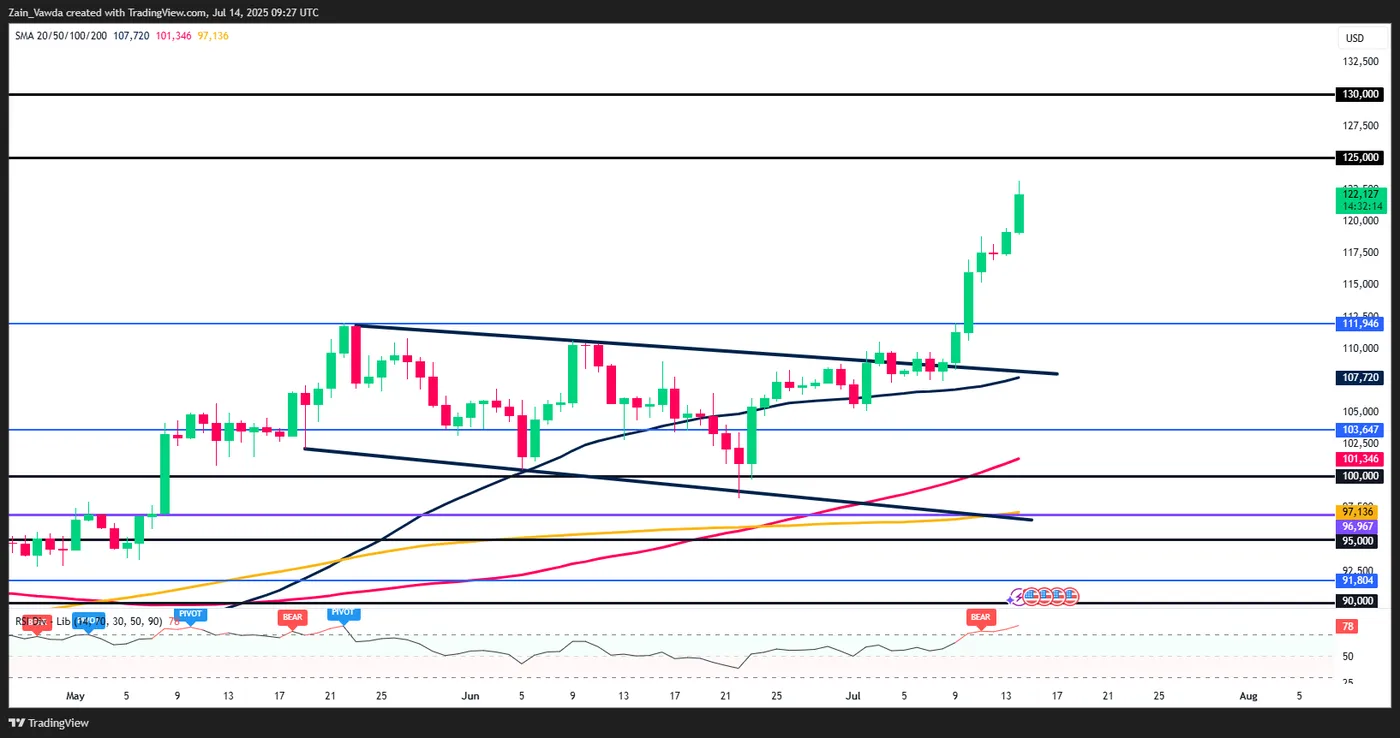
From a technical standpoint, Bitcoin has been on a tear printing fresh all-time highs on a regular basis.
Overnight the worlds largest cryptocurrency hit a fresh all-time high just above the $123k mark.
There is a slight pullback this morning down to the $122k but the rally does not appear to be over. There is a possibility of a short-term pullback should market participants indulge in some profit taking but demand remains strong.
Institutional demand spiked over the last two weeks which helped Bitcoin breakout following a period of consolidation.
The rally overnight has now made Bitcoin the 5th largest asset globally (by market cap), surpassing Amazon.
Technical Analysis is a challenge as we have no historical price data to analyze but i will be monitoring whole numbers and psychological levels as well as the RSI for potential moves.
Bitcoin (BTC/USD) Daily Chart, July 14. 2025
Source: TradingView.com (click to enlarge)
Support
- 117500
- 112000
- 109000 (Bear flag retest)
Resistance
- 123236
- 125000
- 130000
GOLD (XAUUSD) Calling the Rally from the Intraday Equal Legs Area
Hello fellow traders,
In this technical article, we are going to present Elliott Wave charts of GOLD (XAUUSD) . As our members know we are long in GOLD from previous equal legs area. As a result, members are now benefiting from profits in positions that remain risk-free. Recently, the commodity completed another intraday correction within the Equal Legs zone. In the following sections, we will outline the current Elliott Wave count.
GOLD 1 Hour Elliott Wave Analysis 07.11.2025
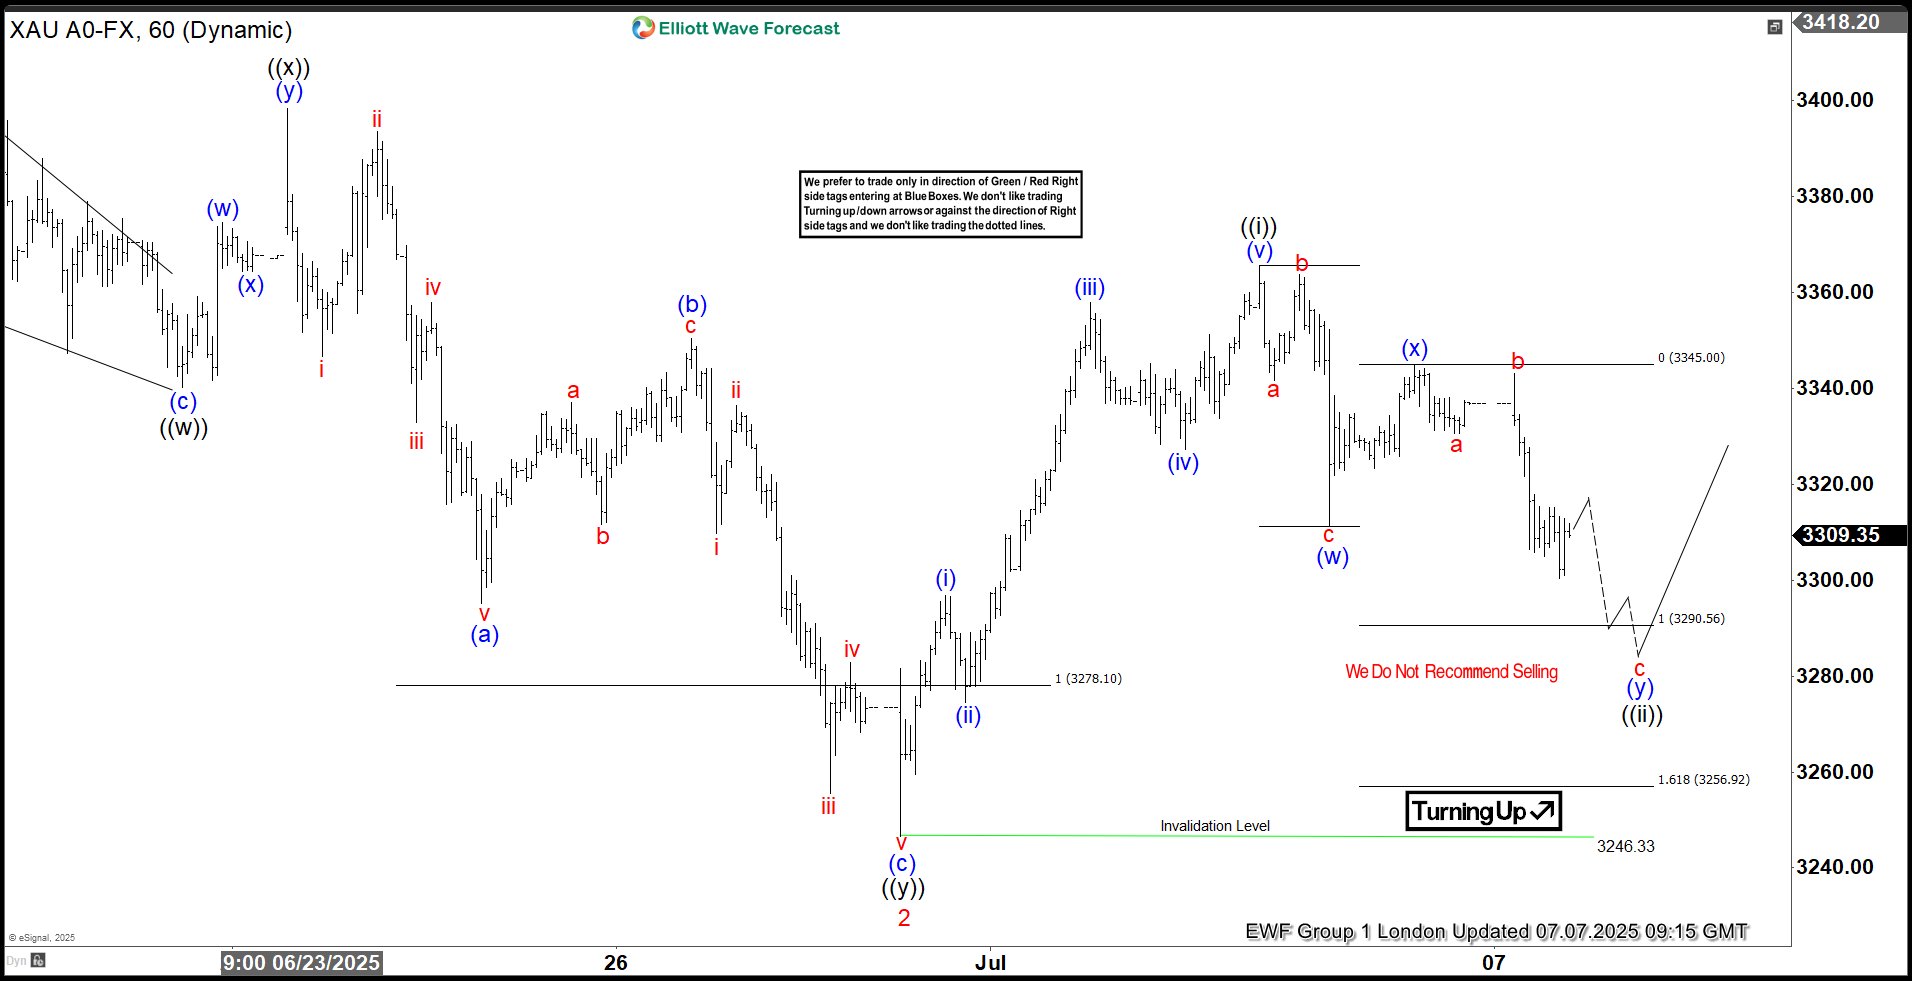
GOLD has completed a 5-wave structure from the 3246.33 low, labeled as wave ((i)) in black. It is currently correcting in wave ((ii)) black, which is unfolding as a Double Three pattern. The correction appears incomplete at this stage. We anticipate further short-term weakness toward the Equal Legs area at 3290.56–3256.9. In that zone, we expect buyers to emerge and initiate another rally toward new highs. Therefore, we recommend avoiding short positions within this area.
GOLD 1 Hour Elliott Wave Analysis 07.11.2025
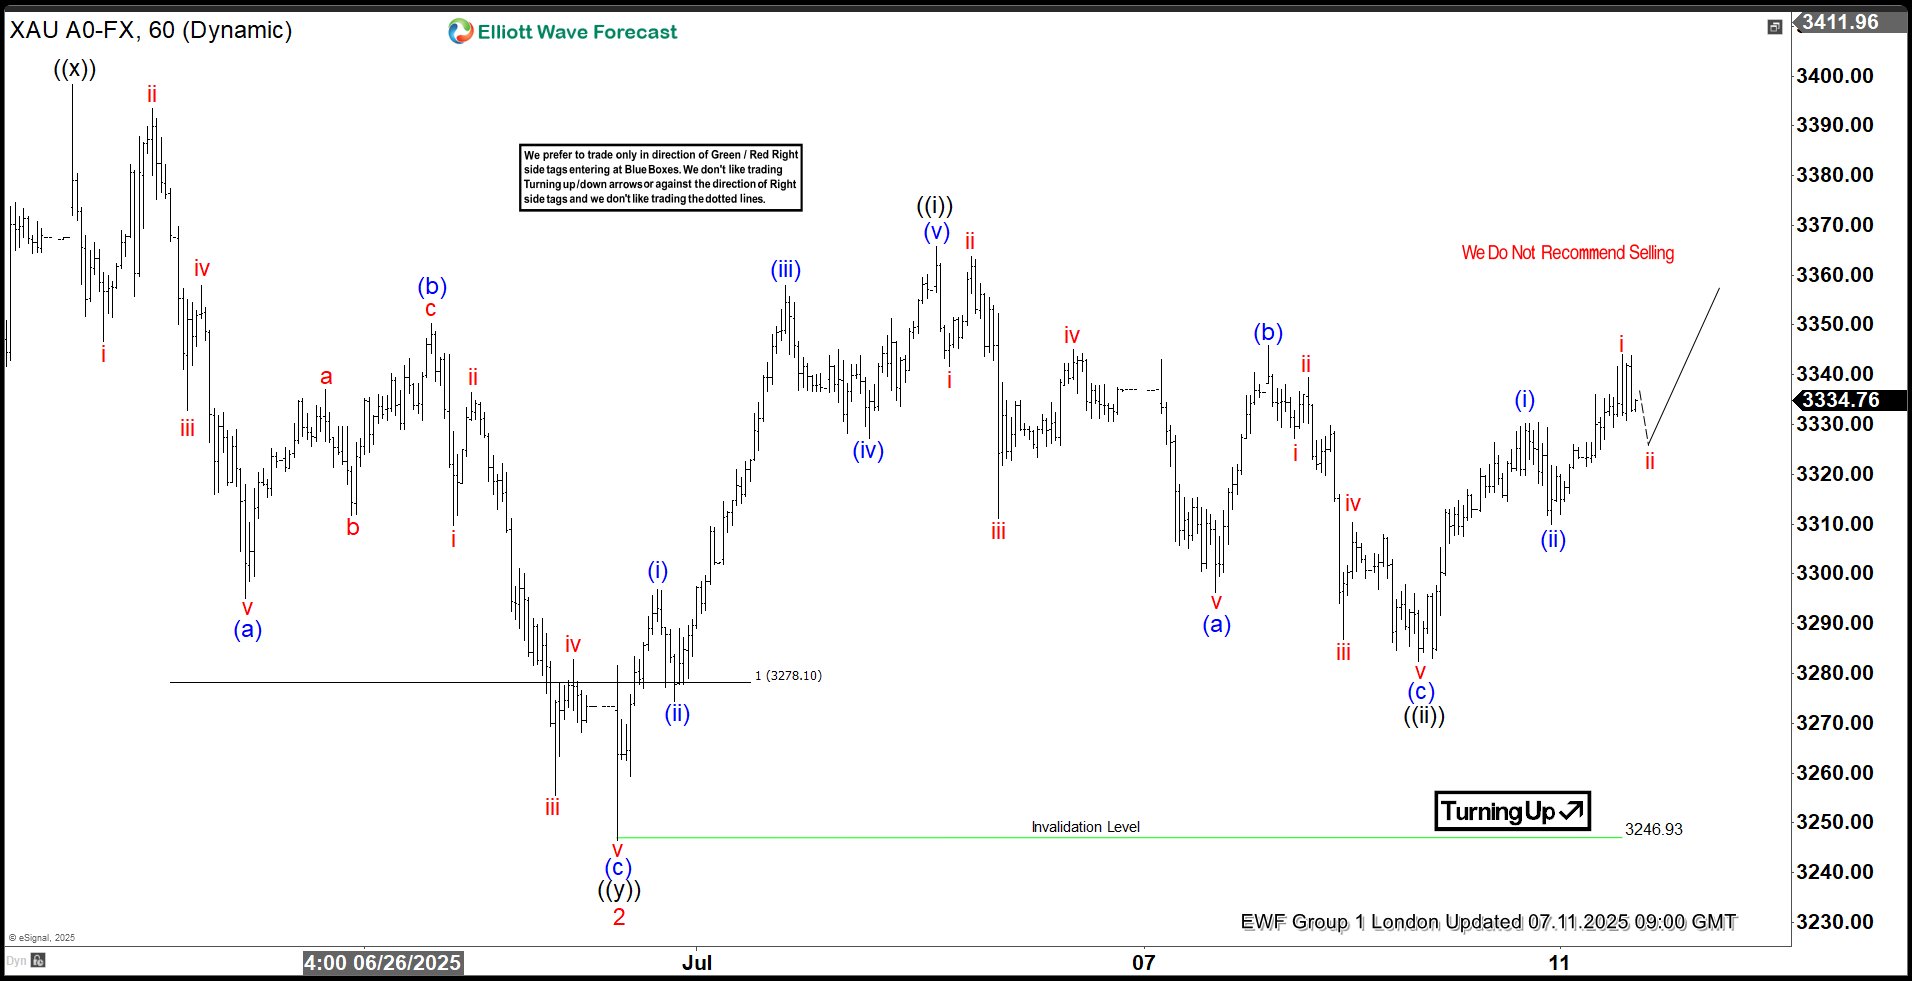
A few days later, GOLD completed the pullback exactly at the previously mentioned zone. As expected, the commodity found buyers and produced a decent bounce. Wave ((ii)) ended at the 3283.39 low. The short-term cycle from the July 9th low now shows a sequence of higher highs, confirming the continuation of the rally. While price remains above the 3283.39 low, the next expected target area is 3403.85–3432.44.
Confident Acceleration of Cryptocurrencies
Market Overview
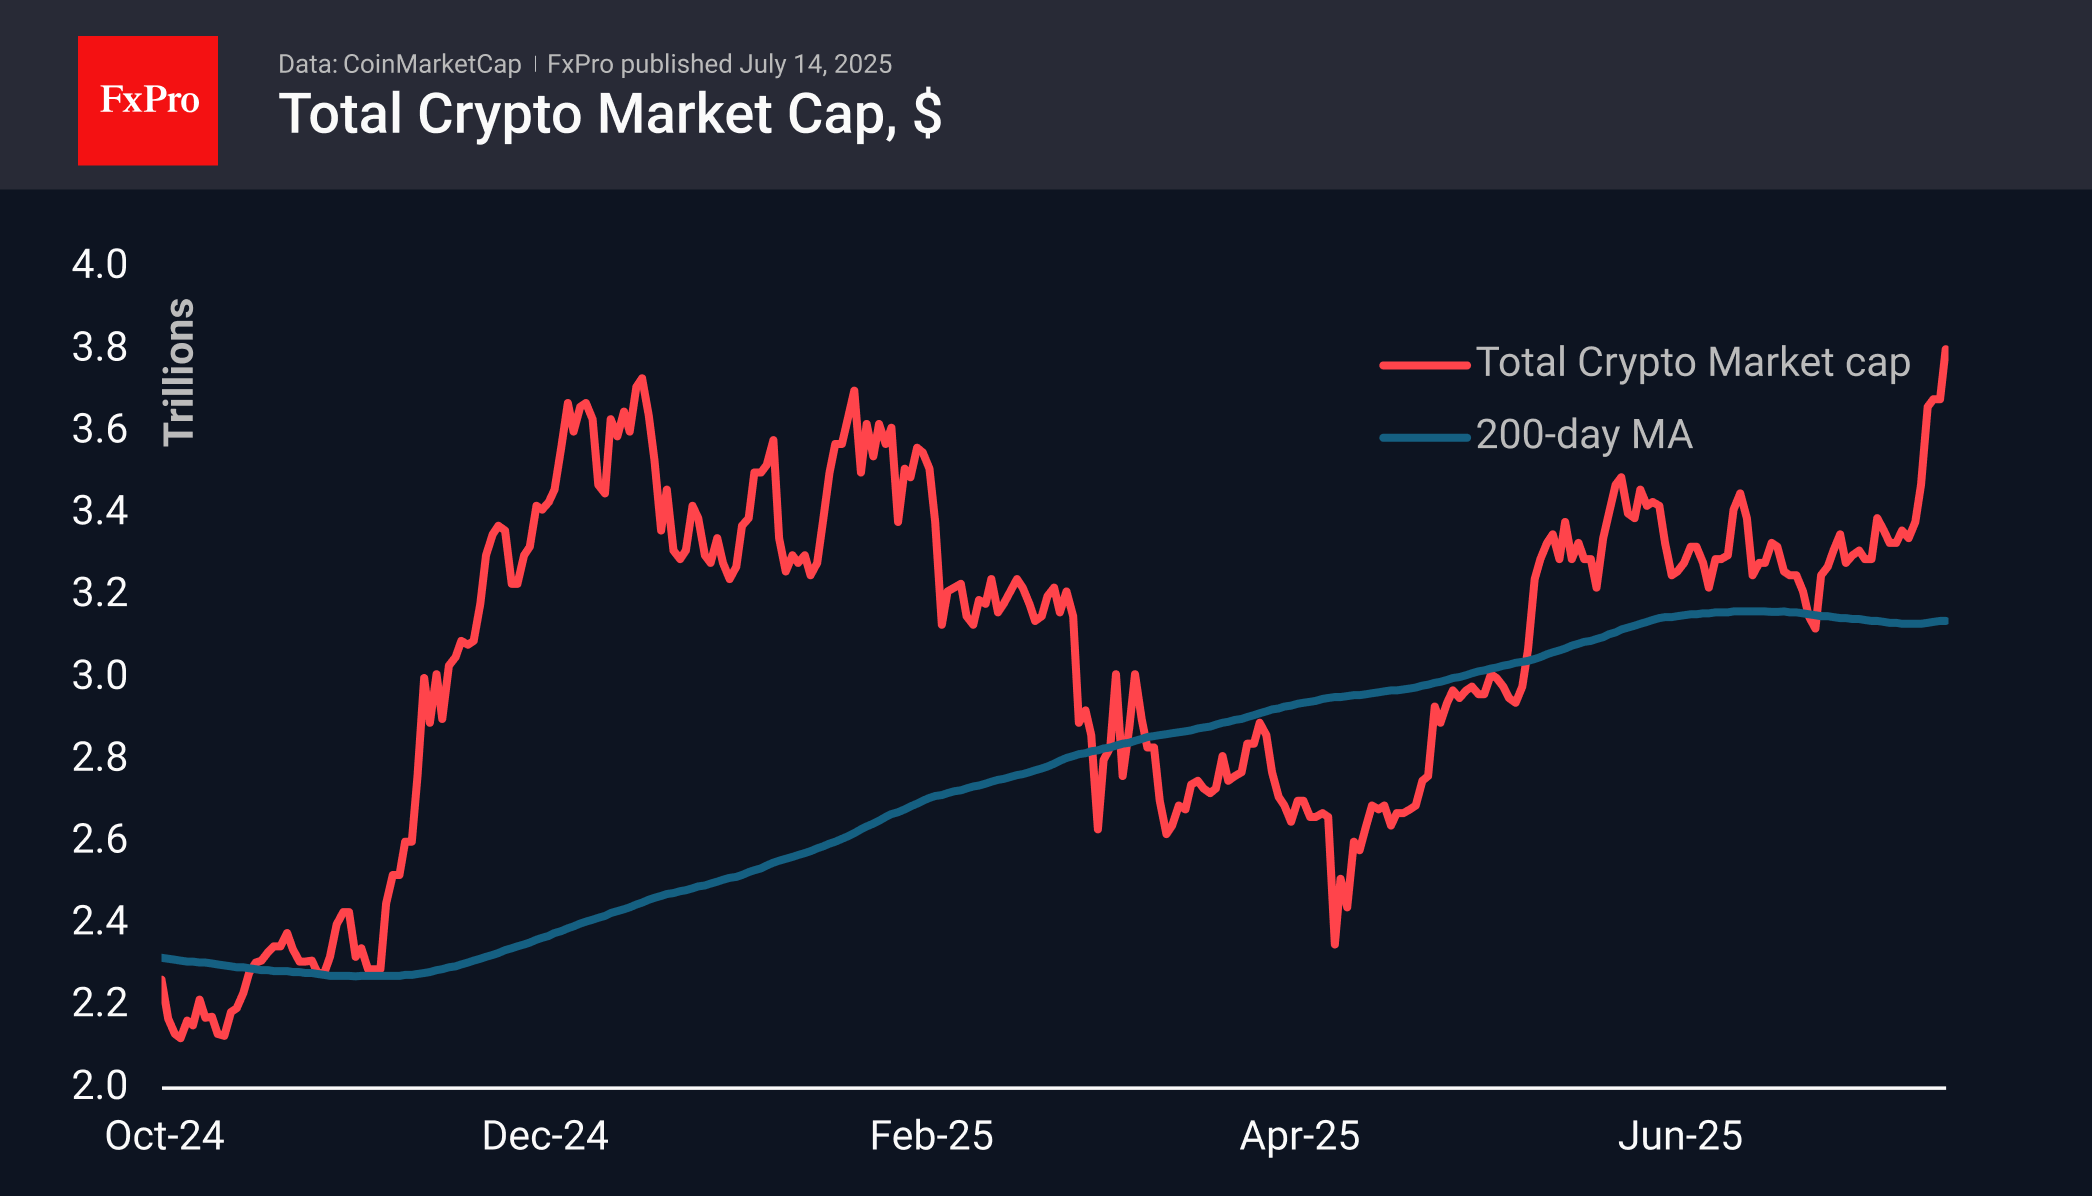
The crypto market cap reached $3.8 trillion (+4% in 24 hours) and began to update historical highs following the first cryptocurrency. Altcoins outside the top ten are gaining momentum, indicating an expansion of the rally and strengthening positive sentiment.
The cryptocurrency sentiment index is not off the charts, and at 74, it is only on the verge of entering the extreme greed zone. The market is not overheating, retaining its potential for further growth.
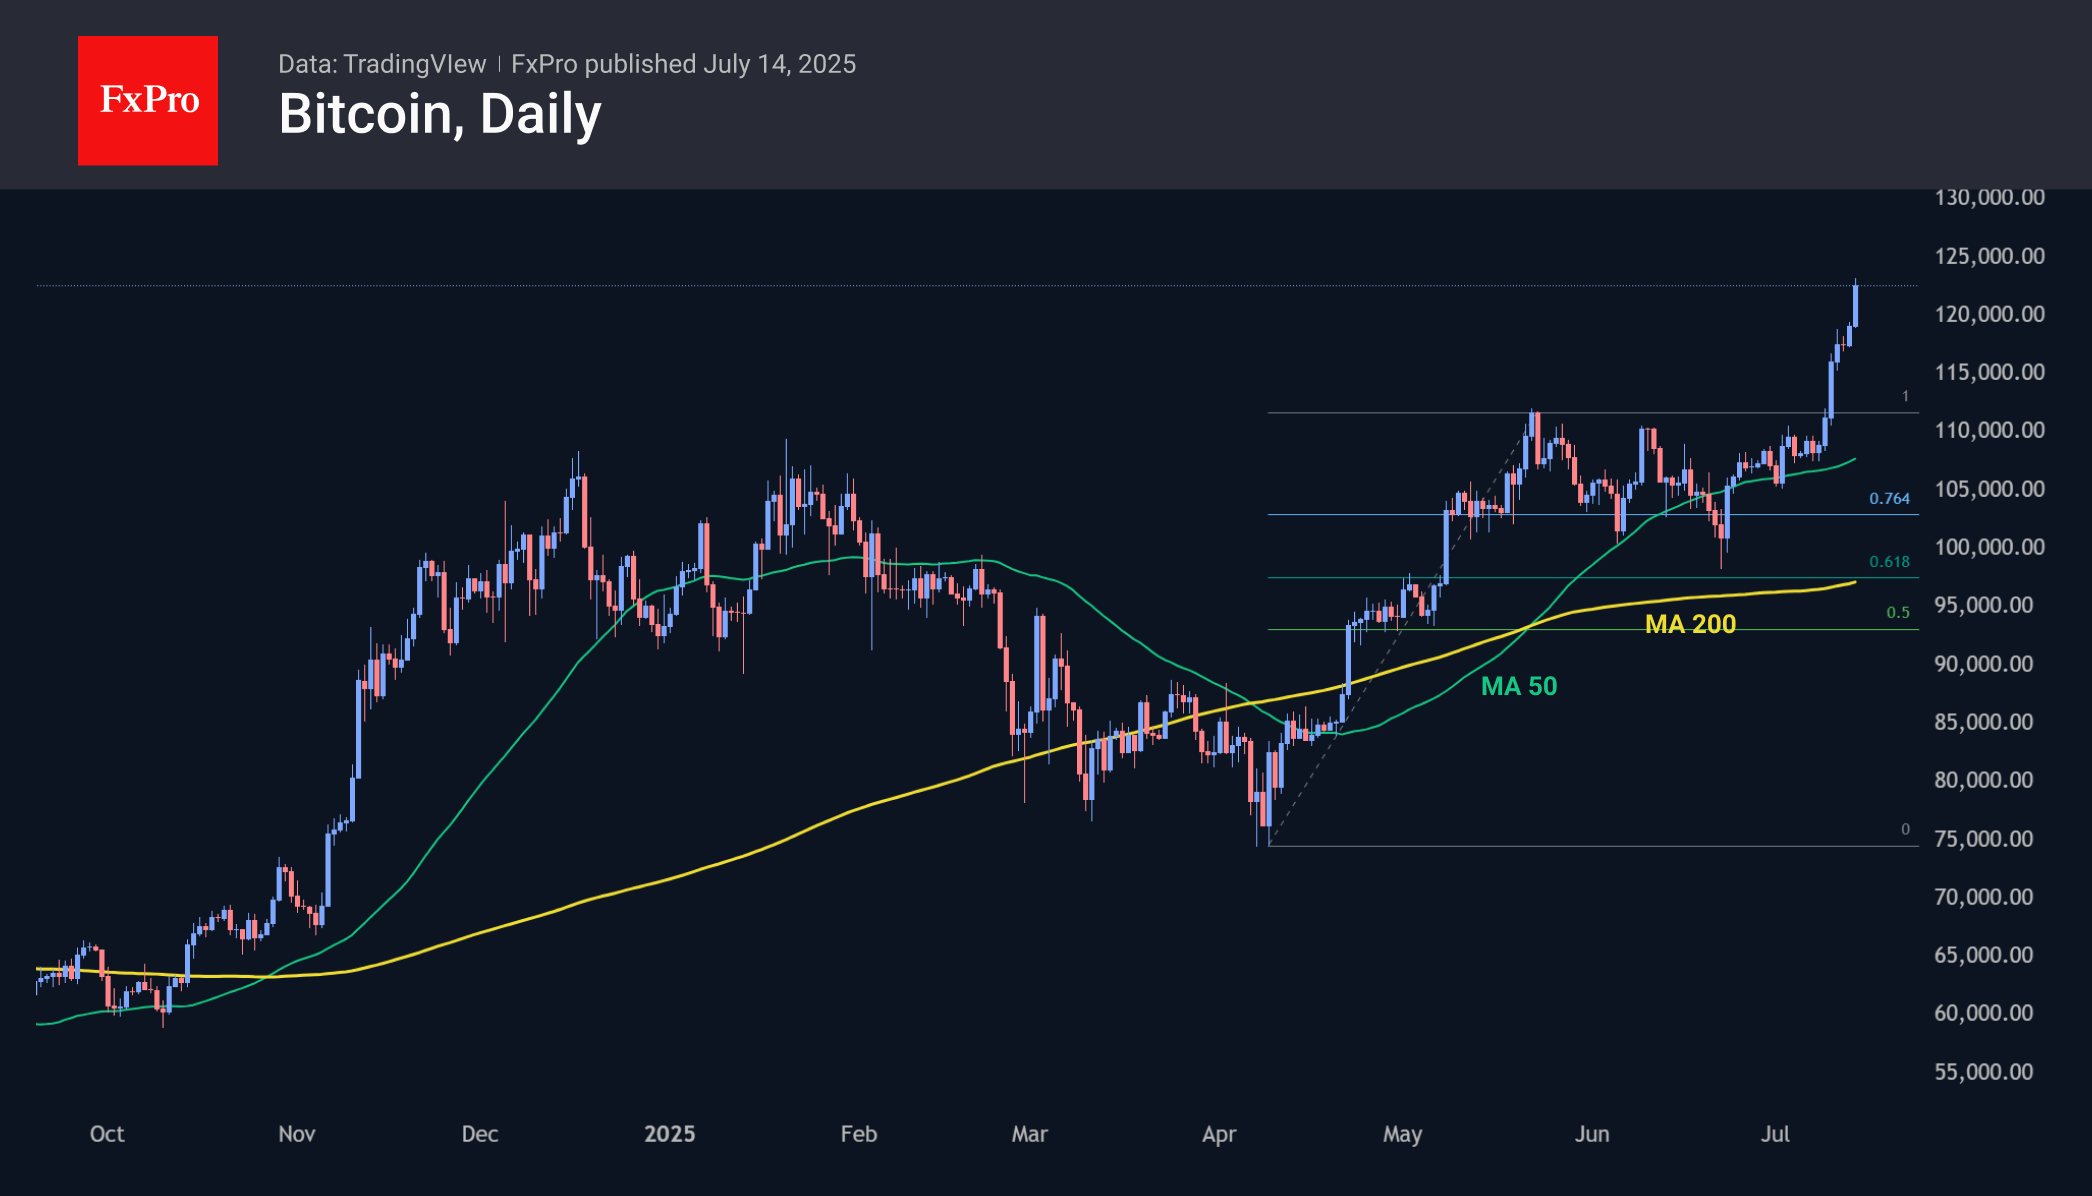
Bitcoin has switched to rally mode, constantly updating historical highs and adding almost 13% over the past seven days. This is important growth, as the last six days have seen an update of maximum values. The April-June growth and correction pattern makes us consider the $135K area a potential big target in the short term.
News Background
Inflows into spot Bitcoin ETFs in the US have continued for the fifth week in a row, and for 11 of the last 13 weeks. According to SoSoValue, net inflows into spot BTC ETFs over the past week amounted to $2.72 billion, the highest in the last seven weeks. Cumulative inflows since the approval of Bitcoin ETFs in January 2024 have increased to $52.36 billion.
Inflows into spot Ethereum ETFs in the US have continued for the ninth week in a row, and for 11 of the last 12 weeks. Net inflows into ETH ETFs last week amounted to $908 million, the highest in the entire year of trading. Total net inflows since the ETF’s launch in July 2024 have increased to $5.31 billion.
Improvements in the macroeconomic situation and growing interest from institutional investors have once again boosted interest in Bitcoin, according to Kronos Research. This reflects the growing perception of the first cryptocurrency as a ‘regulated long-term asset’ comparable to gold.
According to Arkham, on 10 July, Bhutan transferred 213.31 BTC ($23.7 million) to the Binance exchange. The exact reason for the transfer is unknown, but such transactions usually precede the sale of assets.
On 10 July, SharpLink Gaming purchased 10,000 ETH from the Ethereum Foundation (EF) for $25.7 million at an average price of $2,572.37. On 11 July, ETH exceeded the $3,000 mark for the first time since early February.
Grayscale Investments has presented a list of 29 cryptocurrencies that should be included in investment products to diversify client assets.