

Sample Category Title
USD/JPY: Dollar Benefits from Safe Haven Demand
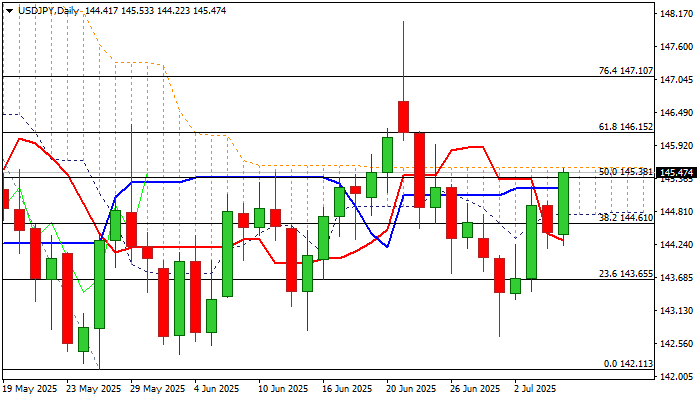
The USDJPY pair jumps around 0.7% on Monday morning, as fresh risk aversion fuels demand for safe-haven dollar.
Monday’s acceleration penetrated daily cloud (spanned between 144.74 and 145.54) with cloud top being under increased pressure, after bulls broke through double-Fibo barriers at 145.35/38 (50% of 148.64/142.11/50% of 148.02/142.68).
Break and close above cloud top to generate fresh bullish signal and shift near term bias higher, with targets at 145.96 (100DMA) and 146.15 (Fibo 61.8%) to come in focus.
Meanwhile, bulls may face headwinds at cloud top and take a breather as overbought daily stochastic warns.
Dips should be limited and hold above cloud base (144.74) to keep fresh bulls in play.
Res: 145.54; 145.96; 146.15; 146.30.
Sup: 145.20; 144.97; 144.74; 144.31.
Yen Weakens as Japanese Data Sends Mixed Signals
The USD/JPY pair edged higher on Monday, reaching 144.81, as the yen relinquished its earlier gains. The currency faced downward pressure following the release of disappointing wage figures, which dampened expectations for further monetary policy tightening by the Bank of Japan.
Japan’s nominal wages rose by just 1.0% year-on-year in May, falling well short of the 2.4% forecast and marking a third consecutive monthly slowdown. Meanwhile, real wages, which reflect actual purchasing power, declined by 2.9% – the sharpest drop in nearly two years and the fifth straight month of contraction.
Notably, the official data does not yet fully account for the impact of this spring’s record wage agreements, negotiated with trade unions. Several smaller and non-unionised firms have been slower to implement these changes, delaying their effect on broader wage trends.
Further weighing on the yen were remarks from Prime Minister Shigeru Ishiba, who stated on Sunday that Japan would not make “easy concessions” in trade talks with the US, despite the threat of 35% tariffs on Japanese exports. Negotiations are expected to resume this week.
Technical Analysis: USD/JPY
H4 Chart:
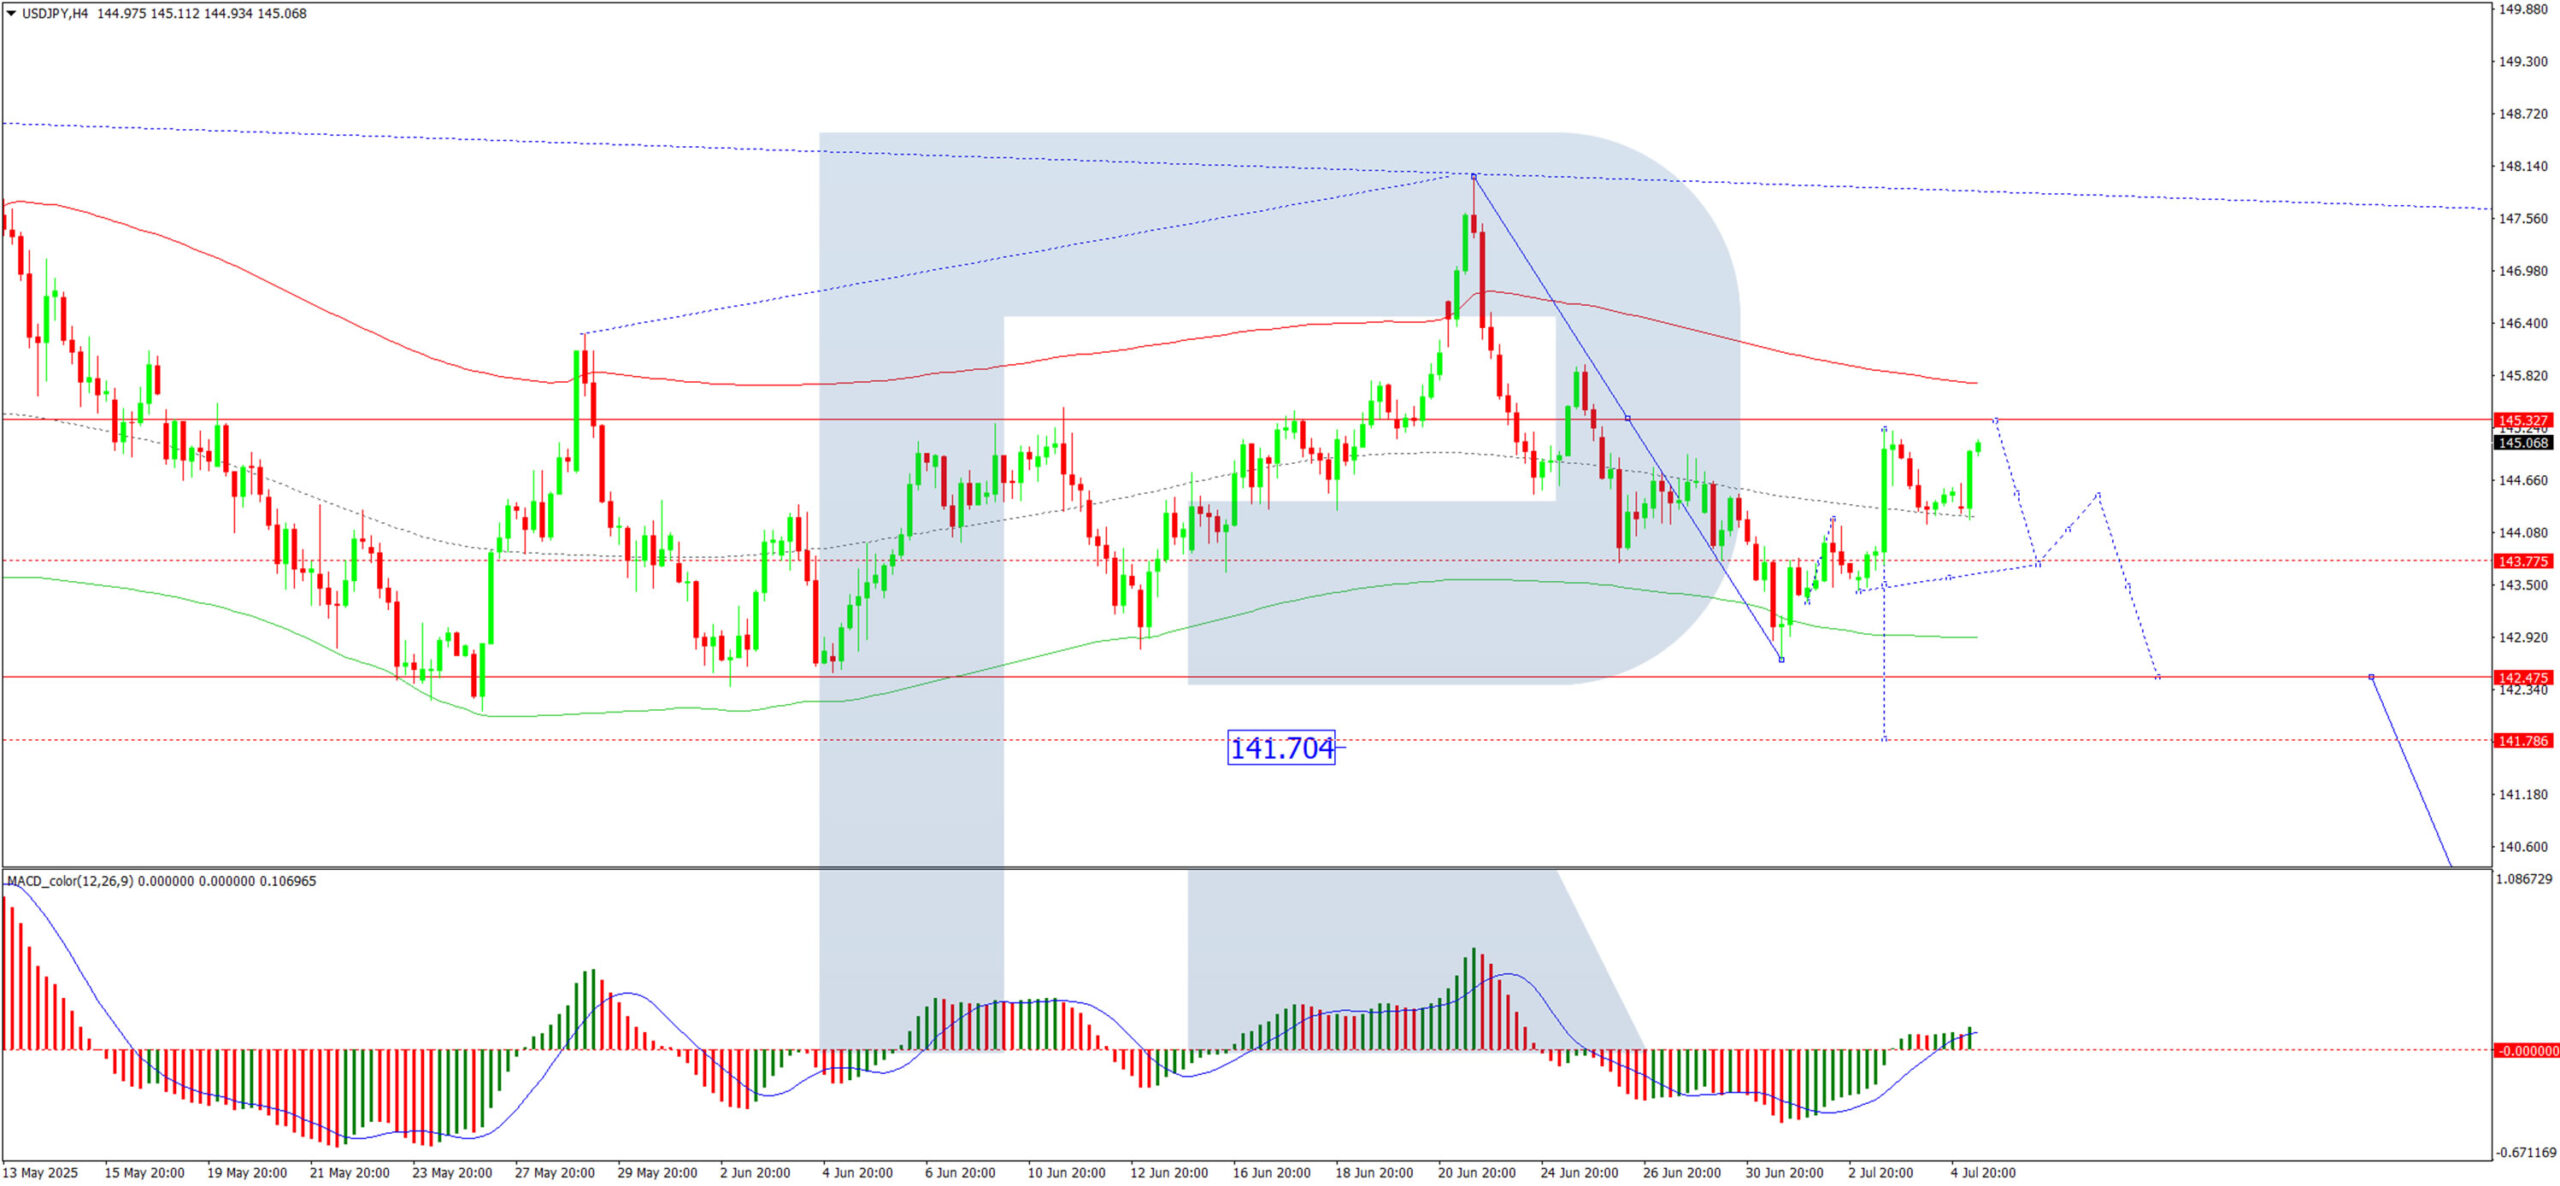
On the H4 chart, USD/JPY has formed a consolidation range around 144.33 before pushing upward. The immediate target is 145.33, after which we anticipate a downward correction towards 142.45, with potential for further declines to 141.70. This scenario is supported by the MACD indicator, where the signal line remains above zero and points firmly upward.
H1 Chart:
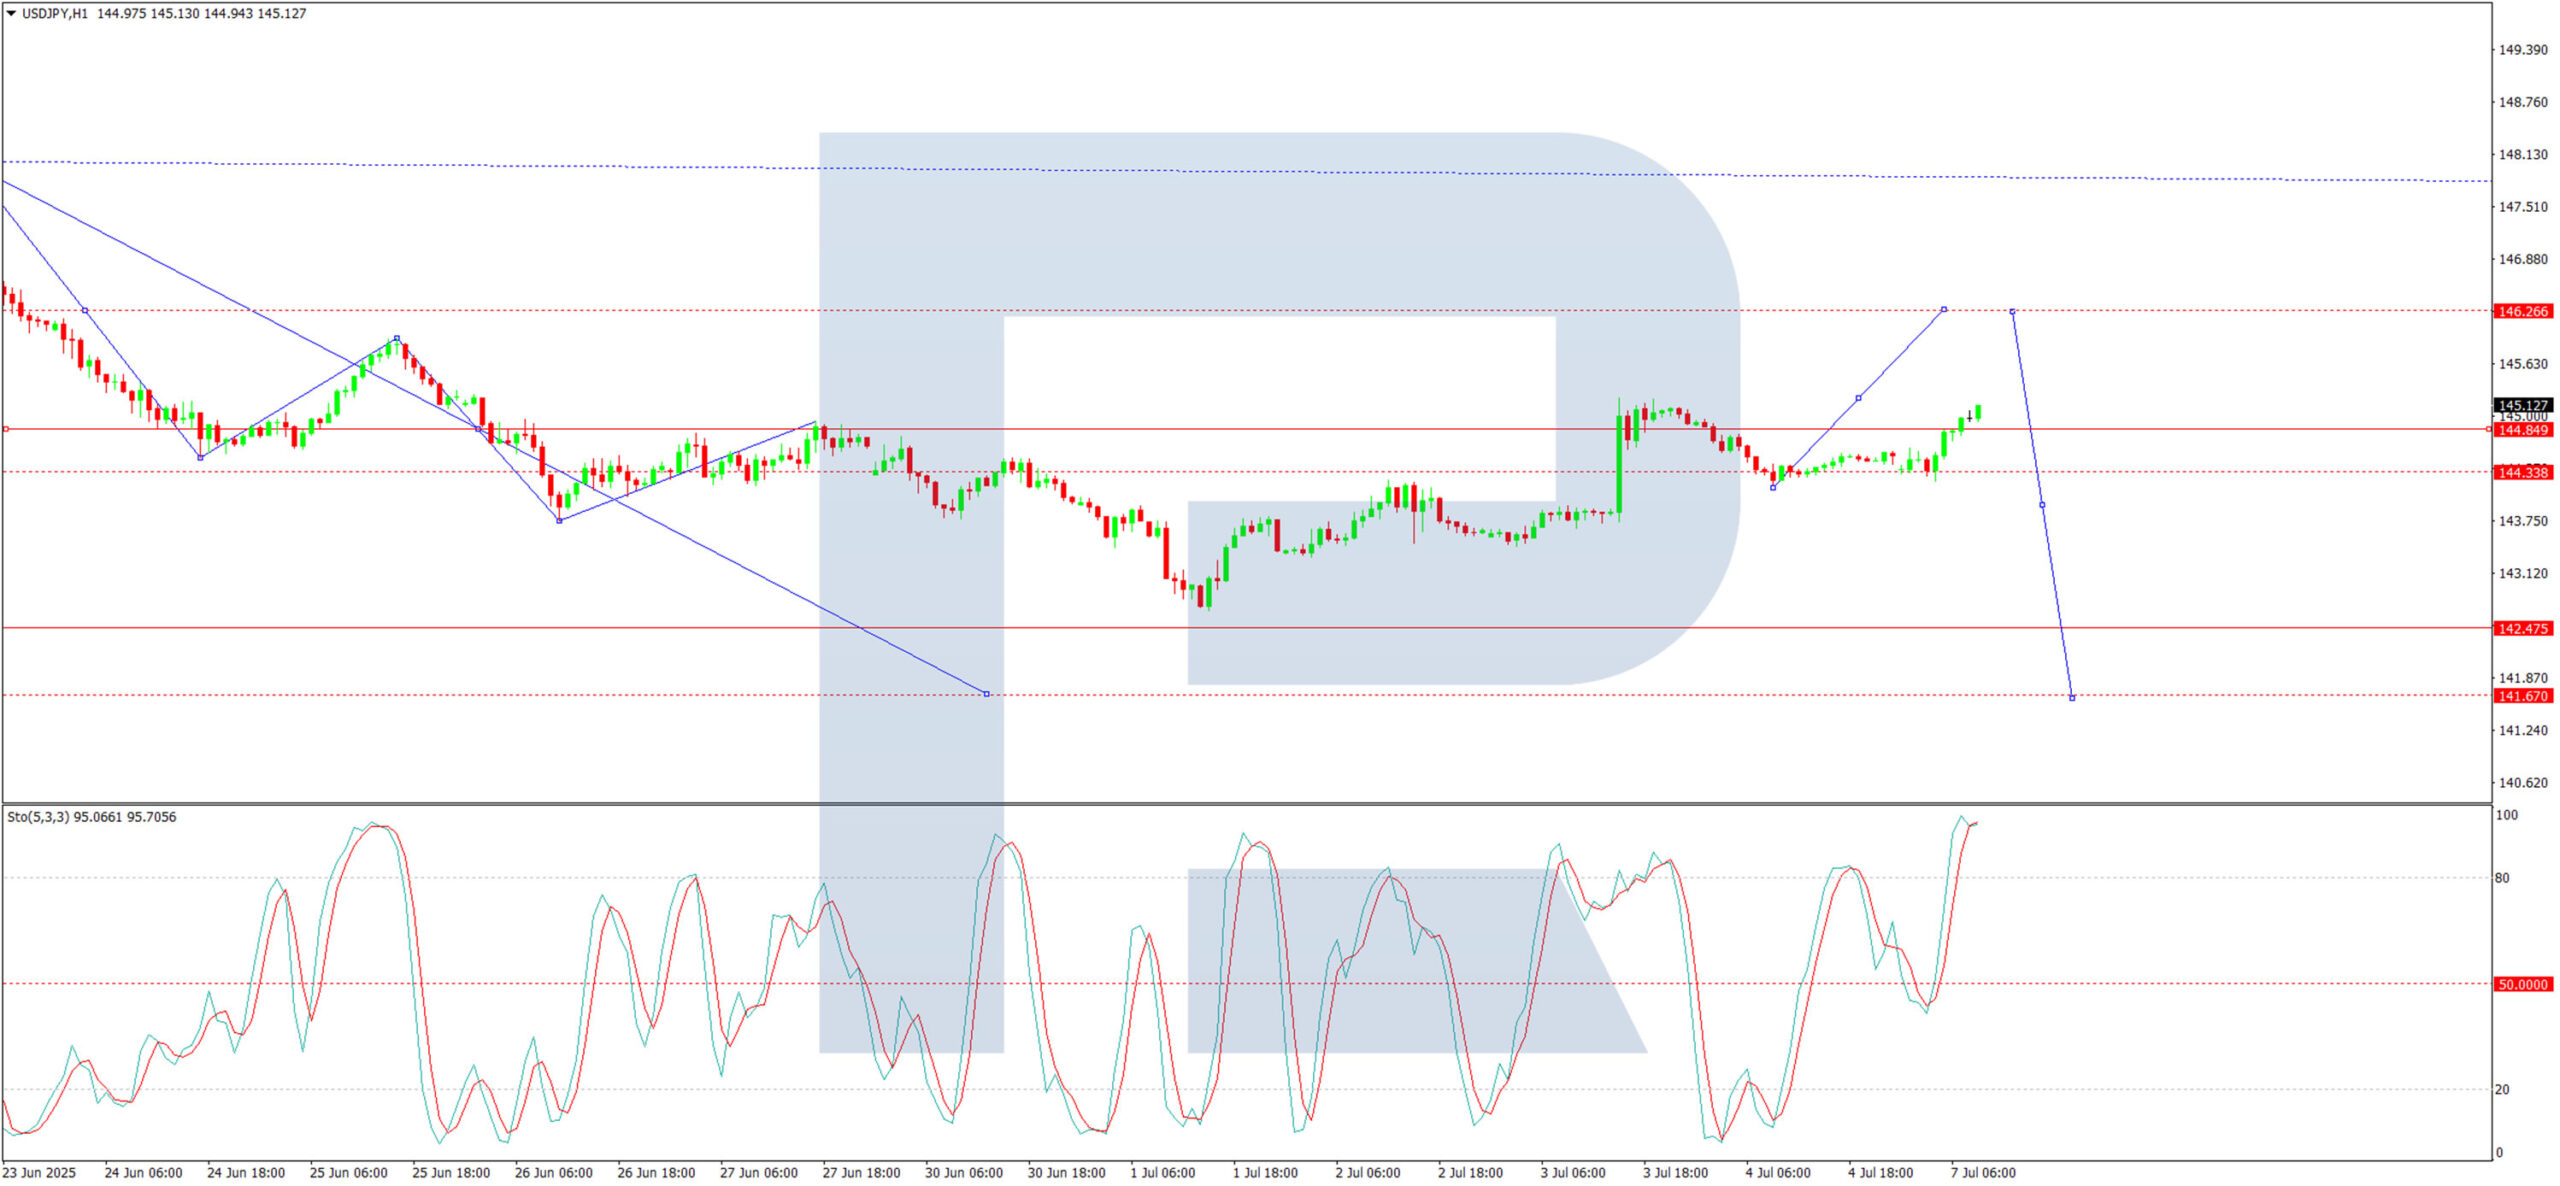
On the H1 chart, the pair corrected to 144.11 before resuming its upward trajectory, targeting 146.26. Upon reaching this level, we expect a new decline towards 143.90. A break below this level could extend losses to 141.70. The Stochastic oscillator aligns with this view, with its signal line currently at 80 and turning downward.
Conclusion
The yen’s weakness reflects subdued wage growth and lingering trade uncertainties, while technical indicators suggest potential volatility ahead.
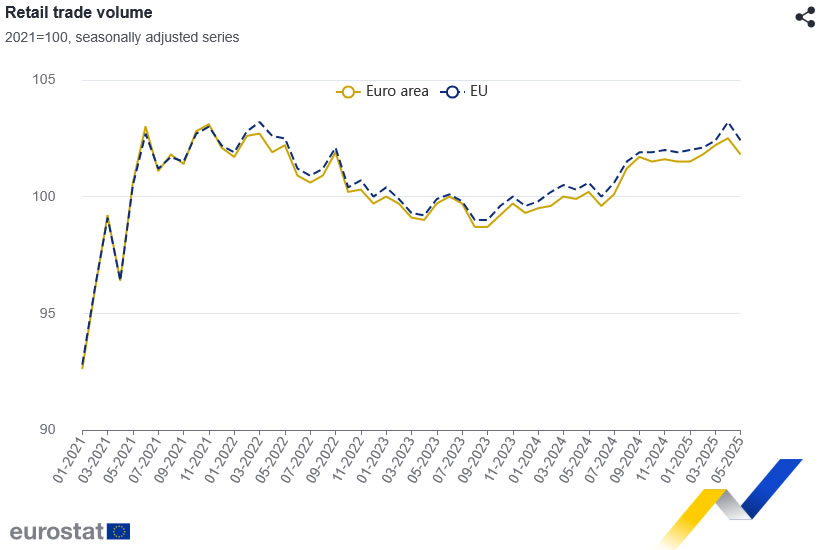
Eurozone retail sales fall -0.7% mom in May, EU down -0.8% mom
Eurozone retail sales volumes declined by -0.7% mom in May, slightly better than expectations for a -0.8% mom fall but still signaling weak consumer activity across the bloc. The decline was broad-based, with food, drinks and tobacco sales down -0.7% mom, non-food products (excluding fuel) off by -0.6% mom, and automotive fuel volumes sliding -1.3% mom.
Across the broader EU, retail volumes fell by 0.8% mom. National data showed particularly sharp declines in Sweden (-4.6%), Belgium (-2.5%), and Estonia (-2.2%), while Portugal, Bulgaria, and Cyprus bucked the trend with modest gains.
Trade Deal Deadline, OPEC + Hike. DAX Hovers at Key Confluence Area
Market participants were expecting an upbeat start to the week on the hope that trade deals might finally be announced as the Trump administration deadline of July 9 approaches. However, President Trump adopted a confrontational stance once more by announcing that the US will begin issuing tariff letters to countries as early as Monday.
There has been some mixed comments from the Trump administration though, with Commerce Secretary Lutnick saying tariffs are to take effect from August 1. Is this another case where the Trump administration will delay the implementation of tariffs or just miscommunication? I expect we will hear more as the day progresses.
Asian Market Wrap
Asian stocks, as measured by MSCI’s index, dropped 0.6%. U.S. Treasury prices went up, causing the 10-year yield to fall slightly to 4.33%. The Dollar index increased by 0.1%, while the Chinese Yuan weakened after Trump announced a 10% extra charge for people linked to the BRICS nations. He also said the U.S. will send out tariff notices and announce trade deals starting Monday at 12 PM ET.
Trade tensions are rising again as investors watch how negotiations between the U.S. and other countries progress before the July 9th deadline. Stocks have hit record highs, bouncing back from their April drop caused by earlier tariff announcements. This rebound is driven by hopes that the tariff deadline might be extended, as Trump often makes threats but later softens his stance.
Officials have previously said higher tariffs are set to start on August 1, but some countries might get extra time to negotiate. Treasury Secretary Bessent mentioned that a three-week delay could be offered to certain nations for further discussions.
OPEC + to Increase Production
OPEC+ agreed at a weekend meeting to raise production by 548,000 barrels per day (bpd) in August, up from the 411,000 bpd the group had approved for May, June and July, and 138,000 bpd for April.
The production boost will come from eight members of the group - Saudi Arabia, Russia, the United Arab Emirates, Kuwait, Oman, Iraq, Kazakhstan and Algeria.
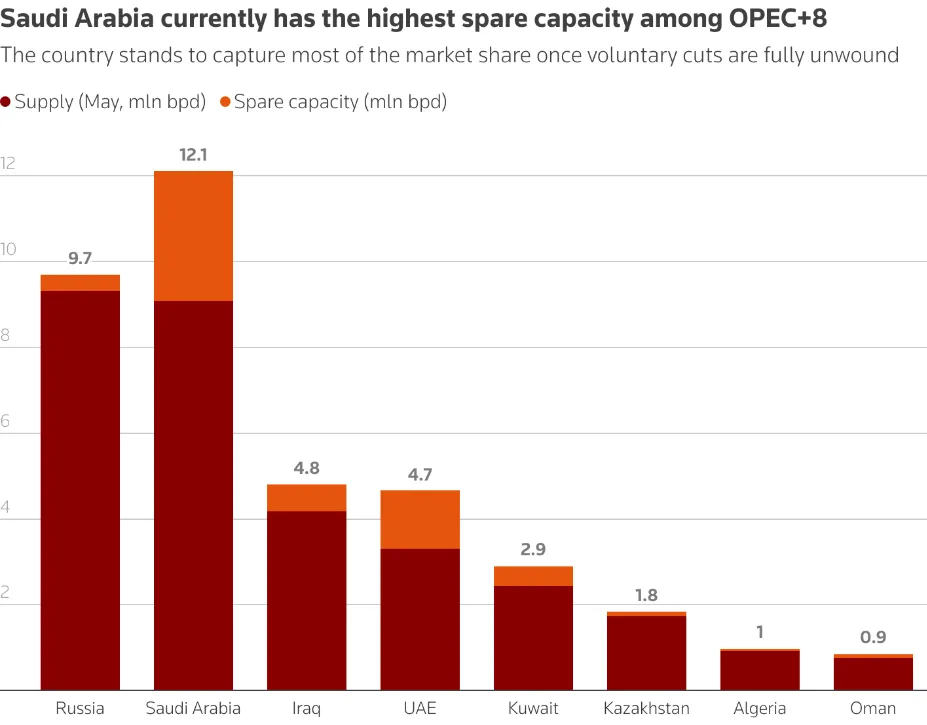
Source: HSBC Global Research, LSEG Workspace
OPEC+ said the decision was based on a "steady global economic outlook" and "healthy market conditions," continuing their message that the oil market is doing well.
Markets opened last night with Oil prices down around $1 from its Friday close before an Asian session recovery. It will be interesting to gauge how markets react in the European and US sessions to the OPEC + decision.
Until such a time that more information on trade deals is signed officially the rally in Oil prices may face hurdles and concerns which is likely to cap further gains.
European Open
European stock markets showed mixed results on Monday as investors kept an eye on news about U.S. President Donald Trump's upcoming tariff deadline.
The overall European STOXX 600 index stayed steady at 541.08 points.
Other major markets were mixed too: Germany's DAX rose 0.4%, France's CAC 40 fell 0.1%, Spain's IBEX went up 0.1%, and the UK's FTSE 100 dropped 0.2%.
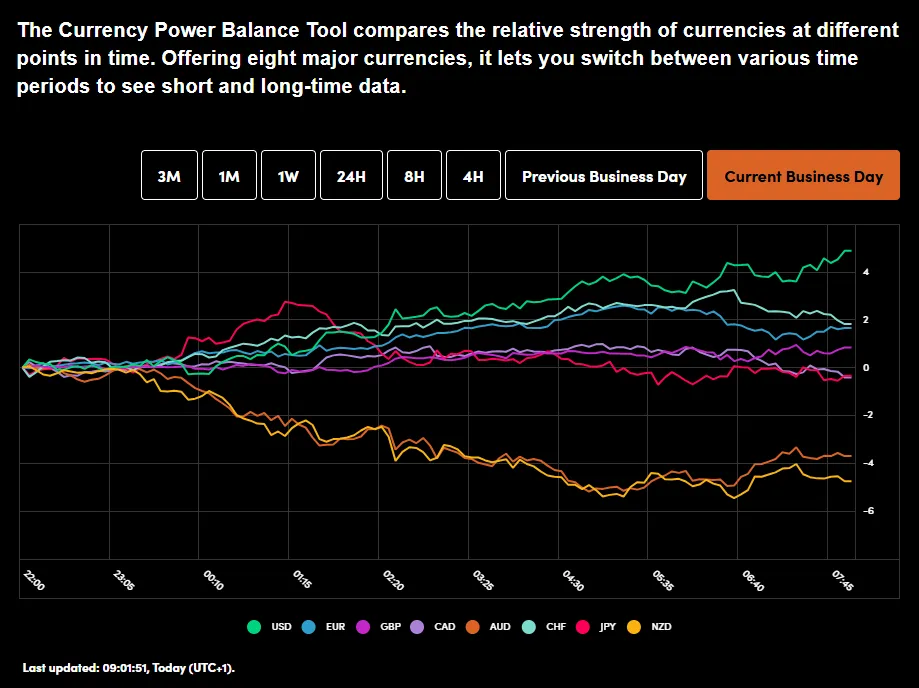
On the FX front, The U.S. dollar index, which compares the dollar to six other major currencies, rose 0.2% to 97.145. This is slightly above last Tuesday's low of 96.373, which was the weakest level in nearly 3.5 years.
The dollar dropped slightly to 0.7949 Swiss francs, while the euro fell 0.2% to 1.1767 but stayed near its July 1 high of $1.1829, the strongest since September 2021.
The U.S. dollar also gained 0.3% against both the Canadian dollar and the Mexican peso, reaching 1.3640 and 18.6548 pesos, respectively.
Currency Power Balance
Source: OANDA Labs
Economic Data Releases and Final Thoughts
Looking at the economic calendar, which is a bit quieter this week for both the US and EU this week.
There is Euro Area retail sales due out in a short while and German CPI on Thursday.
The main focus this week will be on trade deal developments as the tariff deadline looms large. Clarity will also be sought on the different dates being discussed with the August 1 date being mentioned more regularly in the last few days.
US officials may want to announce some deals on July 9 which will come into effect on August 1 and this would in turn give other countries time to strike a deal.
It will be intriguing to see how this develops over the course of the day and week as this could be the major driving force behind volatility this week.
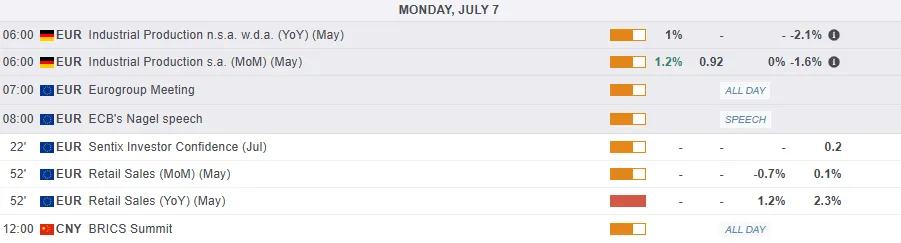
For all market-moving economic releases and events, see the MarketPulse Economic Calendar. (click to enlarge)
Chart of the Day - DAX Index
From a technical standpoint, European stocks have been in a Limbo the last few weeks while US stocks have continued their ascent.
Much of this ha been down to the ongoing tit-for-tat between the EU and US regarding a potential trade deals.
As the deadline approaches will the news provide a short in the arm for the DAX Index.
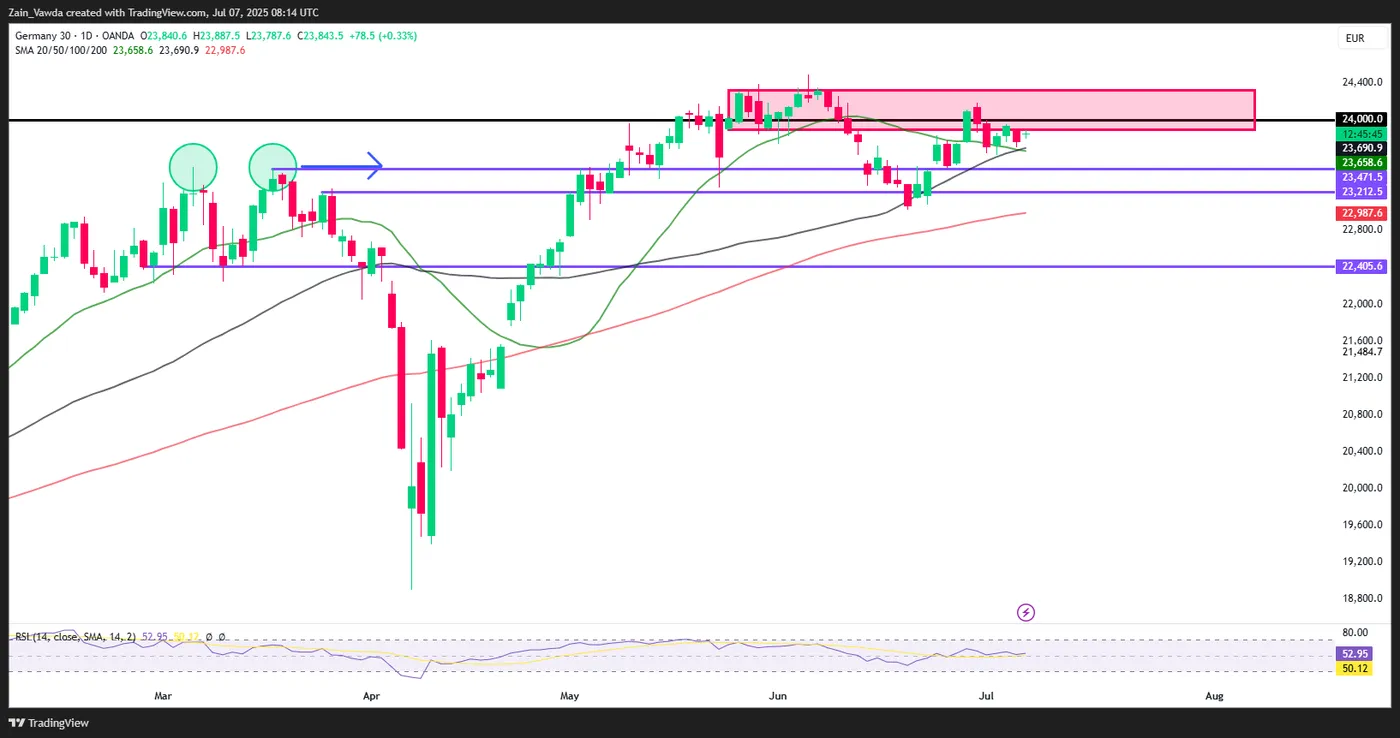
The DAX is hovering just shy of the 24000 handle on a key confluence area which is providing support.
The price range between 23700 and 23650 hosts both the 20 and 50-day MAs and could be a key support zone if bears wish to push prices even lower.
If this level holds bulls may fancy their chances of a bigger move to the upside.
DAX Daily Chart, July 17. 2025
Source: TradingView.com (click to enlarge)
Support
- 23700
- 23471
- 23212
Resistance
- 24000
- 24144
- 24340
Eurozone Sentix rises to 4.5, recovery gaining momentum, ECB may pause cuts
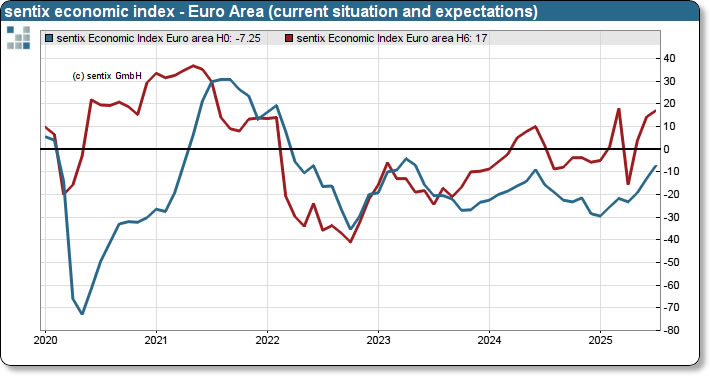
Eurozone’s Sentix Investor Confidence Index rose from 0.2 to 4.5 in July, its highest since February 2022. The improvement was broad-based: Current Situation Index climbed from -13.0 to -7.3, and Expectations strengthened from 14.3 to 17.0. This marks the third consecutive gain across all components—fulfilling what Sentix calls the “triple rule” for identifying an economic turning point.
“The July data indicate a sustained upturn,” Sentix noted, adding that the recovery is now gaining in breadth. This aligns with recent data showing stabilization in business activity and firming consumer sentiment, suggesting that the bloc may be entering a more durable phase of expansion after years of stagnation.
Meanwhile, the improving sentiment is likely to narrow ECB’s scope for further rate cuts. Sentix’s policy barometer, released alongside the economic index, suggests that monetary policy will remain in a "comfort zone" rather than pivot toward aggressive easing.
GBP/USD Dips as EUR/GBP Accelerates Higher
GBP/USD failed to climb above 1.3800 and corrected some gains. EUR/GBP is rising and might climb above the 0.8670 resistance.
Important Takeaways for GBP/USD and EUR/GBP Analysis Today
- The British Pound is showing bearish signs below the 1.3700 support against the US dollar.
- There is a key bearish trend line forming with resistance near 1.3650 on the hourly chart of GBP/USD at FXOpen.
- EUR/GBP is gaining pace and trading above the 0.8600 zone.
- There was a break above a contracting triangle with resistance at 0.8630 on the hourly chart at FXOpen.
GBP/USD Technical Analysis
On the hourly chart of GBP/USD at FXOpen, the pair failed to stay above the 1.3750 pivot level. As a result, the British Pound started a fresh decline below 1.3720 against the US Dollar.
There was a clear move below 1.3700 and the 50-hour simple moving average. The bears pushed the pair below 1.3650. Finally, there was a spike below the 1.3600 support zone. A low was formed near 1.3562 and the pair is now consolidating losses.
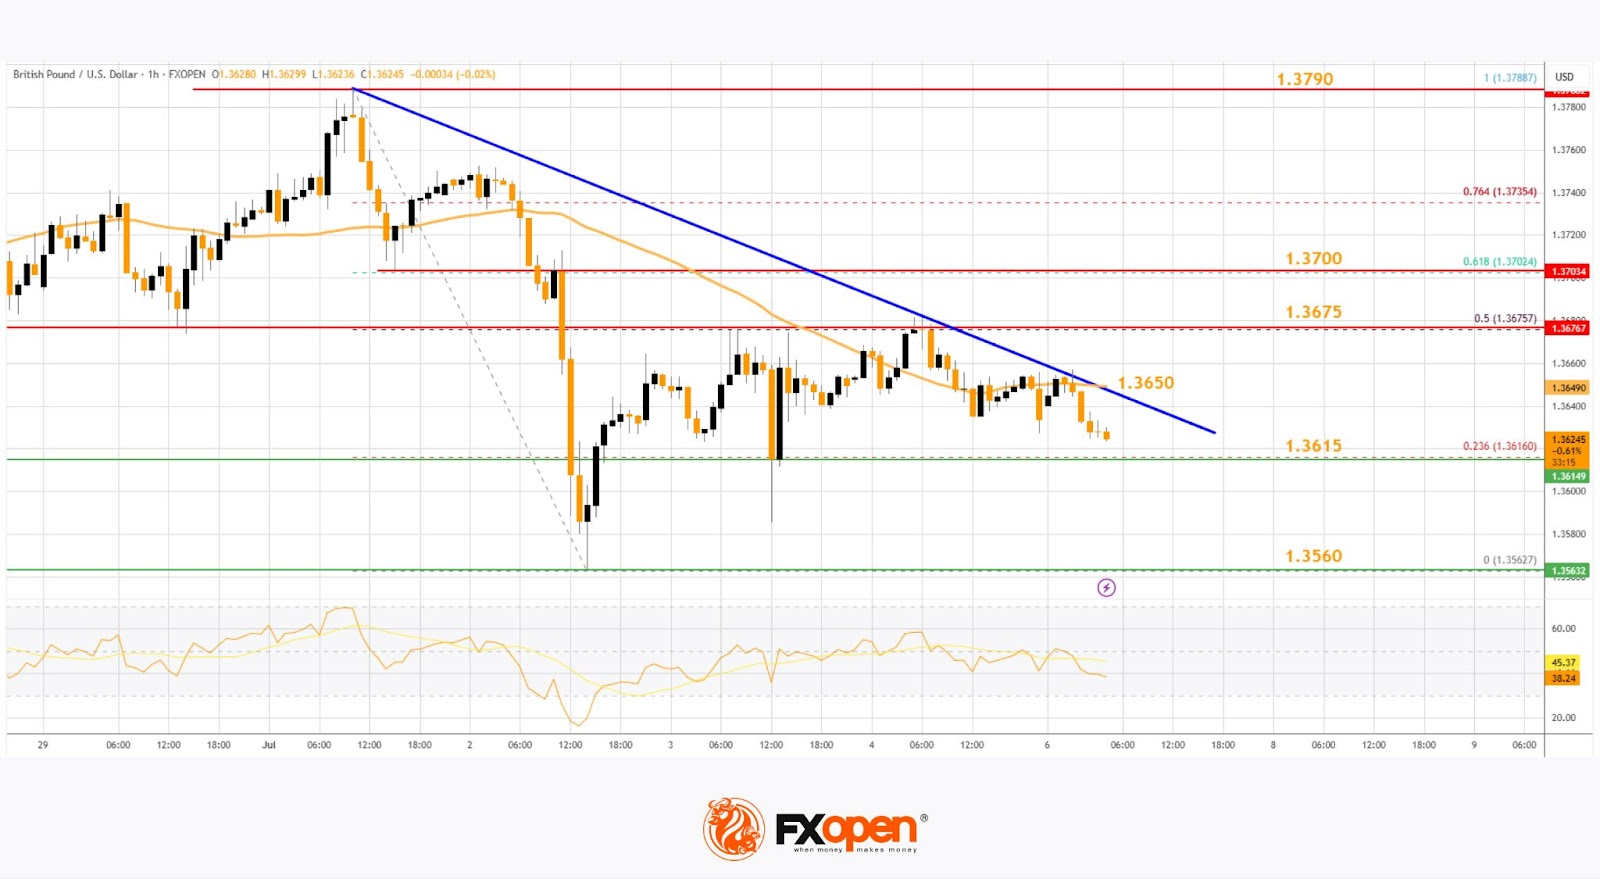
There was a minor move above the 1.3615 level. On the upside, the GBP/USD chart indicates that the pair is facing resistance near the 1.3650 level. There is also a key bearish trend line forming with resistance near 1.3650.
The next major resistance is near the 50% Fib retracement level of the downward move from the 1.3788 swing high to the 1.3562 low at 1.3675. A close above the 1.3670 resistance zone could open the doors for a move toward the 1.3700 zone. The 61.8% Fib retracement level is at 1.3700. Any more gains might send GBP/USD toward 1.3790.
On the downside, there is a key support forming near 1.3615. If there is a downside break below the 1.3615 support, the pair could accelerate lower. The next major support is near the 1.3560 zone, below which the pair could test 1.3500. Any more losses could lead the pair toward the 1.3440 support.
EUR/GBP Technical Analysis
On the hourly chart of EUR/GBP at FXOpen, the pair started a decent increase from the 0.8500 zone. The Euro traded above the 0.8580 resistance level to enter a positive zone against the British Pound.
The pair settled above the 50-hour simple moving average and 0.8620. It traded as high as 0.8670 before a downside correction. There was a move below the 23.6% Fib retracement level of the upward move from the 0.8507 swing low to the 0.8670 high.
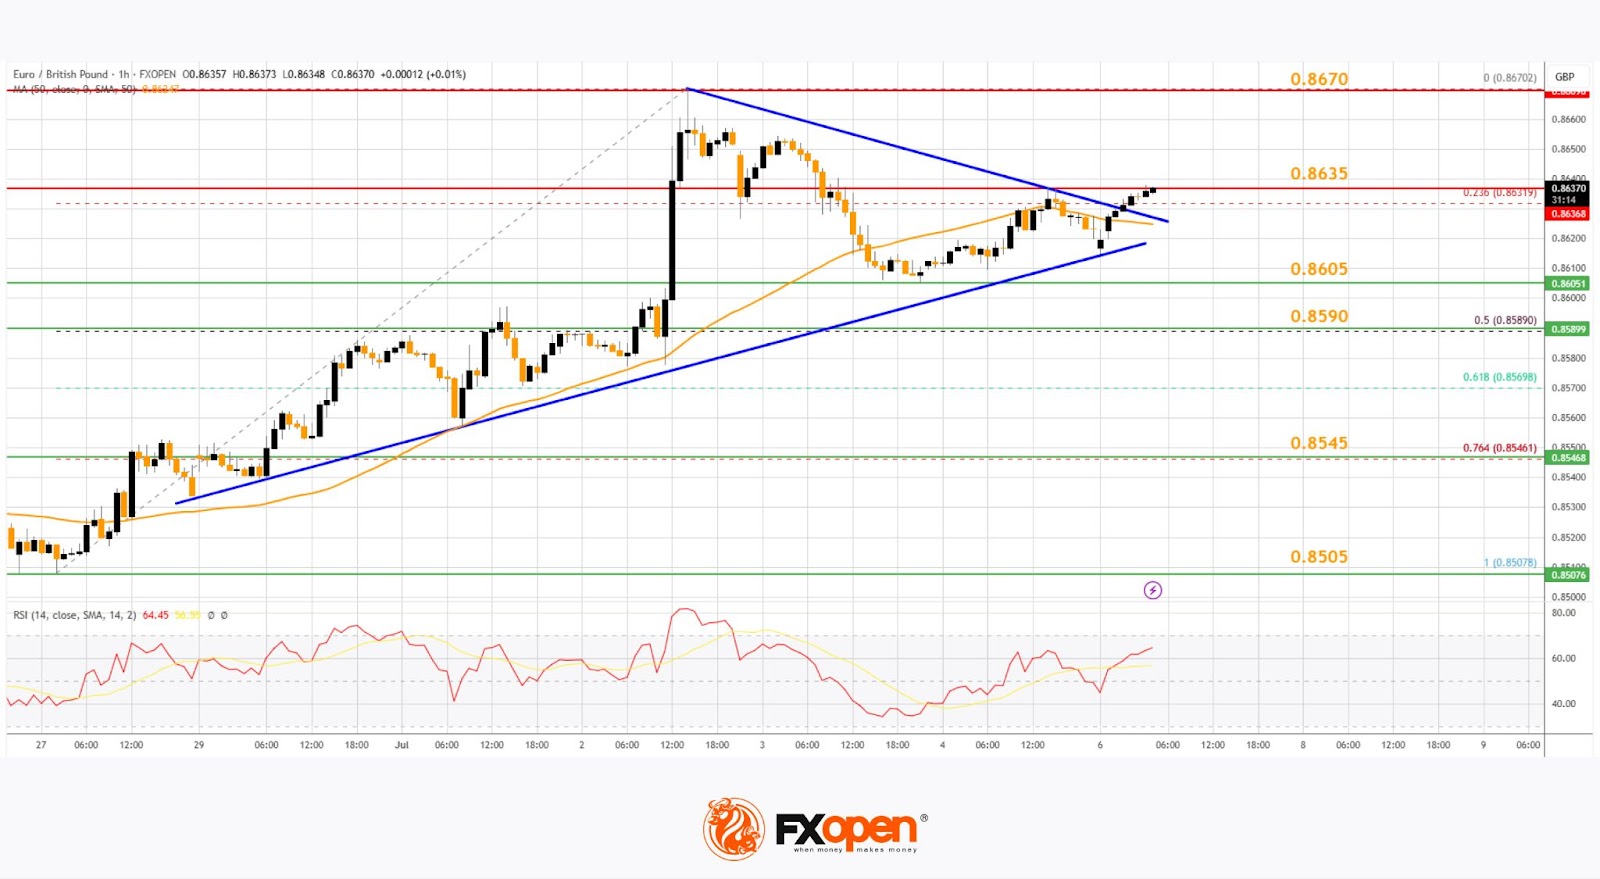
However, the pair is stable above the 0.8600 support zone. The next major support is near the 50% Fib retracement level of the upward move from the 0.8507 swing low to the 0.8670 high at 0.8590.
A downside break below 0.8590 might call for more downsides. In the stated case, the pair could drop toward the 0.8545 support level. Any more losses might call for an extended drop toward the 0.8505 pivot zone.
The EUR/GBP chart suggests that the pair is facing resistance near the 0.8635 zone. A close above the 0.8635 level might accelerate gains. In the stated case, the bulls may perhaps aim for a test of 0.8670. Any more gains might send the pair toward the 0.8700 level.
Trade over 50 forex markets 24 hours a day with FXOpen. Take advantage of low commissions, deep liquidity, and spreads from 0.0 pips. Open your FXOpen account now or learn more about trading forex with FXOpen.
This article represents the opinion of the Companies operating under the FXOpen brand only. It is not to be construed as an offer, solicitation, or recommendation with respect to products and services provided by the Companies operating under the FXOpen brand, nor is it to be considered financial advice.
EUR/USD Analysis: US Dollar Strengthens at the Start of the Week
On 2 July, on the EUR/USD chart, we noted that the rally—during which the pair had gained more than 6% since mid-May—was under threat, citing several technical signals, including:
→ proximity of the price to the upper boundary of the ascending channel;
→ overbought conditions on the RSI indicator;
→ nearby resistance from the Fibonacci Extension levels, around 1.18500.
Trading at the start of the week points to renewed US dollar strength. This became particularly evident with the opening of the European session, which triggered a decline in EUR/USD to the 1.17500 area.
It is reasonable to assume that the dollar’s strength against the euro is linked to early-week positioning by traders, who are anticipating news regarding US trade agreements.
According to Reuters, the United States is close to finalising several trade deals in the coming days and is expected to notify 12 other countries today about higher tariffs.
EUR/USD Technical Chart Analysis
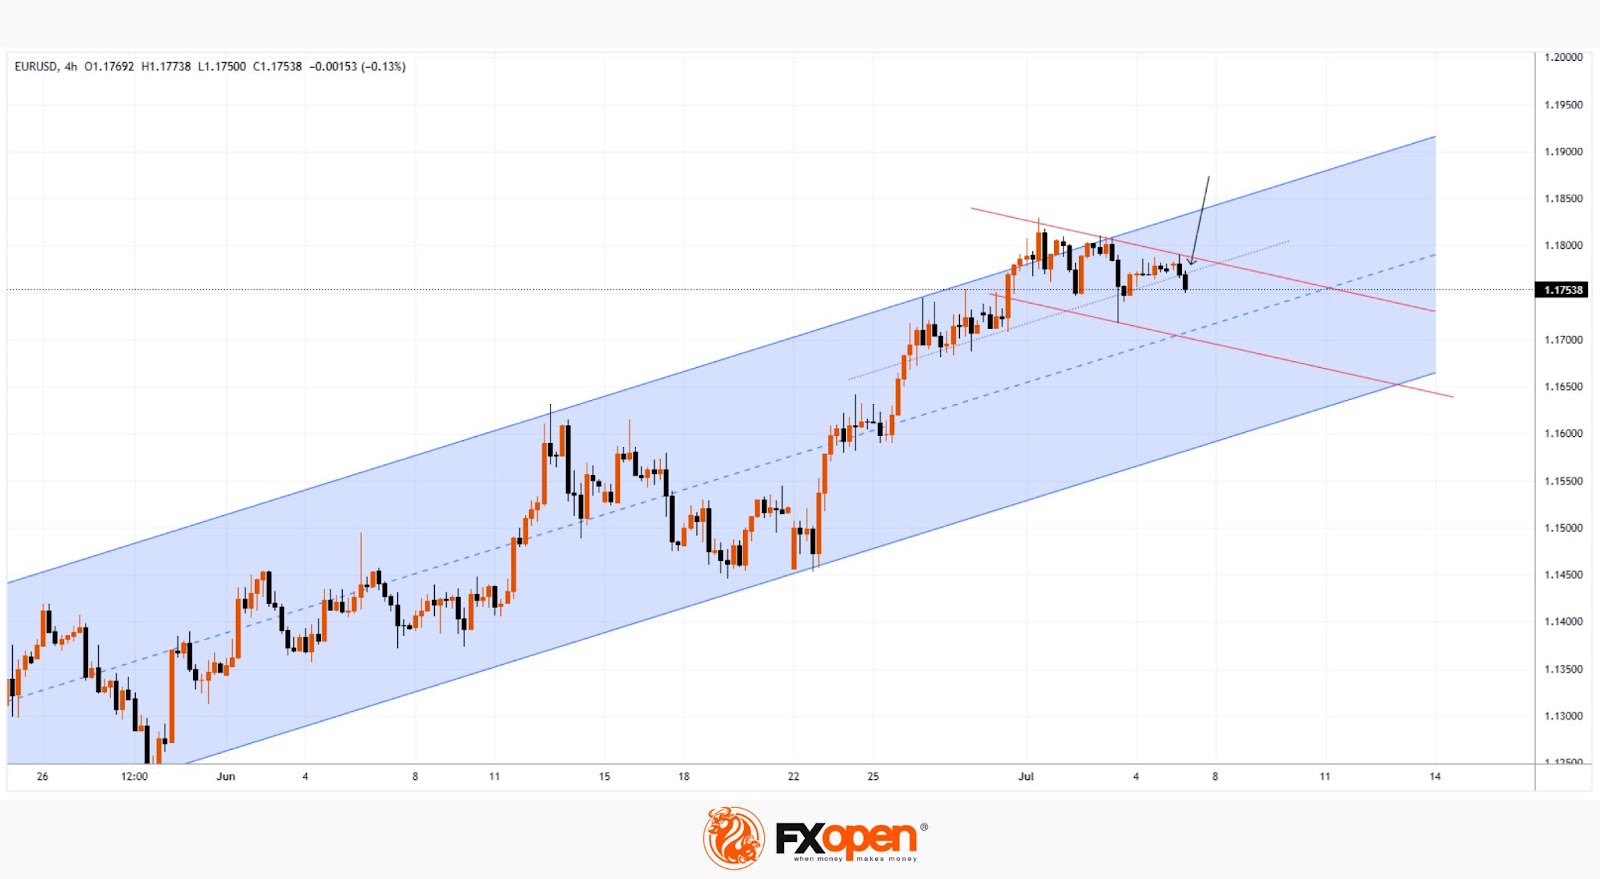
The ascending channel established last week remains in play, with the following developments:
→ a dashed midline within the upper half of the channel has been breached by bearish pressure (as indicated by the arrow);
→ a series of lower highs in recent sessions suggests the formation of a downward trajectory, within which the price could move towards the channel median—or potentially test its lower boundary.
P.S. In the longer term, analysts at Morgan Stanley maintain a bullish outlook, forecasting that EUR/USD could rise to 1.2700 by the end of 2027.
Trade over 50 forex markets 24 hours a day with FXOpen. Take advantage of low commissions, deep liquidity, and spreads from 0.0 pips. Open your FXOpen account now or learn more about trading forex with FXOpen.
This article represents the opinion of the Companies operating under the FXOpen brand only. It is not to be construed as an offer, solicitation, or recommendation with respect to products and services provided by the Companies operating under the FXOpen brand, nor is it to be considered financial advice.
Nasdaq 100: Bearish Signals Near All-Time High
As the 4-hour chart of the Nasdaq 100 (US Tech 100 mini on FXOpen) shows, the index reached a new all-time high last week. However, the price action suggests that the current pace of growth may not last.
Last week’s strong labour market data triggered a significant bullish impulse. However, the upward momentum has been entirely retraced (as indicated by the arrows).
The tax cut bill signed on Friday, 4 July, by Trump — which is expected to lead to a significant increase in US government debt — contributed to a modest bullish gap at today’s market open. Yet, as trading progressed during the Asian session, the index declined.
This suggests that fundamental news, which could have served as bullish catalysts, are failing to generate sustainable upward movement — a bearish sign.
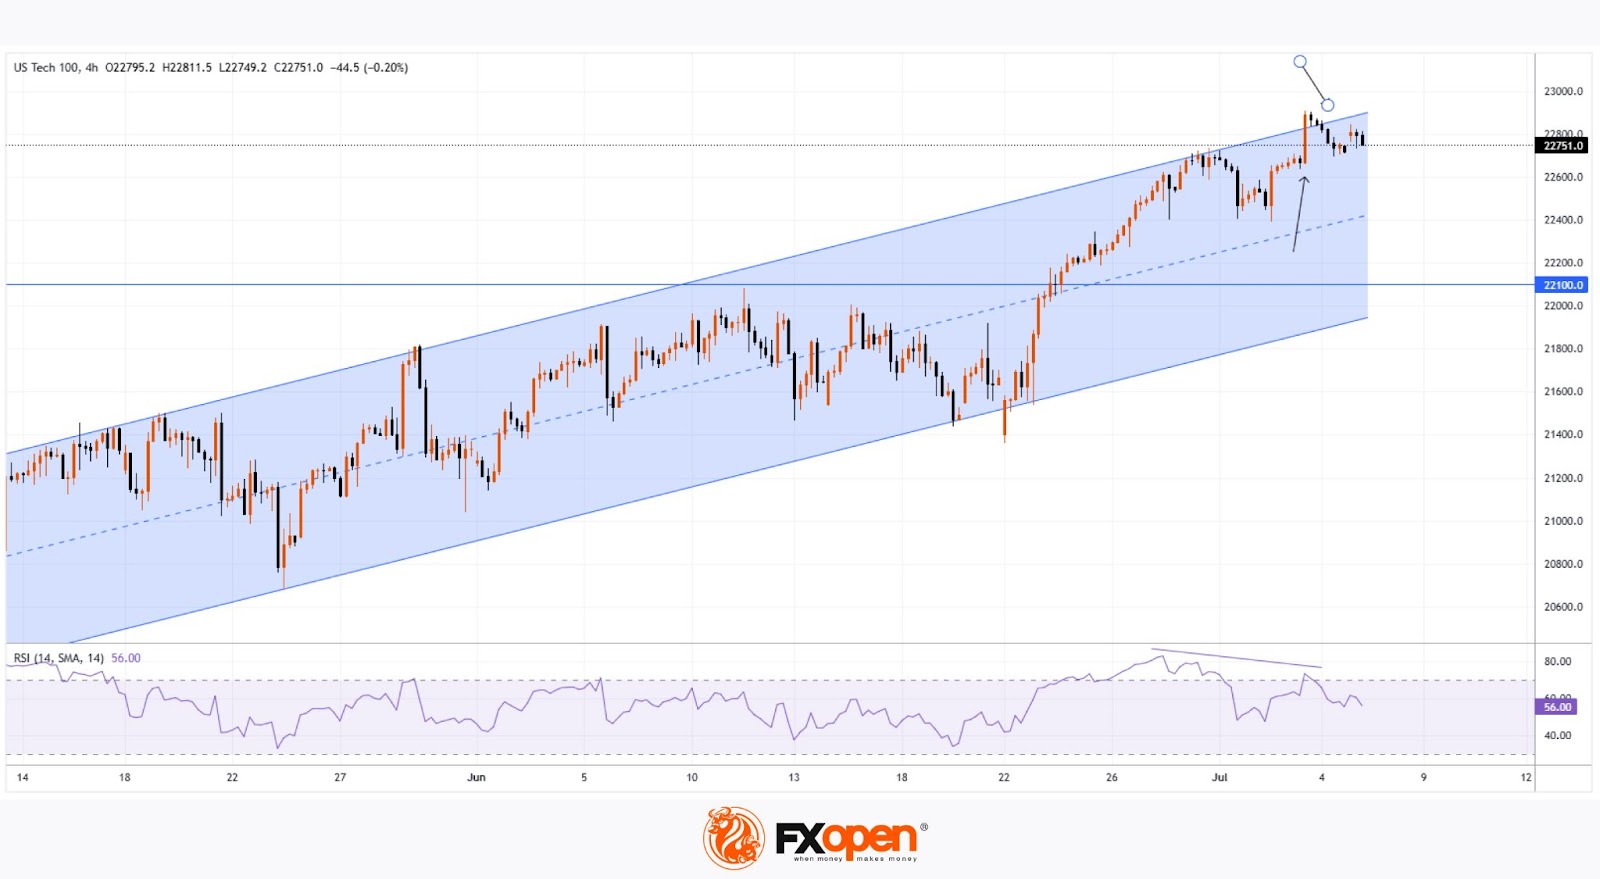
Further grounds for doubt regarding the index's continued growth are provided by technical analysis of the Nasdaq 100 (US Tech 100 mini on FXOpen) chart, specifically:
→ a bearish divergence on the RSI indicator;
→ price proximity to the upper boundary of the ascending channel, which is considered resistance.
It is reasonable to suggest that the market may be overheated and that bullish momentum is waning. Consequently, a correction may be forming — potentially involving a test of the 22,100 level. This level acted as resistance from late 2024 until it was broken by strong bullish momentum in late June.
Trade global index CFDs with zero commission and tight spreads. Open your FXOpen account now or learn more about trading index CFDs with FXOpen.
This article represents the opinion of the Companies operating under the FXOpen brand only. It is not to be construed as an offer, solicitation, or recommendation with respect to products and services provided by the Companies operating under the FXOpen brand, nor is it to be considered financial advice.
Tariff Uncertainty Weighs on Asia Equities; Gold, Oil Slip as US Dollar Rebounds
Most major Asia Pacific equity indices started the week on a weaker note, as investors turned cautious ahead of the expiration of the White House’s 90-day pause on higher global reciprocal tariffs (excluding China), scheduled for Wednesday, 9 July.
Asia Pacific equities (except Singapore) weaken as tariff uncertainty looms
Japan’s Nikkei 225 slipped 0.6% to 39,576, while Hong Kong’s Hang Seng Index edged 0.3% lower to 23,845, though it remained above its 50-day moving average near 23,330. US equity futures were also under pressure, with both the S&P 500 and Nasdaq 100 E-mini contracts declining 0.5% during Asia trading hours. Bucking the regional trend, Singapore’s Straits Times Index rose 0.3% to notch a fresh all-time intraday high of 4,026.
Conflicting tariff signals from the White House
Confusion surrounding the tariff timeline added to market jitters. Commerce Secretary Lutnick indicated that the higher tariffs would be implemented from 1 August, suggesting room for a deadline extension. However, President Trump stated over the weekend that formal letters announcing tariff hikes would be sent out on Monday and Tuesday, ahead of the 9 July deadline.
US dollar gains; commodity currencies underperform
The US Dollar Index rebounded 0.2% to 97.15 but remained capped by its 20-day moving average near 97.85. In today’s Asian session, the Japanese yen (-0.4%), Australian dollar (-0.6%), and New Zealand dollar (-0.7%) were the weakest performers against the greenback.
Gold and Oil retreat
Gold (XAU/USD) slipped 0.8% intraday to US$3,310, falling below its 50-day moving average at US$3,320. West Texas Intermediate (WTI) crude oil extended last week’s losses, down 0.4% to US$66.85 per barrel, breaching its 200-day moving average at US$69.15. The decline was driven by oversupply concerns after OPEC+ agreed to increase August production by 548,000 barrels per day, well above market expectations of 411,000 barrels.
Economic data releases
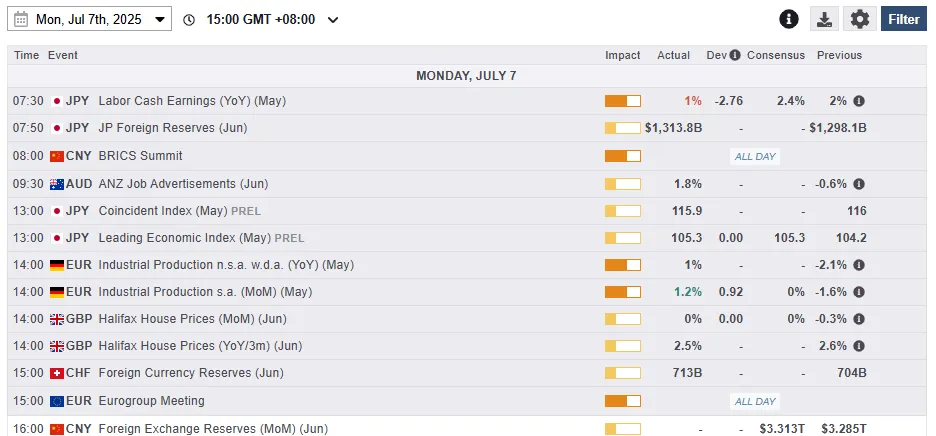
Fig 1: Key data for today’s Asia mid-session (Source: MarketPulse)
Chart of the day – GBP/USD at risk of breaking below 20-day moving average
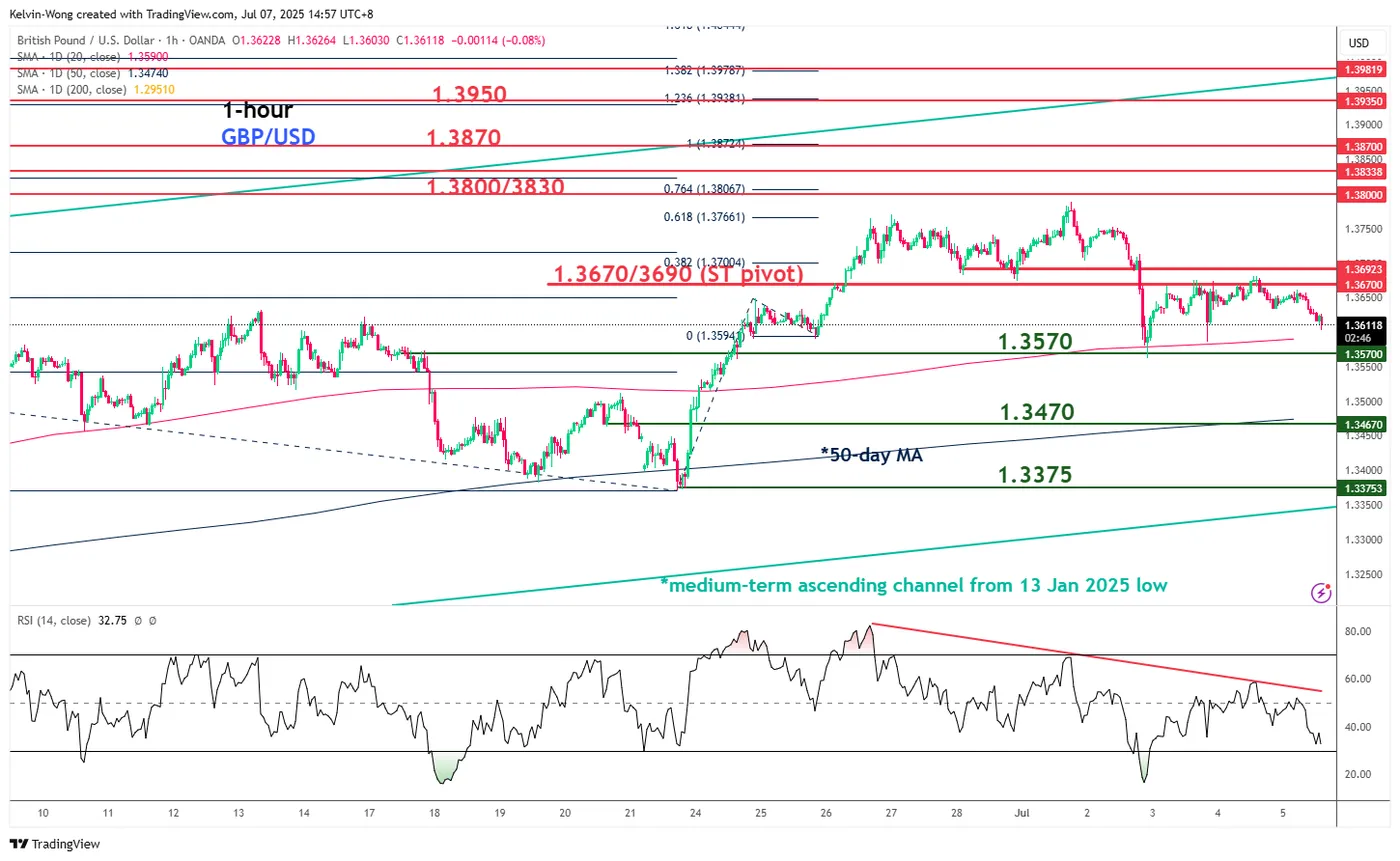
Fig 2: GBP/USD minor trend as of 7 July 2025 (Source: TradingView)
The GBP/USD has failed to make any significant recoveries since last Wednesday, 7 July, dramatic intraday decline of -150 pips to a 6-day low of 1.3563 on the onset of a possible replacement of UK Chancellor Reeves.
Thereafter, the sterling pound has managed to bounce after a retest at 1.3570 (also the 20-day moving average) against the US dollar, but the hourly RSI momentum indicator has continued to flash out bearish momentum conditions since 4 July (see Fig 2).
These observations suggest a potential minor corrective decline sequence within its medium-term uptrend phase. Watch the 1.3670/3690 key short-term pivotal resistance, and a break below 1.3570 exposes the next intermediate support at 1.3470 (also the 50-day moving average)
On the flip side, a clearance above 1.3690 invalidates the bearish scenario to kickstart another bullish impulsive up move sequence for the next intermediate resistances to come in at 1.3800/3830 and 1.3870.
Markets Trying to Cope With Multiple Layers of Uncertainty
Markets
With US markets closed for Independence Day and little in the way of important data, European markets couldn’t but take a cautious approach going into the weekend. With the US budget (One Big Beautifull Bill act) approved in Congress, the focus evidently turned the US July 9 tariff deadline. Markets recently balanced between hope and doubt. Without any guidance from US markets, doubt dominated European trading. The EuroStoxx50 ceded 1.02%. European bond markets showed a mild safe haven bid, with German yields trading between little changed (30-y) and -1.8 bps (2-y). ECB’s Villeroy again elaborated on the risk of inflation undershooting the target. However, for now markets understand that in current context of low visibility on trade/global growth, there is little reason to aggressively front run on additional ECB easing beyond the 1.75% cycle low that is currently discounted for the turn of the year. On FX markets the dollar (DXY) gained marginally (97.2) extending a tentative bottoming out process post Thursday’s ‘better-than-expected’ payrolls. Still EUR/USD closed slightly higher at 1.1778.
This morning, markets are trying to cope with multiple layers of uncertainty as the US will move to the next phase in imposing trade tariffs. President Trump is sending letters to (about) 12(+?) countries informing them on the higher tariffs they will face. However, US Treasury secretary Bessent indicated that these tariffs will start on August 1, providing some space for trading partners to do concessions. At the same time, the US still also intends to announce some ‘finalized’ (frame)work trade agreements. This set-up in a first instance leaves markets with plenty of uncertainty. Will August 1 become a next informal deadline? Which countries will get higher tariffs? Will they in some cases even go higher than the top tariffs announced on April 2? This morning, US president Trump even added a new layer of uncertainty as he threatened countries aligning with ‘anti-American policies of BRICS’ with an additional 10% tariff. However, the US president didn’t specify what this ‘alignment’ exactly contains. One can assume a series of unexpected ‘plot twists’ over the coming hours/days, which are impossible to anticipate. Markets this morning are starting the week with something between paralysis and a guarded risk off. Most Asian equities are trading with modest losses (<1.0%) and so do US equity futures. US Treasuries rise with yields declining about 2.5 bps at the short end of the curve. Even after last week’s payrolls apparently are still pondering the chances of a restart of the Fed easing cycle if the US data were to weaken later this year. The dollar gains marginally. The currencies of countries that face higher tariffs might be vulnerable in a fist stage. Even so, the post April 2 experience in mind, we assume that a broad-based USD rebound will be difficult in a context of US induced trade-protectionism. Aside from the trade storyline, the eco calendar this week contains few important (US) eco data. The Reserve Bank of Australia (Tuesday) and the Reserve Bank of New Zealand (Wednesday) will decide on policy. Post the OBBB, we also keep a close eye on the first series of US Treasury auctions (3-y Tuesday; 10-y Wednesday, 30-y Thursday).
News & Views
Saudi Arabia will raise the price of its Arab light crude for Asian customers by more than expected in August. The price will trade $2.2 a barrel above the regional (Oman/Dubai) benchmark. The move is seen as the country being confident that the oil market is strong enough to take up the additional supplies the Saudi-led OPEC+ group is bringing. The oil cartel over the weekend agreed to add 548k barrels a day next month, an even bigger output hike than in each of the three previous months (411k). Brent oil gapped lower at the open this morning and is currently trading for $67.9 a barrel.
Rating agency Moody’s said Japan’s upcoming upper house election July 20th would be an important one for the country’s fiscal health and credit ratings if they end up in new tax cuts. The elections are crucial for prime minister Ishiba after his ruling Liberal Democratic Party and the coalition partner Komeito lost their majority in the lower house after a snap poll in October last year. Among the campaign pledges are cash handouts to help households cope with inflation. But the government so far resisted calls from opposition parties for tax cuts. Moody’s said these could be a negative for its current A1 rating (with stable outlook, since December 2014), depending on how large and long-lasting they are.