Sample Category Title
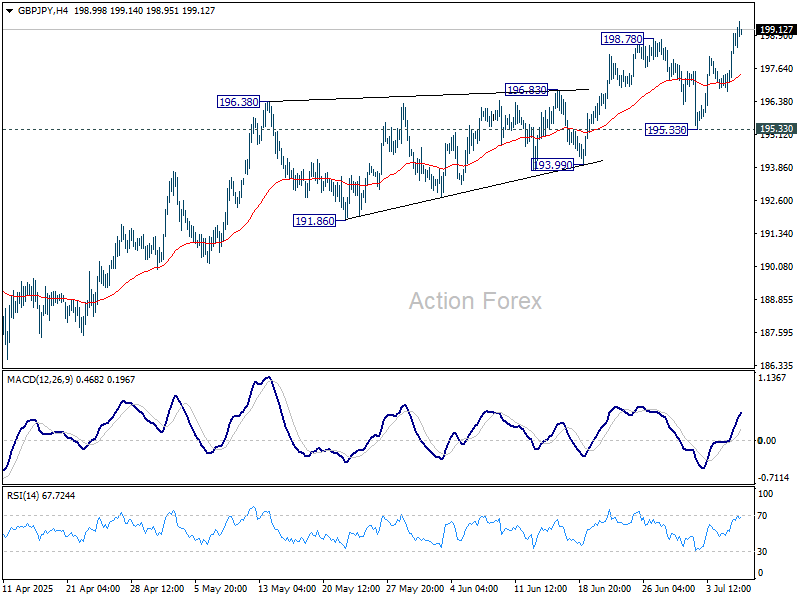
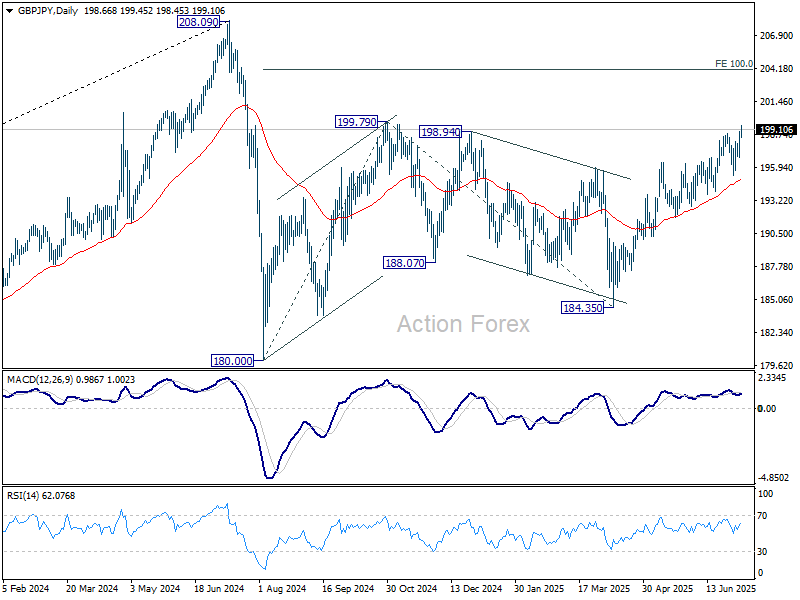
GBP/JPY Daily Outlook
Daily Pivots: (S1) 197.30; (P) 198.15; (R1) 199.52; More...
GBP/JPY's rally from 184.35 resumed by breaking through 198.78 and intraday bias is back on the upside. Firm break of 199.79 resistance will target 100% projection of 180.00 to 199.79 from 184.35 at 204.14 next. For now, near term outlook will stay bullish as long as 195.33 support holds, in case of retreat.
In the bigger picture, price actions from 208.09 (2024 high) are seen as a correction to rally from 123.94 (2020 low). The pattern might still extend with another falling leg. But in that case, strong support should be seen from 38.2% retracement of 123.94 to 208.09 at 175.94 to contain downside. Meanwhile, decisive break of 208.09 will confirm long term up trend resumption.
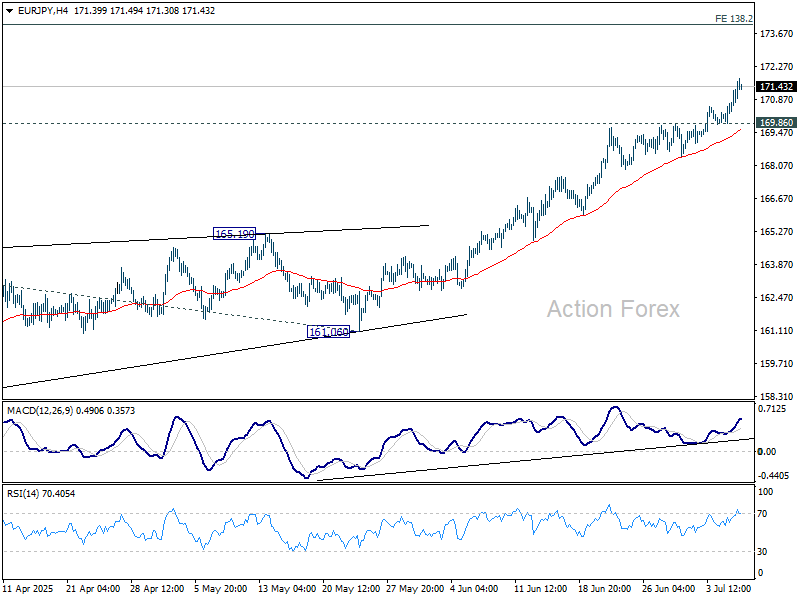
EUR/JPY Daily Outlook
Daily Pivots: (S1) 170.17; (P) 170.74; (R1) 171.61; More...
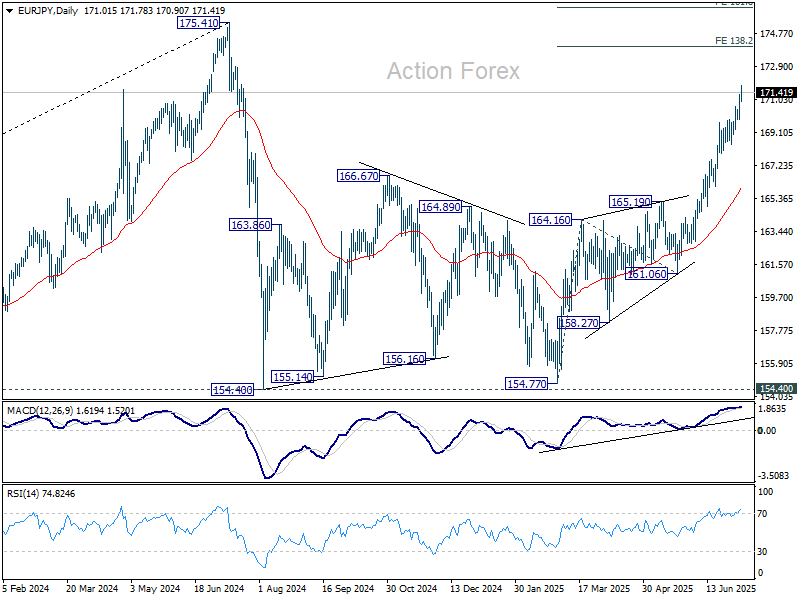
EUR/JPY's rally continues today and intraday bias stays on the upside. Next target is 138.2% projection of 154.77 to 164.16 from 161.06 at 174.03. On the downside, below 169.86 minor support will turn intraday bias neutral first.
In the bigger picture, price actions from 175.41 (2024 high) are seen as correction to up trend from 114.42 (2020 low). The pattern might still extend with another falling leg. But in that case, strong support should be seen from 38.2% retracement of 114.42 to 175.41 at 152.11 to contain downside. Meanwhile, decisive break of 175.41 will confirm long term up trend resumption.
EUR/AUD Daily Outlook
Daily Pivots: (S1) 1.7963; (P) 1.8030; (R1) 1.8109; More...
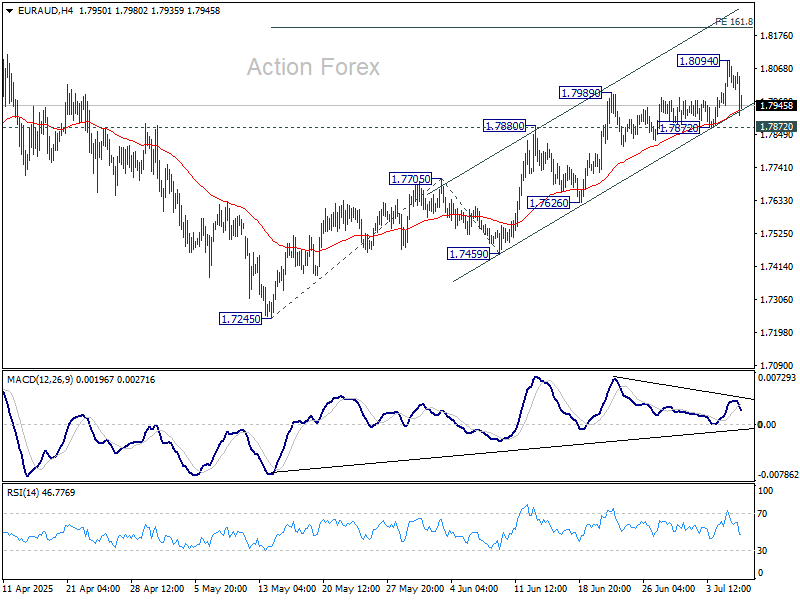
Intraday bias in EUR/AUD is turned neutral again with current retreat. Further rally is expected as long as 1.7872 support holds. Above 1.8094 will target 161.8% projection of 1.7245 to 1.7705 from 1.7459 at 1.8203. Firm break there will target 1.8554 resistance. However, sustained trading below 1.7872 will turn bias back to the downside for 1.7459/7705 support zone instead.
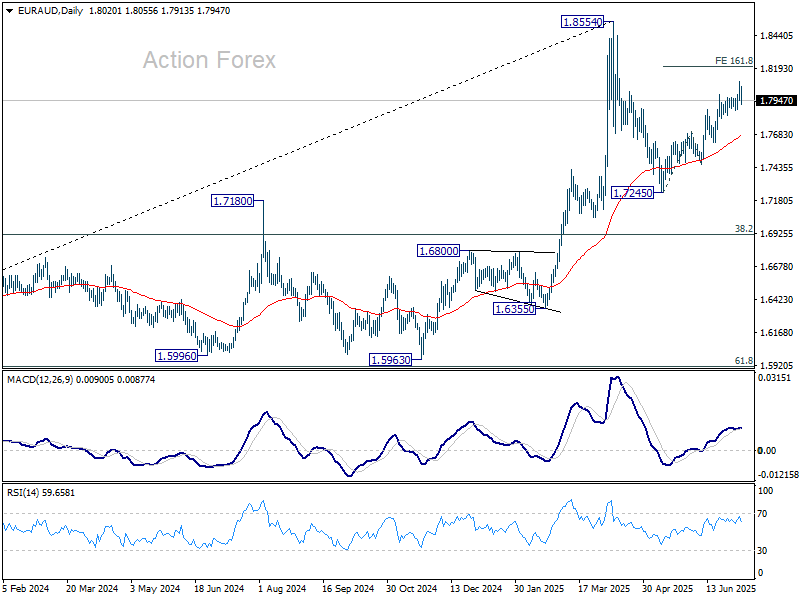
In the bigger picture, price actions from 1.8554 medium term are seen as a corrective pattern. While deeper pullback might be seen, downside should be contained by 38.2% retracement of 1.4281 (2022 low) to 1.8554 at 1.6922 to bring rebound. Up trend from 1.4281 is expected to resume at a later stage.
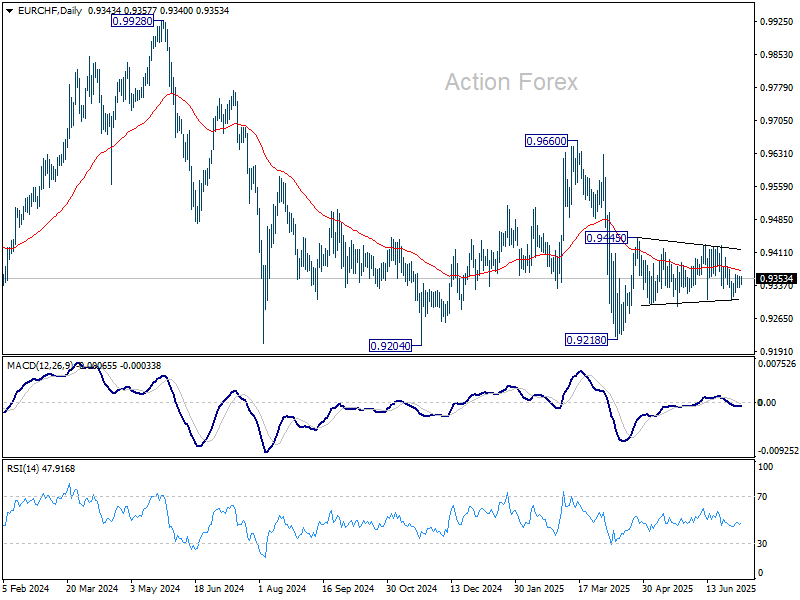
EUR/CHF Daily Outlook
Daily Pivots: (S1) 0.9336; (P) 0.9350; (R1) 0.9364; More....
EUR/CHF is still bounded in 0.9305/9428 and intraday bias stays neutral for the moment. On the upside, break of 0.9428/45 resistance zone will resume the rebound from 0.9218. On the downside, break of 0.9305 will bring retest of 0.9218 low instead.
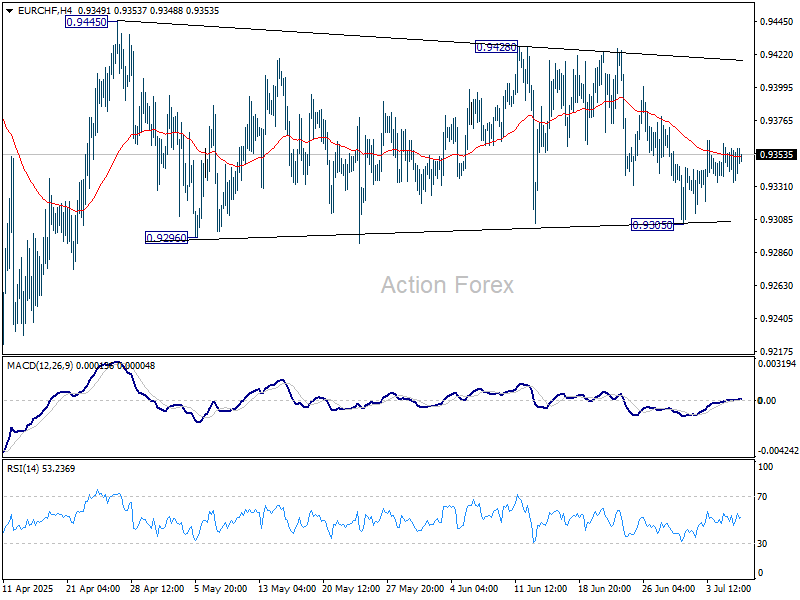
In the bigger picture, while downside momentum has been diminishing as seen in W MACD, there is no sign of bottoming yet. EUR/CHF is still staying below 55 W EMA (now at 0.9433) and well inside long term falling channel. Outlook will stay bearish as long as 0.9660 resistance holds. Break of 0.9204 (2024 low) will confirm resumption of down trend from 1.2004 (2018 high).
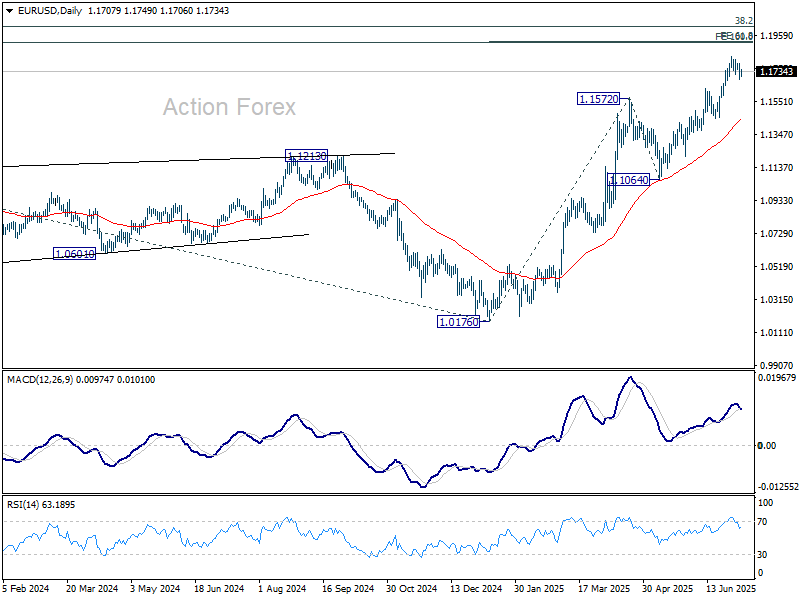
EUR/USD Daily Outlook
Daily Pivots: (S1) 1.1667; (P) 1.1729; (R1) 1.1770; More...
Intraday bias in EUR/USD remains neutral for consolidation below 1.1829. Downside should be contained by 1.1630 resistance turned support to bring rebound. Firm break of 1.1829 will resume the rise from 1.0176 and target 61.8% projection of 1.0176 to 1.1572 from 1.1064 at 1.1927.
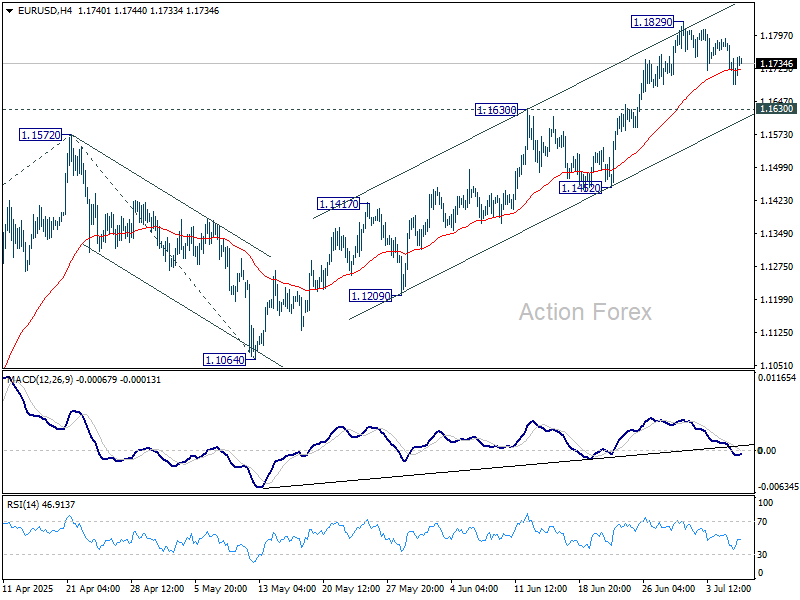
In the bigger picture, rise from 0.9534 long term bottom could be correcting the multi-decade downtrend or the start of a long term up trend. In either case, further rise should be seen to 100% projection of 0.9534 to 1.1274 from 1.0176 at 1.1916. This will now remain the favored case as long as 1.1604 support holds.
USD/JPY Daily Outlook
Daily Pivots: (S1) 144.73; (P) 145.48; (R1) 146.83; More...
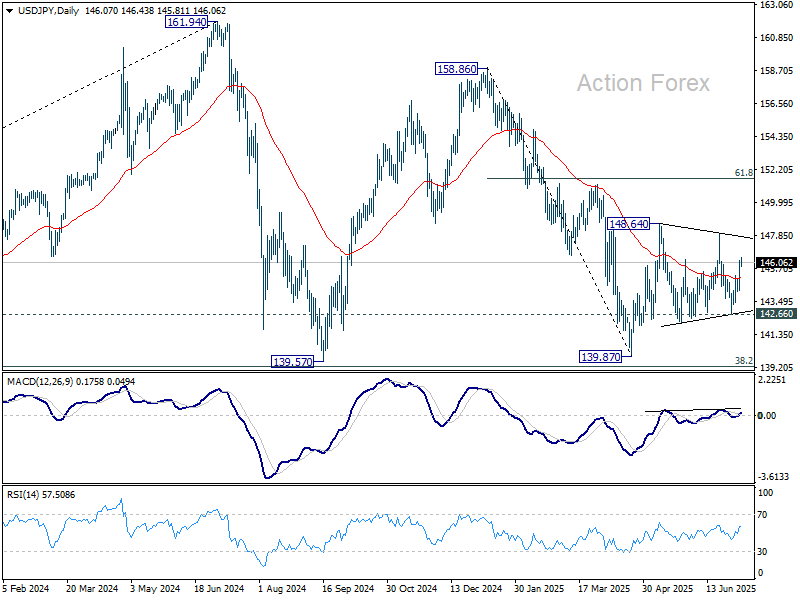
USD/JPY is still bounded in range of 142.66/148.01 and intraday bias remains neutral. On the upside, firm break of 148.01 resistance will resume the rise from 139.87 to 61.8% retracement of 158.86 to 139.87 at 151.22. However, break of 142.66 will bring deeper fall back to retest 139.87 low.
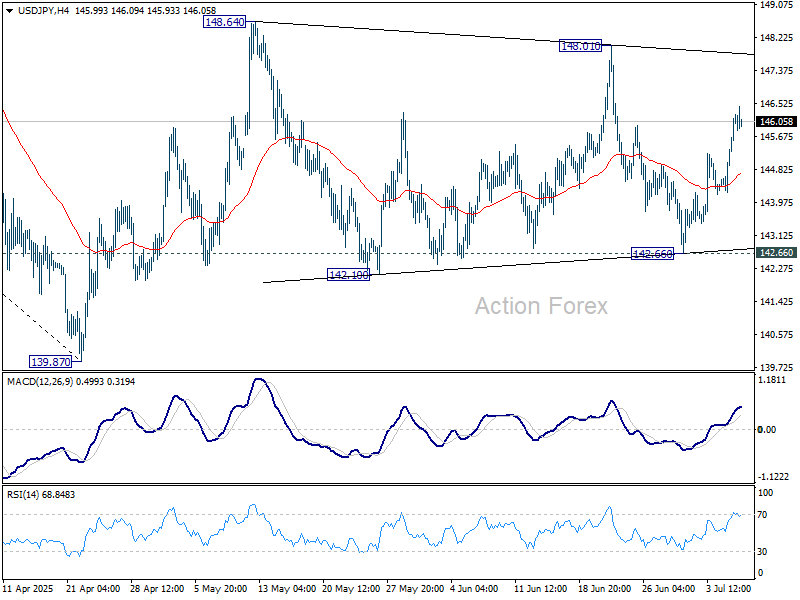
In the bigger picture, price actions from 161.94 (2024 high) are seen as a corrective pattern to rise from 102.58 (2021 low). There is no clear sign that the pattern has completed yet. But still, strong support is expected from 38.2% retracement of 102.58 to 161.94 at 139.26 to bring rebound.
GBP/USD Daily Outlook
Daily Pivots: (S1) 1.3563; (P) 1.3614; (R1) 1.3652; More...
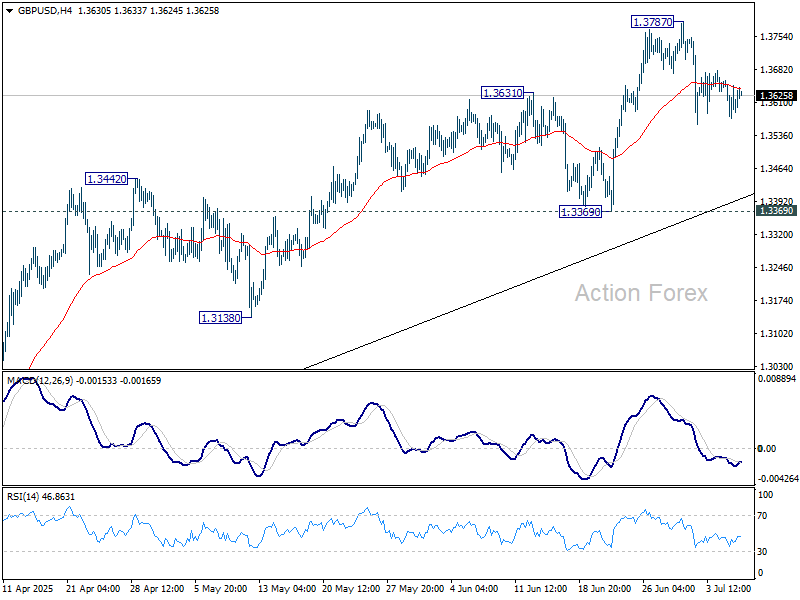
Intraday bias in GBP/USD remains neutral as consolidations continue below 1.3787. Deeper pullback cannot be ruled out, but downside should be contained by 1.3369 support to bring rebound. Firm break of 1.3787 will resume larger up trend to 100% projection of 1.2099 to 1.3206 from 1.3138 at 1.3813.
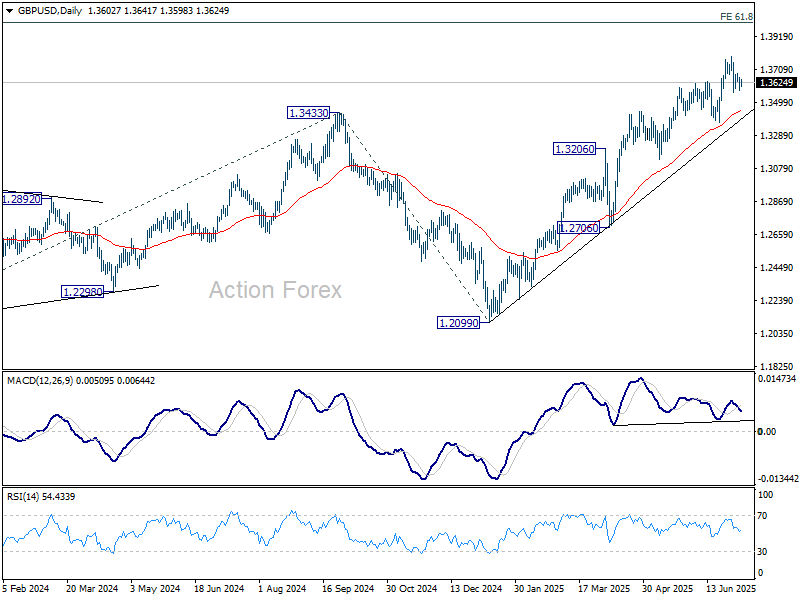
In the bigger picture, up trend from 1.3051 (2022 low) is in progress. Next medium term target is 61.8% projection of 1.0351 to 1.3433 from 1.2099 at 1.4004. Outlook will now stay bullish as long as 55 W EMA (now at 1.2985) holds, even in case of deep pullback.
USD/CHF Daily Outlook
Daily Pivots: (S1) 0.7948; (P) 0.7970; (R1) 0.8003; More….
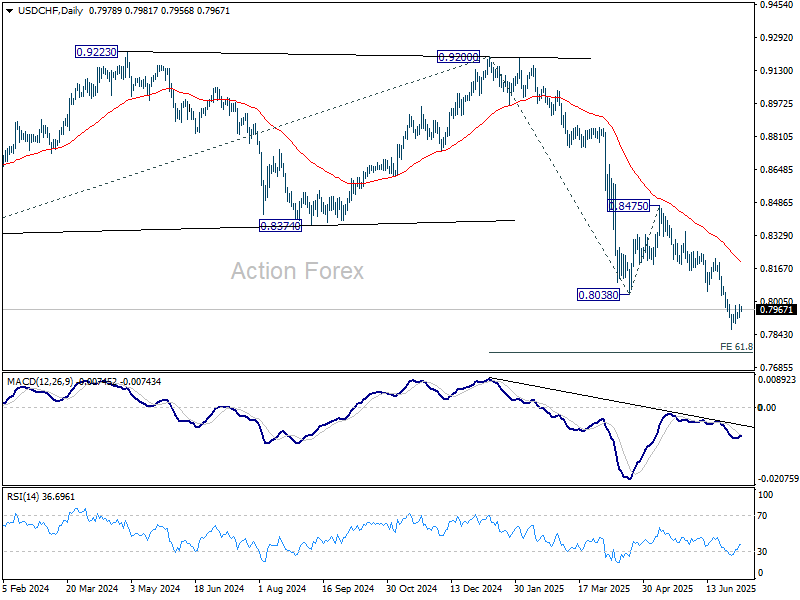
Intraday bias in USD/CHF remains neutral and more consolidations could be seen above 0.7871. Stronger recovery cannot be ruled out, but upside should be limited by 0.8054 support turned resistance to bring another fall. Below 0.7871 will extend the larger down trend to 61.8% projection of 0.9200 to 0.8038 from 0.8475 at 0.7757. Firm break there will pave the way to 100% projection at 0.7313 next.
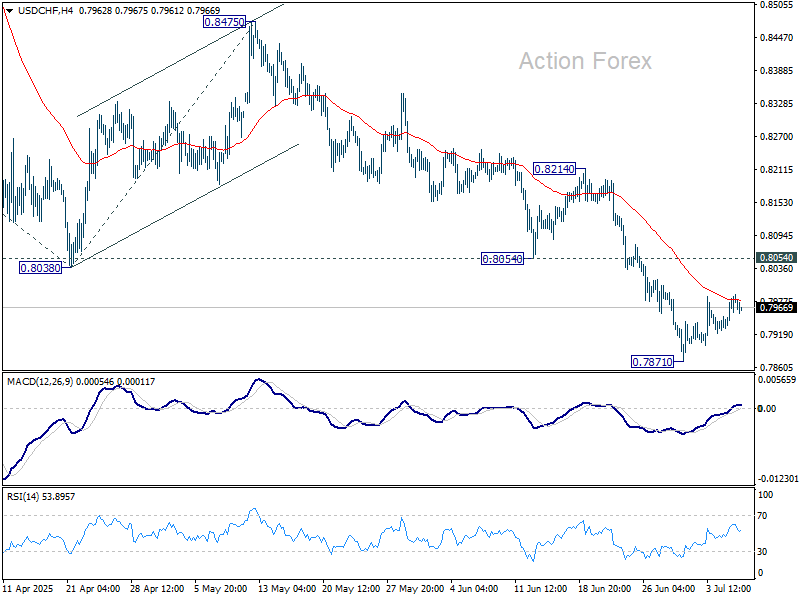
In the bigger picture, long term down trend from 1.0342 (2017 high) is still in progress. Next target is 100% projection of 1.0146 (2022 high) to 0.8332 from 0.9200 at 0.7382. In any case, outlook will stay bearish as long as 0.8475 resistance holds.
USD/CAD Daily Outlook
Daily Pivots: (S1) 1.3575; (P) 1.3596; (R1) 1.3625; More...
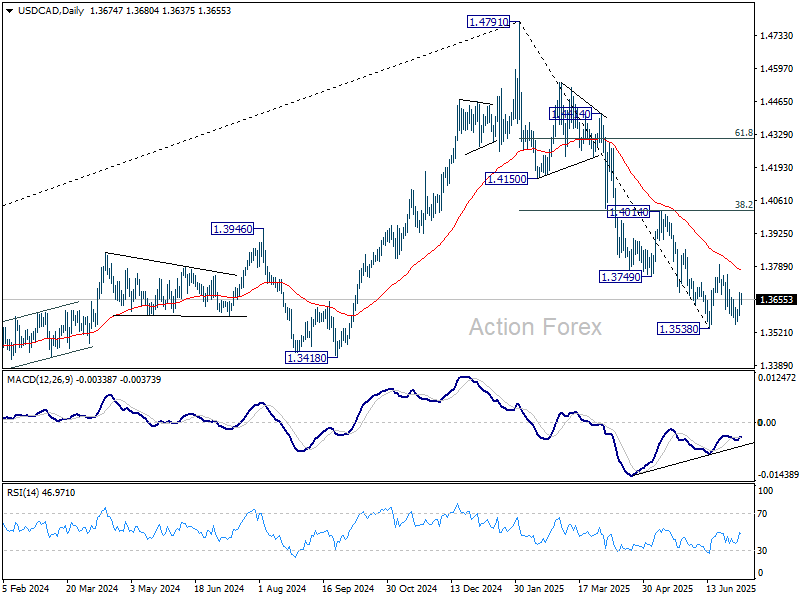
Intraday bias in USD/CAD stays mildly on the upside at this point. Corrective pattern from 1.3538 is in the third leg. Further rise would be seen to 1.3797 resistance and possibly above. On the downside, firm break of 1.3538/55 support zone will confirm resumption of whole decline from 1.4791.
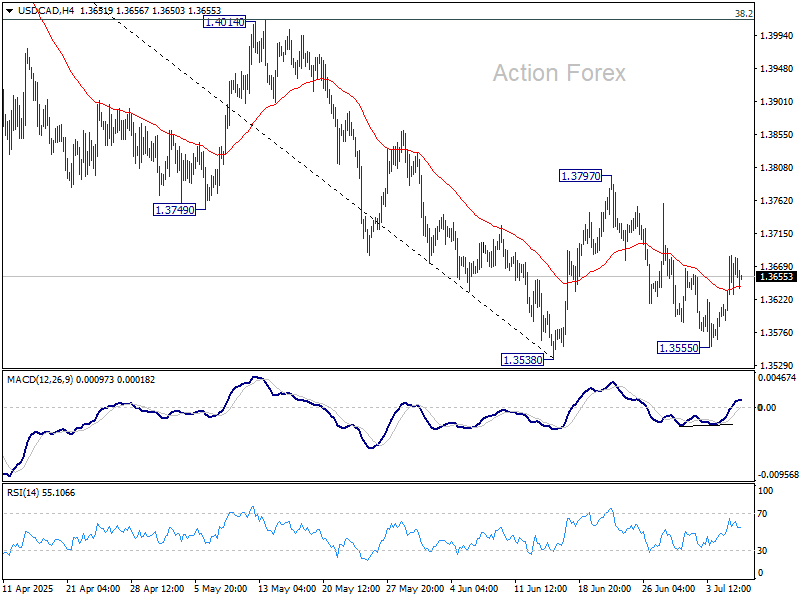
In the bigger picture, price actions from 1.4791 medium term top could either be a correction to rise from 1.2005 (2021 low), or trend reversal. In either case, further decline is expected as long as 1.4014 resistance holds. Next target is 61.8% retracement of 1.2005 (2021 low) to 1.4791 at 1.3069.
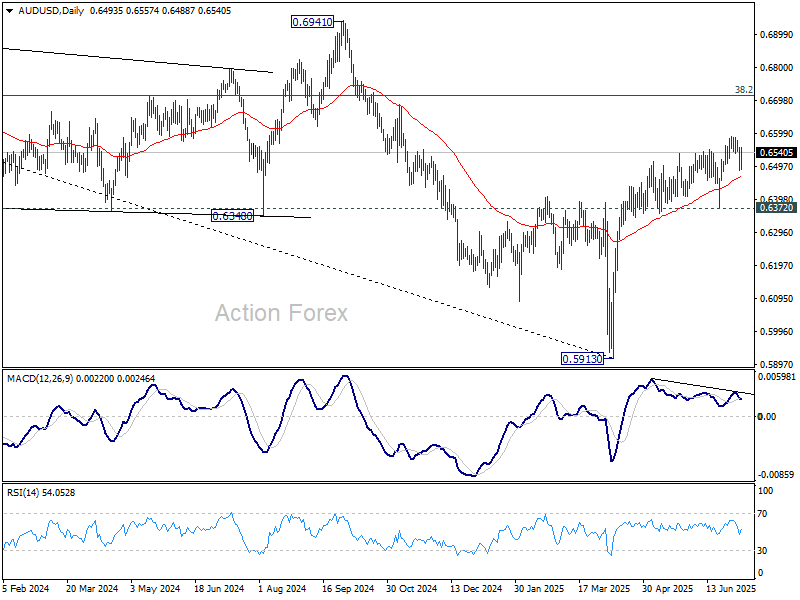
AUD/USD Daily Report
Daily Pivots: (S1) 0.6463; (P) 0.6513; (R1) 0.6541; More...
AUD/USD rebounded notably today but stays below 0.6589 resistance. Intraday bias stays neutral and more consolidations could still be seen. Overall, further rally is still expected as long as 0.6372 support holds. On the upside, firm break of 0.6589 will resume the rise from 0.5913 and target 0.6713 fibonacci level.
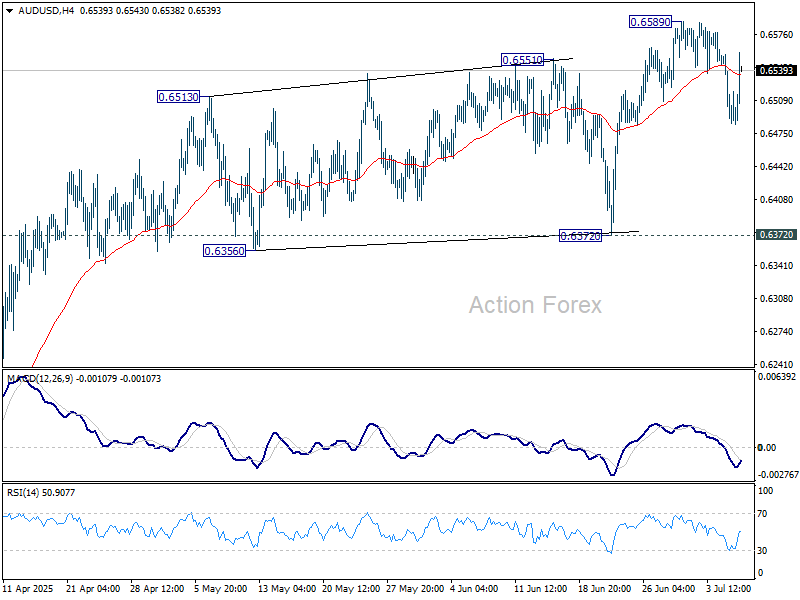
In the bigger picture, there is no clear sign that down trend from 0.8006 (2021 high) has completed. Rebound from 0.5913 is seen as a corrective move. While stronger rally cannot be ruled out, outlook will remain bearish as long as 38.2% retracement of 0.8006 to 0.5913 at 0.6713 holds. Nevertheless, considering bullish convergence condition in W MACD, even in case of another fall through 0.5913, downside should be contained above 0.5506 (2020 low).