Sample Category Title
Tick Tock: July 9th Deadline Approaches Fast
The week starts with renewed pressure on oil prices as OPEC decided to ramp up its production restoration plans by announcing an additional 548,000 barrels per day—well above the 411,000-increase expected. Members also said they will do the same at their September meeting. Hence, the 2.2mbpd restriction that was put in place in 2023 will be fully restored a year earlier than initially planned. There will then remain a separate tranche of 1.6mbpd in capacity—representing additional voluntary cuts by key members—before the supply cut strategy is entirely unwound.
Given that the cartel has shifted from a strategy of supporting oil prices to one focused on regaining market share, there’s little reason for them to hold that strategy in place any longer. Funny enough, the reason for faster oil restoration is ‘a steady economic outlook and current healthy market fundamentals.’ But of course, that view is questionable in the context of intensifying global trade tensions, which have led several leading institutions—including the OECD and World Bank—to revise their growth forecasts lower.
Regardless of their reasoning, the additional barrels will swell oil supply prospects for the second half of the year and inevitably weigh on prices. The knee-jerk reaction to the OPEC news was relatively soft, though. A decision of this size could’ve easily sent the barrel of US crude below the key $65 per barrel support—marking the 38.2% Fibonacci retracement level on the YTD decline and a strong support during the latest geopolitically-led spike. But the barrel of US crude opened near $66pb, briefly dipped below it, and has since been recovering early losses at the time of writing—perhaps on ongoing Middle East tensions and partly on expectations that lower prices will further pressure US shale production. As the cost of producing shale oil ranges between $50–$70pb depending on location, current levels mean some production may no longer be viable, limiting supply increases. But supply will still rise—from producers with significantly lower costs—which inevitably opens the door to cheaper oil. As such, price rallies offer interesting opportunities to sell the tops. Solid resistance is seen in the $68–$68.70 range, which includes July’s resistance and the 200-day moving average. Unless we see a fresh flare-up in Middle East tensions, bears are likely to return gradually.
On the trade front, the weekend was packed with negotiations as the July 9th deadline approaches fast. Within two days, the Trump administration is expected to announce its tariff decision for trading partners. Bessent said some countries will receive a three-week extension. But you can never be sure that what’s said now will still be true a minute from now. And you can’t count on the tariffs announced in the next few hours staying unchanged for more than a day. That’s just the reality—and the latest headlines aren’t pointing to a smooth ride.
The BRICS meeting took place over the weekend, and Trump threatened to slap an additional 10% tariff on countries that choose to align with them. As such, the trade drama is probably not going away anytime soon. That uncertainty will continue to cloud visibility. Any disappointment or renewed volatility could easily dent appetite across equity markets—some of which trade near all-time highs without a fundamentally solid basis. The announcement of trade deals, on the other hand, could fuel a short-term rally—until earnings season tells the real story behind the tariffs. And that story might turn out gloomier than what the FOMO and TACO trades suggested in Q2…
Asian traders kicked off the week cautiously. The Nikkei is under pressure below the 40K mark, and the CSI is offered below 4000 on the back of rising EU–China tensions. US futures are in the red this morning, while European futures are slightly better bid. The S&P 500 closed last week—shortened by the holiday—at a fresh record high, the SXXP slipped below its 50-day moving average and tested the 100-day. Let’s see what kind of political meat Trump tosses on the grill this week—we’ll either get a juicy jump or a bad slump.
In FX, the US dollar is better bid despite trade tensions, and gold has slipped below its 50-DMA despite rising uncertainty. The EURUSD is consolidating below 1.18, while USDJPY is testing the 145 level, with yen bears emboldened by weaker-than-expected wage growth in May. The AUDUSD is one of the most heavily hit majors this morning—a day before the Reserve Bank of Australia (RBA) is expected to announce another 25bp cut to support the economy amid global uncertainty and slowing Chinese economy. The Reserve Bank of New Zealand (RBNZ), however, is expected to remain on hold when it meets this week.
Elsewhere, the Federal Reserve (Fed) minutes may offer insight into how the Fed is not considering rate cuts when jobs data remain strong and the inflation outlook remains uncertain. Meanwhile, the UK is set to announce a second consecutive month of GDP contraction for May, following last week’s Labour Party drama, which triggered a short spike in long-dated gilt yields. More broadly, it’s important to watch long-term bond yields, which have been drifting higher since early July—and could be preparing the ground for a broader risk-off move if upcoming data and headlines disappoint.
EUR/AUD Daily Outlook
Daily Pivots: (S1) 1.7905; (P) 1.7950; (R1) 1.8019; More...
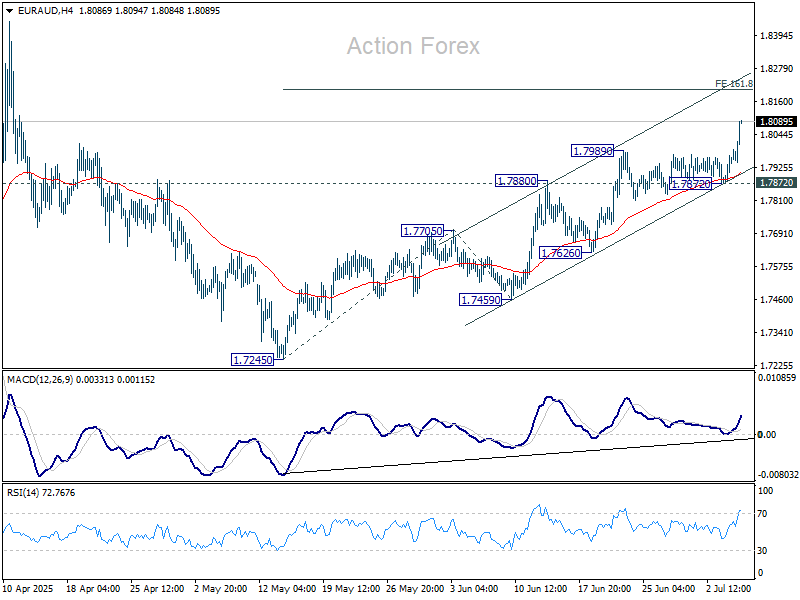
EUR/AUD's rally from 1.7245 resumed by breaking through 1.7989 resistance decisively. Intraday bias is back on the upside. Next target is 161.8% projection of 1.7245 to 1.7705 from 1.7459 at 1.8203. Firm break there will target 1.8554 resistance. For now, further rise will remain in favor as long as 1.7872 support holds, in case of retreat.
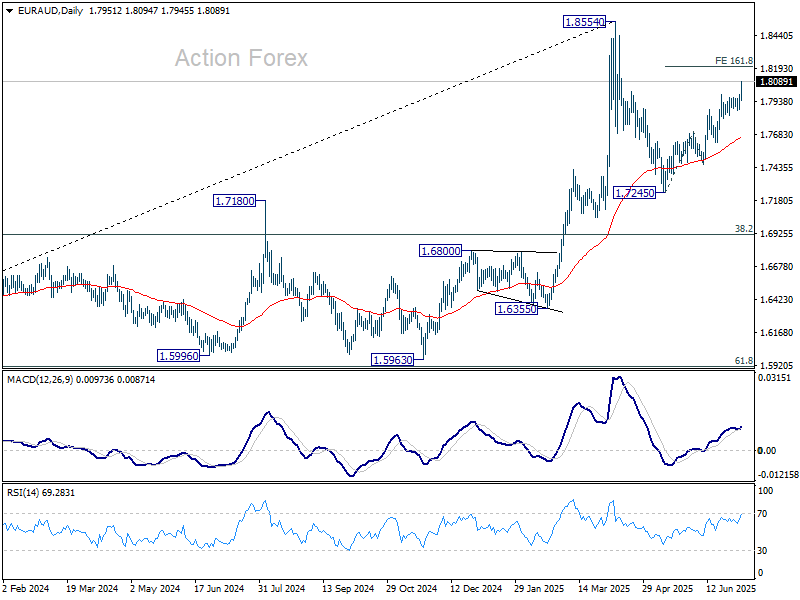
In the bigger picture, price actions from 1.8554 medium term are seen as a corrective pattern. While deeper pullback might be seen, downside should be contained by 38.2% retracement of 1.4281 (2022 low) to 1.8554 at 1.6922 to bring rebound. Up trend from 1.4281 is expected to resume at a later stage.
Trump’s BRICS Threat Rattles Aussie and Kiwi
Australian and New Zealand Dollars fell sharply to start the week, leading losses alongside Yen. The moves come just ahead of central bank meetings in both countries, with RBA widely expected to cut rates by 25bps to 3.60% and RBNZ likely to hold at 3.25%. But given how well those outcomes are priced in, the sharp declines are more tied to a sharp escalation in US-led trade threats, which now openly target nations aligned with the BRICS economic bloc.
US President Donald Trump and Treasury Secretary Scott Bessent confirmed over the weekend that unilateral tariffs first announced in April will take effect August 1 for countries that have not finalized deals with the US The warning comes alongside new “take-it-or-leave-it” letters being sent to trading partners, with a clear message: accept the revised deal or revert to harsher April 2 tariff rates.
Adding fuel to the risk-off tone, Trump explicitly warned that any country aligning itself with BRICS “anti-American policies” will face an additional 10% tariff. That’s a direct signal to countries like Australia and New Zealand, which maintain strong trade ties with China, India, and Indonesia—all key BRICS or BRICS-aligned nations. Markets are increasingly viewing the region as vulnerable to secondary economic fallout if bilateral relations deteriorate further.
Currency markets quickly repriced exposure. Dollar led gains, followed by Euro and Swiss Franc, as investors rotated toward perceived safety. AUD and NZD were the worst performers, with Yen not far behind. Sterling and Canadian dollar held near the middle of the pack .
Technically, while today's decline in NZD/USD is steep, it's not yet structurally damaging. Deeper pullback might be seen but near term outlook should stay bullish as long as 0.5802 cluster support holds (38.2% retracement of 0.5484 to 0.6119 at 0.5876 holds. Rally from 0.5484 is still in favor to resume at a later stage.

In Asia, at the time of writing, Nikkei is down -0.53%. Hong Kong HSI is down -0.45%. China Shanghai SSE is down -0.21%. Singapore Strait Times is up 0.30%. Japan 10-year JGB yield is up 0.018 at 1.453.
Japan real wages post sharpest drop Since 2023 as bonuses shrink
Japan’s real wages fell -2.9% yoy in May, a sharp acceleration from April’s -2.0% drop yoy and the steepest decline since September 2023. This also marks the fifth consecutive monthly fall in inflation-adjusted income, as households remain squeezed by rising prices and underwhelming nominal pay growth. Consumer inflation, used to deflate nominal wages, stood at 4.0% yoy, driven by higher food costs, particularly rice.
Nominal wages rose just 1.0% yoy, well short of the 2.4% yoy forecast and down from 2.0% yoy in April. While base salary growth held at 2.0% yoy and overtime pay rose 1.0% yoy, a sharp -18.7% yoy plunge in special payments—largely one-off bonuses—dragged down the overall figure. May marked the 41st consecutive monthly rise in nominal wages, but the pace failed again to keep up with price growth.
Government officials cautioned that the wage data may not yet reflect the full impact of spring labor negotiations, especially as many small firms surveyed lack unions and implement pay increases more slowly than large corporations. Nonetheless, the prolonged real wage squeeze could weigh on consumer spending and affect BoJ’s plans to gradually normalize policy.
OPEC+ raises supply by 548k bpd, WTI dips mildly in range
OPEC+ surprised markets over the weekend by agreeing to boost crude production by 548k bpd barrels in August, outpacing expectations for a more modest 411k bpd increase. The alliance said the move reflects confidence in “a steady global economic outlook and healthy market fundamentals,” noting that inventories remain low.
WTI crude dipped slightly at the Monday open but continues to hold above its short-term bottom at 65.21. Price action remains consolidative, and a near-term bounce is possible, though gains are likely to be capped by 38.2% retracement of 78.87 to 65.21 at 70.42. The main question is whether 61.8% retracement of 55.20 to 78.87 at 64.24 could hold as fall from 78.87 resumes later.
While OPEC+ is leaning into demand strength, the market appears cautious about upside potential given rising supply and uncertain macro drivers.

RBA to cut, RBNZ to hold, FOMC minutes also watched
Two central banks will take center stage this week, with RBA expected to resume easing while the RBA likely holds steady.
Markets are positioning for a 25bps rate cut from RBA to 3.60%, and the key focus will be whether Governor Michele Bullock signals a faster pace of easing ahead as inflation recedes and economic activity slows.
A Reuters poll conducted between June 30 and July 3 showed that 23 of 36 economists expect RBA to cut rates to 3.35% this quarter, with many major banks forecasting August as the likely window. ANZ, Commonwealth Bank, and NAB all expect a cut to 3.35% in August, while NAB sees further easing to 3.10% by year-end. Westpac also anticipates 3.35%, but sees that level reached by December.
RBA’s tone will be decisive in shaping market expectations. If policymakers suggest that the disinflation trend is durable and growth risks are mounting, markets may begin pricing in more aggressive cuts, particularly if domestic demand shows further signs of stalling. AUD could soften if guidance points to an accelerated easing path.
In contrast, RBNZ is expected to keep its official cash rate unchanged at 3.25% at its July 9 meeting. The central bank has already delivered 225bps of cuts since August 2024, supporting an economy that exited recession late last year. GDP rose 0.8% in Q1, giving RBNZ room to pause and assess new data before deciding on further moves.
According to a separate Reuters poll, 19 of 27 economists forecast no change this week, with only eight expecting a cut. All major New Zealand banks expect rates to remain on hold. While inflation data has been mixed, policymakers are likely to wait for clearer signals on inflation expectations before acting in August.
In the US, the FOMC minutes from the June meeting are unlikely to shift market expectations. With a solid June NFP print behind them, Fed futures price near-zero odds of a July cut. Although Governors Christopher Waller and Michelle Bowman have signaled more dovish leanings recently, the broader Committee remains cautious amid tariff and fiscal uncertainties.
The ultimate shape of the Fed’s easing cycle—whether two cuts as implied in the dot plot, or fewer—will hinge more on how the tariff situation evolves after the truce ends than on debates at the June meeting.
Markets will also keep an eye on incoming data including UK and Canadian GDP, China CPI, and Eurozone Sentix confidence for broader macro signals.
Here are some highlights for the week:
- Monday: Japan labor cash earnings; Germany industrial production; Swiss foreign currency reserves; Eurozone Sentix investor confidence, retail sales.
- Tuesday; Australia NAB business confidence, RBA rate decision; Germany trade balance; France trade balance; Canada Ivey PMI.
- Wednesday: China CPI, PPI; RBNZ rate decision; FOMC minutes.
- Thursday: Japan PPI; US jobless claims.
- Friday: New Zealand BNZ manufacturing; Germany CPI final; UK GDP, trade balance; Swiss SECO consumer climate; Canada employment.
EUR/AUD Daily Outlook
Daily Pivots: (S1) 1.7905; (P) 1.7950; (R1) 1.8019; More...
EUR/AUD's rally from 1.7245 resumed by breaking through 1.7989 resistance decisively. Intraday bias is back on the upside. Next target is 161.8% projection of 1.7245 to 1.7705 from 1.7459 at 1.8203. Firm break there will target 1.8554 resistance. For now, further rise will remain in favor as long as 1.7872 support holds, in case of retreat.
In the bigger picture, price actions from 1.8554 medium term are seen as a corrective pattern. While deeper pullback might be seen, downside should be contained by 38.2% retracement of 1.4281 (2022 low) to 1.8554 at 1.6922 to bring rebound. Up trend from 1.4281 is expected to resume at a later stage.
EUR/USD Holding Firm — Consolidation May Precede Next Move
Key Highlights
- EUR/USD started a fresh increase above the 1.1720 resistance.
- A short-term contracting triangle is forming with resistance at 1.1795 on the 4-hour chart.
- GBP/USD started a downside correction from the 1.3800 zone.
- USD/JPY could aim for a fresh increase if it clears the 145.35 resistance.
EUR/USD Technical Analysis
The Euro started another increase after it cleared 1.1650 against the US Dollar. EUR/USD even surpassed the 1.1720 resistance zone and tested 1.1830.
Looking at the 4-hour chart, the pair traded as high as 1.1829 and is currently consolidating gains. There was a minor decline below the 1.1800 level and the pair tested the 23.6% Fib retracement level of the upward move from the 1.1453 swing low to the 1.1829 high.
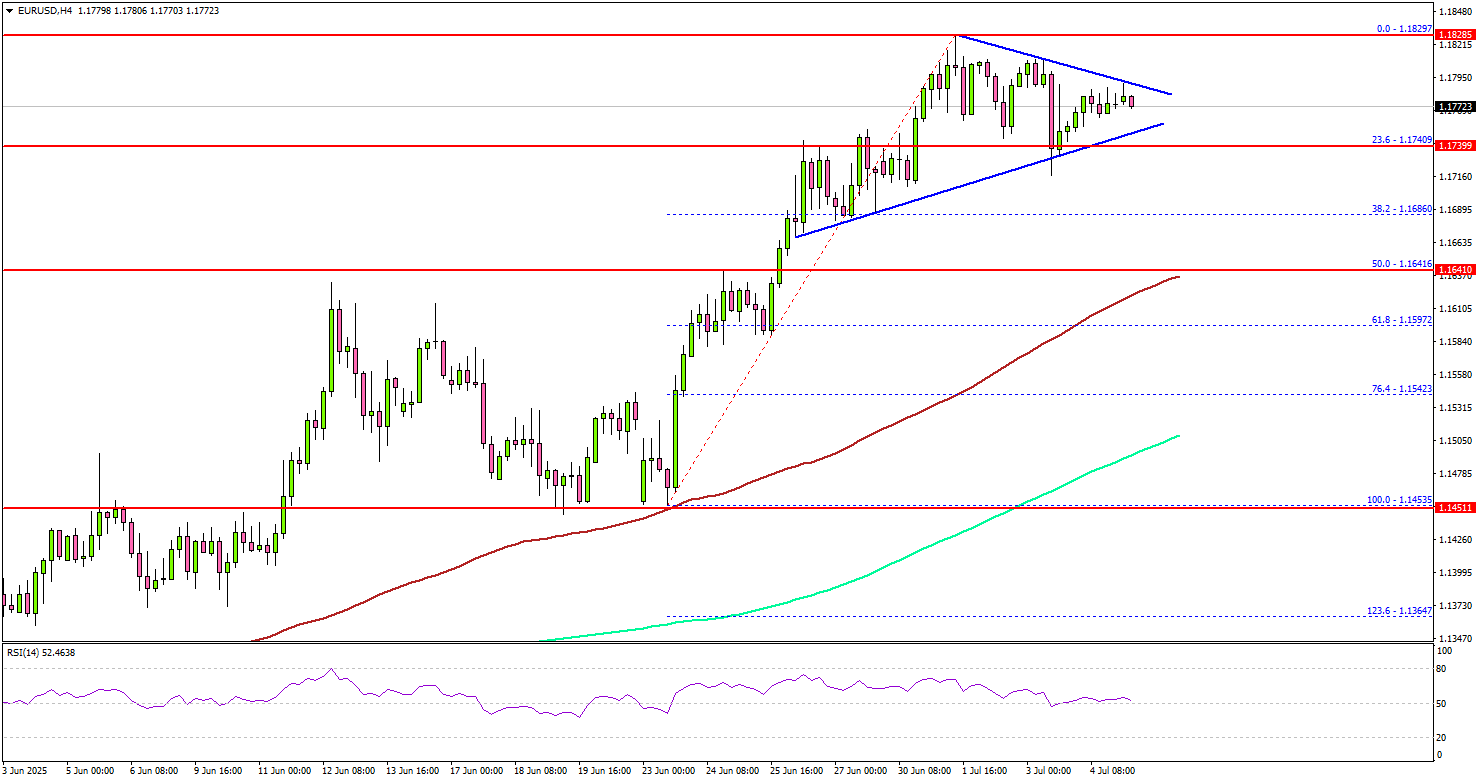
The pair settled above the 100 simple moving average (red, 4-hour) and the 200 simple moving average (green, 4-hour). On the upside, the pair could face resistance near the 1.1800 level. There is also a short-term contracting triangle forming with resistance at 1.1795 on the same chart.
The next key resistance sits near the 1.1830 level. A close above the 1.1830 level could set the pace for another increase. In the stated case, the pair could even clear the 1.1850 resistance. The next major stop for the bulls could be near the 1.1920 resistance.
On the downside, immediate support is near the 1.1750 level. The next key support sits near 1.1720. Any more losses could send the pair toward the 1.1650 support zone.
Looking at GBP/USD, the pair failed to extend gains above the 1.3800 resistance and recently started a consolidation and correction phase.
Upcoming Economic Eventbs:
- Euro Zone Sentix Investor Confidence for July 2025 - Forecast 0.2, versus 0.2 previous.
- Euro Zone Retail Sales for May 2025 (YoY) - Forecast +1.2%, versus +2.3% previous.
OPEC+ raises supply by 548k bpd, WTI dips mildly in range
OPEC+ surprised markets over the weekend by agreeing to boost crude production by 548k bpd barrels in August, outpacing expectations for a more modest 411k bpd increase. The alliance said the move reflects confidence in “a steady global economic outlook and healthy market fundamentals,” noting that inventories remain low.
WTI crude dipped slightly at the Monday open but continues to hold above its short-term bottom at 65.21. Price action remains consolidative, and a near-term bounce is possible, though gains are likely to be capped by 38.2% retracement of 78.87 to 65.21 at 70.42. The main question is whether 61.8% retracement of 55.20 to 78.87 at 64.24 could hold as fall from 78.87 resumes later.
While OPEC+ is leaning into demand strength, the market appears cautious about upside potential given rising supply and uncertain macro drivers.
Japan real wages post sharpest drop Since 2023 as bonuses shrink
Japan’s real wages fell -2.9% yoy in May, a sharp acceleration from April’s -2.0% drop yoy and the steepest decline since September 2023. This also marks the fifth consecutive monthly fall in inflation-adjusted income, as households remain squeezed by rising prices and underwhelming nominal pay growth. Consumer inflation, used to deflate nominal wages, stood at 4.0% yoy, driven by higher food costs, particularly rice.
Nominal wages rose just 1.0% yoy, well short of the 2.4% yoy forecast and down from 2.0% yoy in April. While base salary growth held at 2.0% yoy and overtime pay rose 1.0% yoy, a sharp -18.7% yoy plunge in special payments—largely one-off bonuses—dragged down the overall figure. May marked the 41st consecutive monthly rise in nominal wages, but the pace failed again to keep up with price growth.
Government officials cautioned that the wage data may not yet reflect the full impact of spring labor negotiations, especially as many small firms surveyed lack unions and implement pay increases more slowly than large corporations. Nonetheless, the prolonged real wage squeeze could weigh on consumer spending and affect BoJ’s plans to gradually normalize policy.
Bitcoin Wave Analysis
Bitcoin: ⬇️ Sell
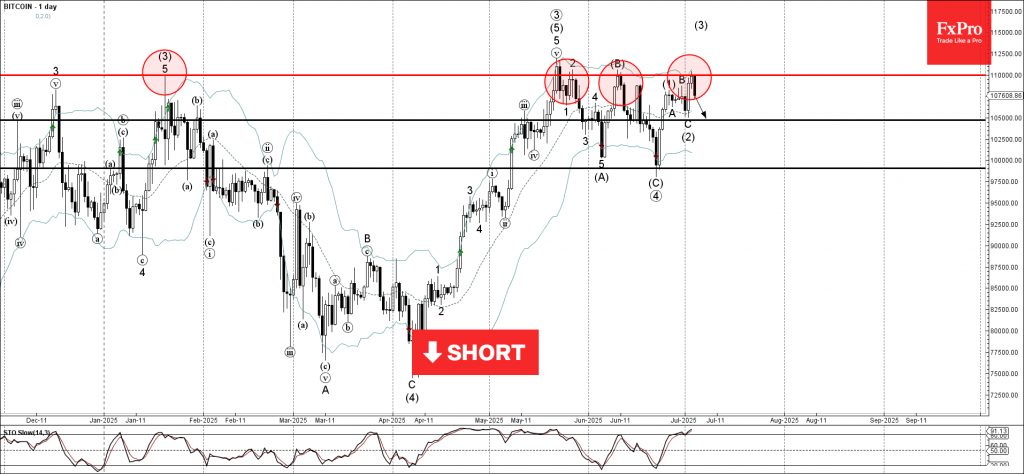
- Bitcoin reversed from long-term resistance level 110000.00
- Likely to fall to support level 105000.00
Bitcoin cryptocurrency recently reversed down from the major long-term resistance level 110000.00 (which has been steadily reversing the price from the start of this year, as can be seen below) – intersecting with the upper daily Bollinger Band.
The downward reversal from the resistance level 110000.00 stopped the previous medium-term impulse wave (3) from the start of June.
Given the strength of the resistance level 110000.00 and the overbought daily Stochastic, Bitcoin cryptocurrency pair can be expected to fall to the next support level 105000.00 (low of the previous correction (2)).
EURCAD Wave Analysis
EURCAD: ⬆️ Buy
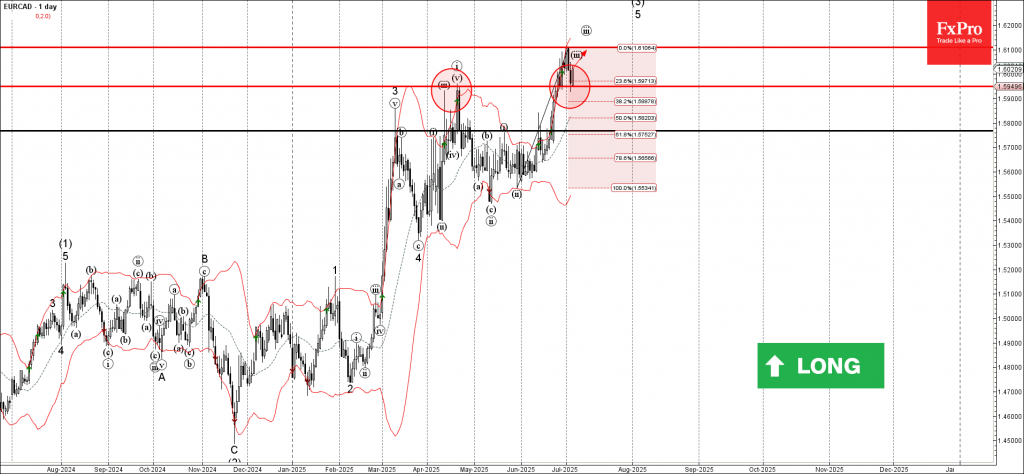
- EURCAD reversed from support level 1.5950
- Likely to rise to resistance level 1.6100
EURCAD currency pair recently reversed up from the strong support level 1.5950 (former double top from April, acting as the support after it was broken).
The upward reversal from the support level 1.5950 continues the active short-term impulse wave 5 of the intermediate impulse wave (3) from last November.
Given the strong daily uptrend and the strongly bullish euro sentiment seen today, EURCAD currency pair can be expected to rise to the next resistance level 1.6100.
Wall Street Surges, Trump Tariff Blitz Looms, Dollar Struggles
Last week’s market action displayed a familiar theme: investors are choosing to focus on growth — even if it’s fragile — and political clarity, however fleeting. US equities roared to record highs as a wave of macro and policy news washed over Wall Street.
Yet the outlook is far from simple. The 90-day tariff truce expires July 9. Markets are now facing a unilateral shift in US policy that threatens to escalate trade tensions. The era of bespoke deals appears to be giving way to a blanket tariff regime. The risk of fragmentation in global trade architecture is also growing by the day.
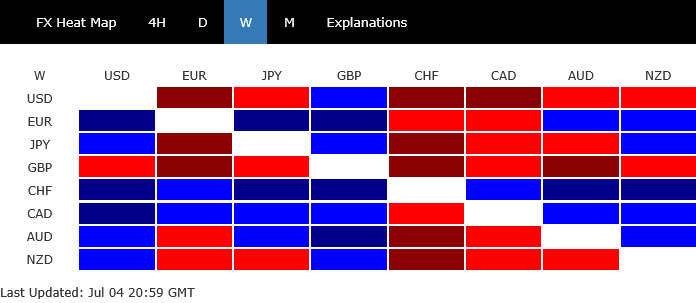
In the currency markets, Swiss Franc stood out as the strongest performer, supported by a better-than-expected inflation report that eased deflation fears. On the flip side, Sterling was hammered by domestic political uncertainty. The contrast is clearly reflected in the downturn of GBP/CHF, logging the largest weekly drop among major currency pairs and crosses.
Overall, Lonnie was the second best, while Euro was third. Dollar was the second worst, trailed by Kiwi. Euro and Yen ended in the middle.
US Equities Hit Record Highs Amid Policy Deluge
US stocks ended the shortened week on a high note,, with S&P 500 and NASDAQ closing at fresh record highs and DOW not far behind. Investors digested a flood of major developments, from economic data to fiscal and trade news, and came away still leaning risk-on. The positive mood suggests that the combination of resilient jobs growth and aggressive fiscal support is outweighing concerns around tighter monetary for longer or geopolitical headwinds.
A stronger-than-expected June non-farm payroll report dented hopes of a July rate cut. But the solid data — coupled with signs of wage deceleration — pointed to cooling, yet healthy labor market, fueling optimism about a soft landing. Meanwhile, the final passage of President Donald Trump’s sweeping tax-and-spending bill added to market momentum, despite raising longer-term deficit risks.
Trump signed the bill into law on July 4, securing a political victory. While the bill passed by a razor-thin margin, markets responded positively to the policy clarity. A blend of corporate tax cuts, defense spending hikes, and welfare reductions added fuel to the rally, even as concerns simmer over its inflationary consequences.
Markets also took comfort in the fact that the Fed is now seen as staying on hold in July, avoiding premature policy action. At the same time, cooling wage pressures imply that the door remains open for gradual easing later in the year. The balance between data-dependent Fed patience and fiscal stimulus-driven growth is proving to be equity-friendly.
Technically, S&P 500's upside re-acceleration, as seen in D MACD caught us by surprise. Nevertheless, with the sold break of 6147.43 resistance. long term up trend has resumed. Near term outlook will now stay bullish as long as 6059.30 resistance turned support holds.
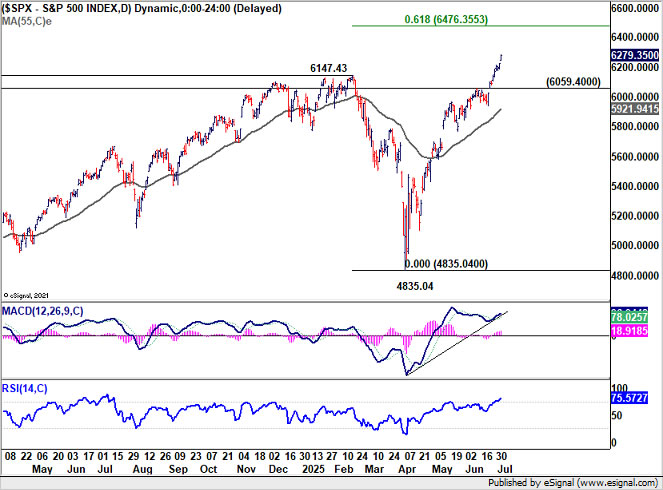
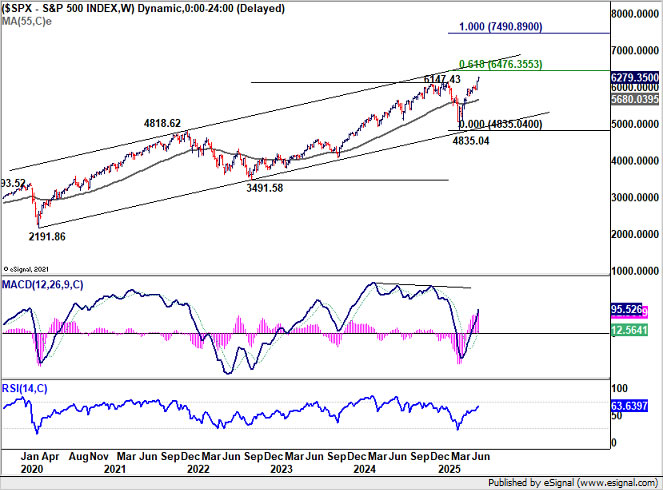
The key hurdle for S&P 500 is now between 61.8% projection of 3491.58 to 6147.43 from 4835.04 at 6476.35, and long term channel resistance (now at around 6640). Strong resistance could be seen from this zone to cap upside, at least on first attempt.
Tariff Truce Ends, Global Trade to be Redefined
Trump confirmed on Friday that letters have been signed to 12 countries, detailing specific tariff rates they will face — a clear shift from earlier pledges of bilateral deals. These "take it or leave it" offers will be sent on Monday, just ahead of the July 9 truce deadline. Markets are bracing for fallout as the era of blanket tariffs inches closer to reality.
Back in April, Trump initially floated a 10% base tariff and additional charges up to 50%. Those surcharges were suspended for 90 days to allow for negotiations. But with the grace period ending, the administration may now opt for even higher rates, possibly up to 70%, and most measures are slated to take effect August 1.
So far, only two countries — the UK and Vietnam — have struck deals. The UK retained a 10% rate and won carve-outs for auto and aerospace industries. Vietnam secured lower-than-feared tariffs, with a 20% rate on many goods and a 40% levy on suspected transshipments. US exports to Vietnam will face no tariffs.
Europe’s talks with Washington appear stuck. European Commission President Ursula von der Leyen acknowledged the best hope might be a thin political agreement. She warned that if no deal is reached by July 9, "all instruments are on the table." The EU could resort to retaliatory tariffs or legal challenges at the WTO.
Beyond official negotiations, global supply chains are shifting. Malaysia announced provisional duties on Chinese, Korean, and Vietnamese steel, effective Monday, signaling broader trade fragmentation. These duties range from 3.86% to nearly 58%, pending a final ruling in November.
Meanwhile, China has retaliated against Europe. Duties up to 34.9% will be imposed on EU brandy, effective Saturday. Large cognac makers can avoid them by agreeing to minimum price floors. The move is widely seen as payback for the EU’s tariffs on Chinese EVs.
Chinese foreign minister Wang Yi recently told the EU that Beijing opposes a Russian defeat in Ukraine — a warning that excessive Western pressure on Moscow may eventually boomerang toward China. Trade is becoming a key theater in this broader contest.
While investors may hope for de-escalation, the trend is clear: Washington is consolidating control over its trade terms, and other nations are scrambling to respond. How this plays out over the next few weeks will shape the second half of 2025.
Dollar Finds No Lift from Fed Caution
The latest data flow confirmed the Fed’s baseline — the economy is solid, but not overheating, and there’s no urgency to cut rates in July. The solid NFP report gave Fed Chair room to remain patient. While inflation risks from tariffs persist, the resilient labor market buys the Fed time.
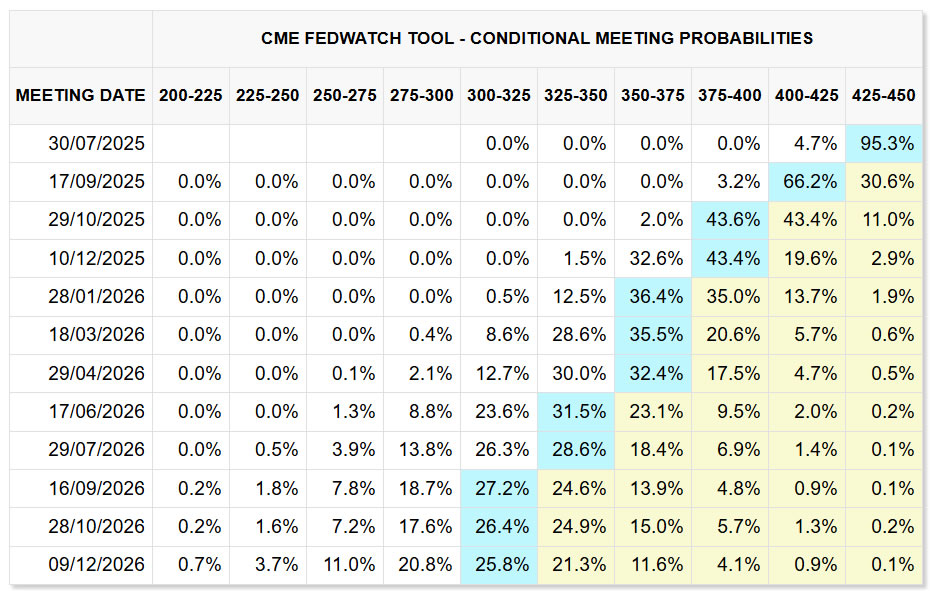
Still, while a July cut is off the table, the shift in outlook has been subtle. September cut odds slipped back to 70% from 91% last week. Markets now see less than a 35% chance of three total cuts this year. While the easing cycle is intact, its pace appears slower.
Atlanta Fed President Raphael Bostic offered a longer-term view. He warned that the impact of trade and fiscal changes won’t be immediate, but rather unfold over a year or more. That could keep inflation elevated for longer than textbook models assume.
Bostic’s view supports a cautious Fed. If the inflation path is flatter but stickier, interest rates may need to stay higher for longer. That means even a resilient economy could coexist with slow policy adjustments — a Goldilocks scenario for risk assets, but less helpful for Dollar.
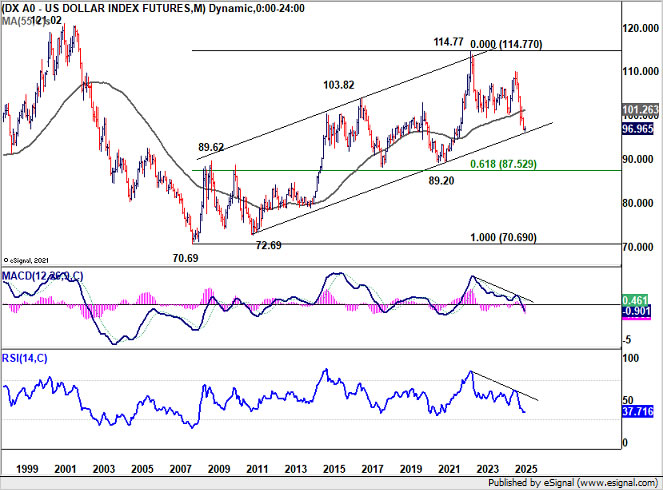
Technically, the most pressing question is whether Dollar Index could draw enough support from long term channel (now at around 96) to complete the decline from 114.77 (2022 high). Strong rebound from current level will keep such decline corrective, and keep the up trend from 70.67 (2008 low) intact. However, sustained break of the channel support will argue that whole up trend has completed, and deeper medium term fall would be seen to 61.8% retracement at 87.52, even still as a corrective move.
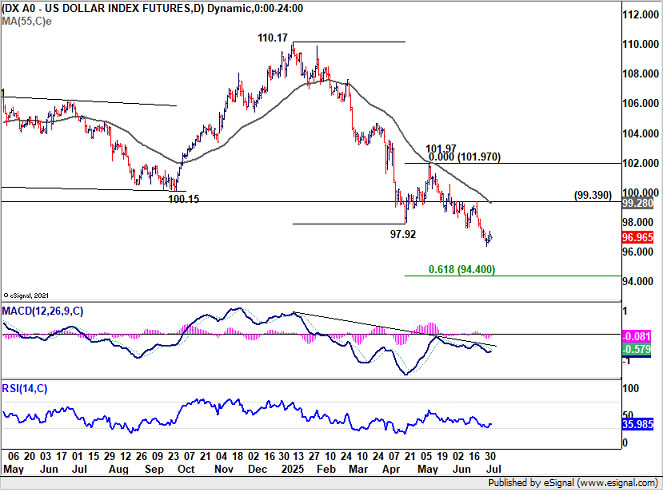
For the near term, Dollar Index's decline slowed a little bit, but there is no clear momentum for a bounce. Near term outlook will continue to stay bearish as long as 99.39 resistance holds. Next target is 61.8% projection of 110.17 to 97.92 from 101.97 at 94.40.
Franc Finds Relief in Inflation Data, Sterling Weakens on UK Political Risks
GBP/CHF was last week’s biggest mover, falling -1.12% as a mix of renewed UK political risk and strengthening Swiss Franc pushed the cross lower. While the Swiss currency’s broad-based gains drove some of the move, domestic issues within the UK also added pressure to Sterling.
On the Swiss side, inflation data surprised slightly to the upside, with CPI rebounding to 0.1% yoy in June. This offered SNB some breathing room in its battle against deflationary pressures and boosted confidence that the May dip into negative territory was transitory. While inflation remains subdued, the data SNB more reason to pause rather than proceed with another cut in September.
With policy rates already at 0%, further easing by the SNB would require stronger justification. Ongoing Franc strength still poses downside risks to inflation, but barring further persistent deterioration in price pressures, the central bank might stay put for now.
In the UK, political drama around Chancellor Rachel Reeves and the Labour government’s policy U-turns have reignited fears of fiscal instability. The government’s retreat from welfare reform plans erased anticipated savings, raising doubts over its fiscal roadmap. Gilt yields spiked and Sterling came under renewed pressure, drawing comparisons to the 2022 Truss-led market meltdown.
Speculation of a cabinet reshuffle—and whether Reeves herself might be replaced—only deepens investor unease. Traders will be watching closely for any concrete developments, especially before the summer recess.
Technically, GBP/CHF's extended, accelerated decline indicates that rebound from 1.0610 should have completed at 1.1204 already. Deeper fall is expected as long as 1.0930 support turned resistance holds, to retest 1.0610 low first.
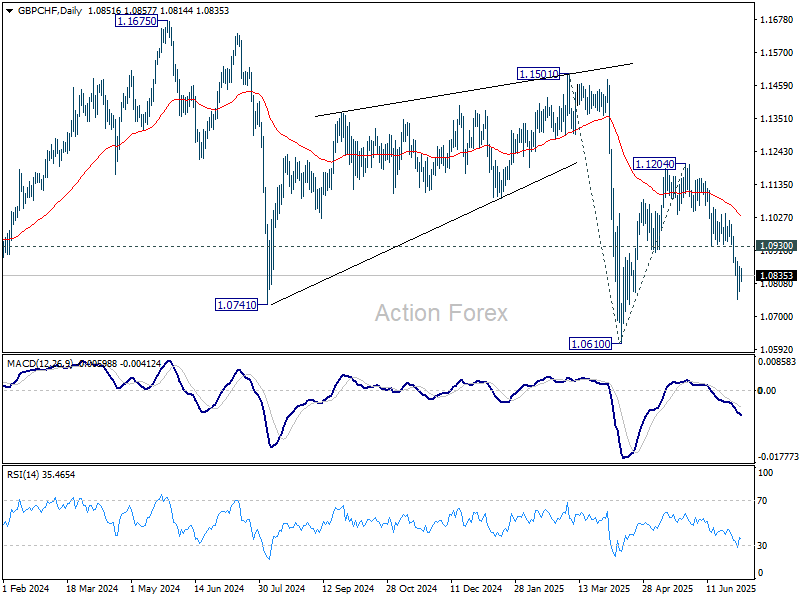
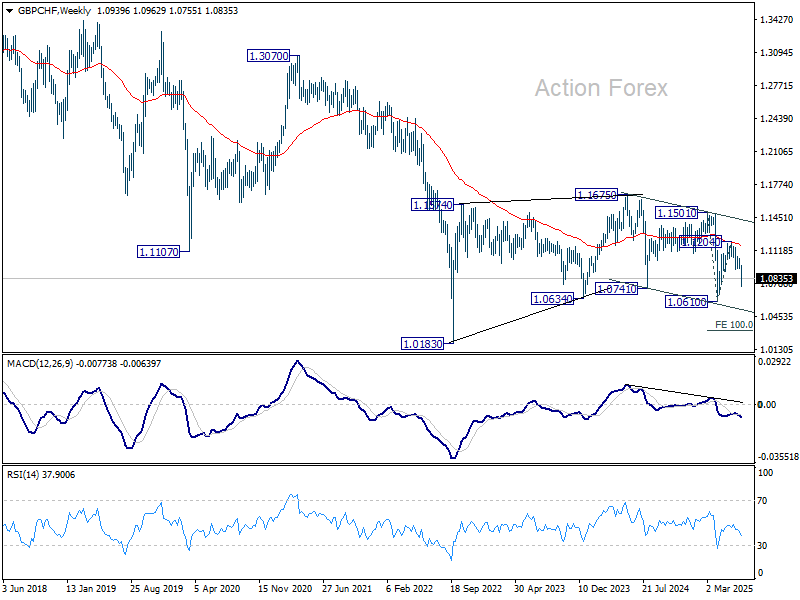
In the bigger picture, prior rejection by 55 W EMA is a medium term bearish sign. Down trend from 1.1675 (2024 high) is likely still in progress. Break of 1.0610 will target 100% projection of 1.1501 to 1.0610 from 1.1204 at 1.0313.
EUR/USD Weekly Outlook
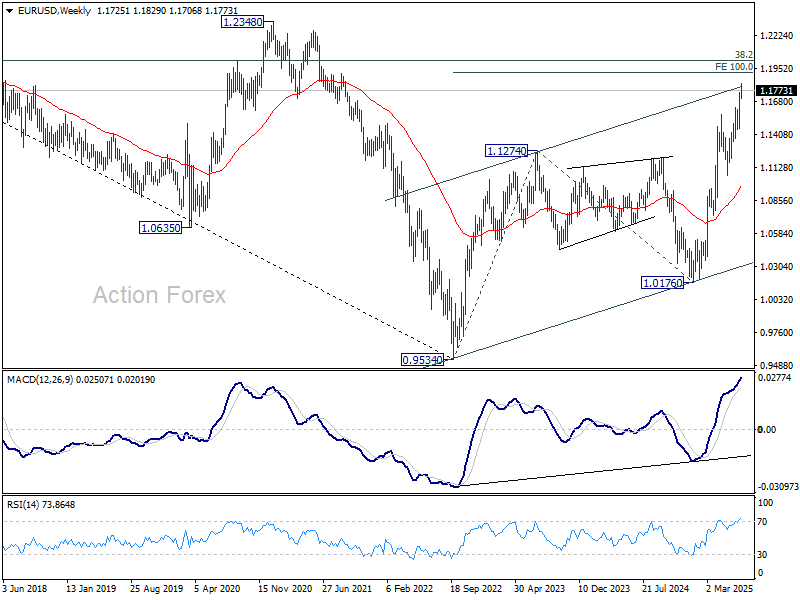
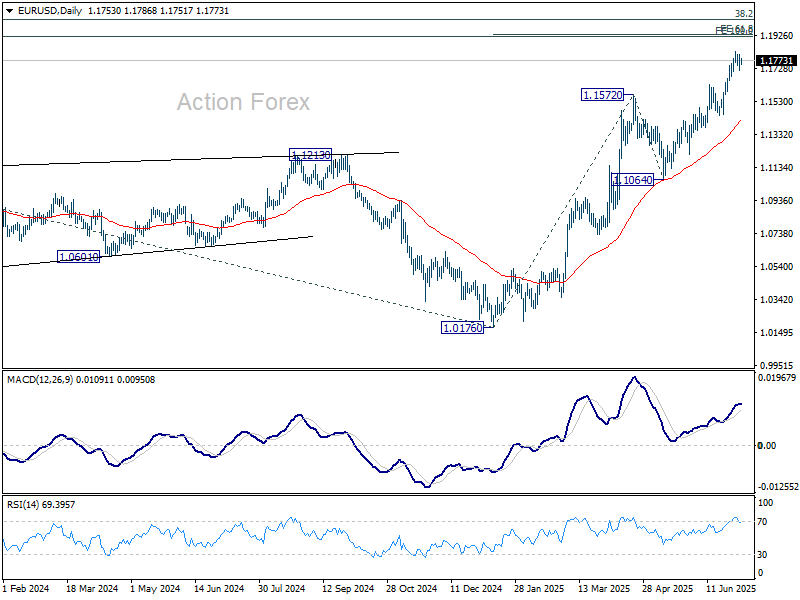
EUR/USD edged higher to 1.1829 last week but turned sideway since then. Initial bias stays neutral this week for more consolidations first. But downside should be contained by 1.1630 resistance turned support to bring rebound. Firm break of 1.1829 will resume the rise from 1.0176 and target 61.8% projection of 1.0176 to 1.1572 from 1.1064 at 1.1927.
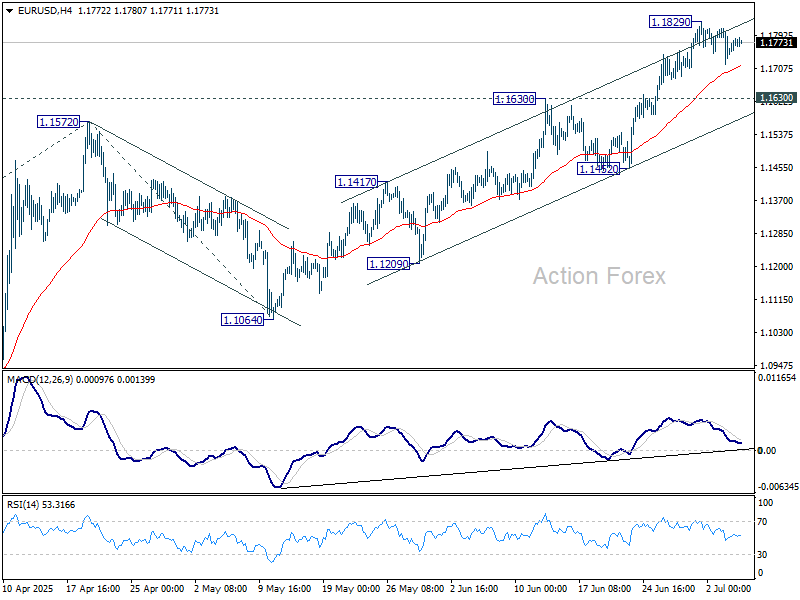
In the bigger picture, rise from 0.9534 long term bottom could be correcting the multi-decade downtrend or the start of a long term up trend. In either case, further rise should be seen to 100% projection of 0.9534 to 1.1274 from 1.0176 at 1.1916. This will now remain the favored case as long as 1.1604 support holds.
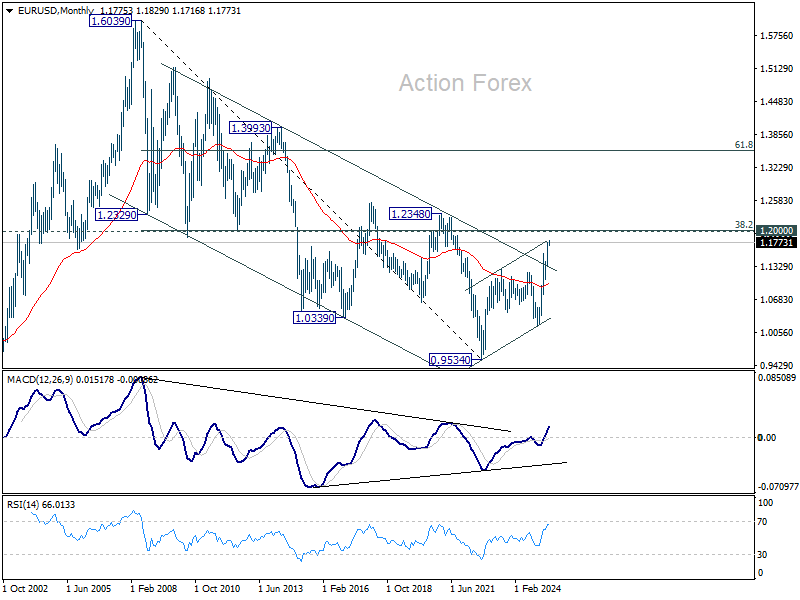
In the long term picture, a long term bottom was in place already at 0.9534, on bullish convergence condition in M MACD. Further rise should be seen to 38.2% retracement of 1.6039 to 0.9534 at 1.2019. Rejection by 1.2019 will keep the price actions from 0.9534 as a corrective pattern. But sustained break of 1.2019 will suggest long term bullish trend reversal, and target 61.8% retracement at 1.3554.