Sample Category Title
Eurozone PPI falls -0.6% mom in May, weak pipeline inflation
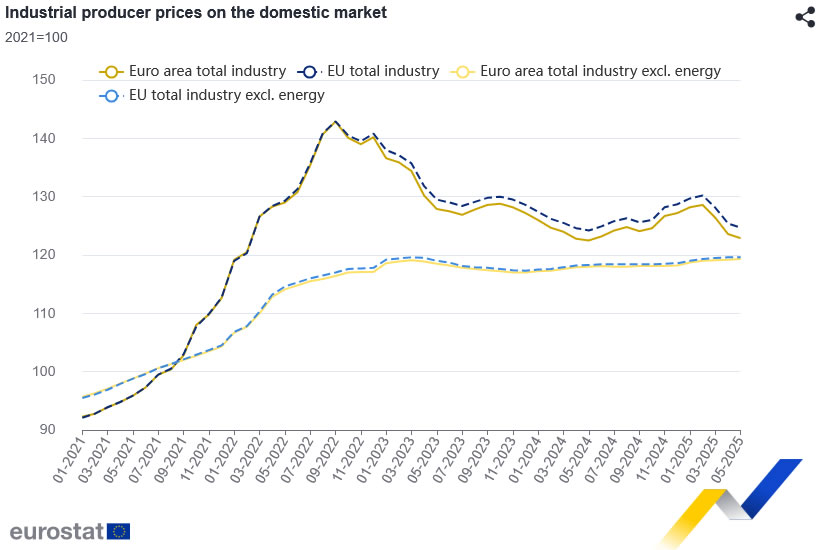
Eurozone PPI fell -0.6% mom in May, in line with market expectations, as falling energy costs drove the decline. On an annual basis, PPI decelerated from 0.7% to 0.3% yoy. Energy prices dropped -2.1% mom on the month, while prices for intermediate goods slipped -0.1% mom. In contrast, prices for durable and non-durable consumer goods rose 0.3% mom and 0.2% respectively mom. Excluding energy, producer prices still edged up 0.1% mom.
Across the EU as a whole, PPI also fell -0.6% mom and eased to 0.4% yoy. Among member states, Bulgaria saw the sharpest monthly drop at -3.7%, followed by Greece (-1.9%) and Finland (-1.8%). A handful of countries including Cyprus (+1.0%) and Latvia (+0.1%) registered modest price gains.
USD/CAD Shrugs Off Upbeat US Jobs Data
- USD/CAD fails to rebound despite stronger US nonfarm payrolls.
- Bearish trend likely to continue; next support near 1.3455.
USD/CAD could not successfully capitalize on stronger-than-expected US nonfarm payrolls, ultimately closing marginally lower on Thursday. The passage of Trump’s megabill in the Republican-controlled House of Representatives – expected to increase fiscal debt by more than $3 trillion – came as no surprise to investors and kept volatility subdued as US investors logged off for the July 4 celebrations.
However, concerns over global trade partners beginning tariff payments on August 1 continued to weigh on market sentiment early on Friday, reinforcing the bearish short-term outlook.
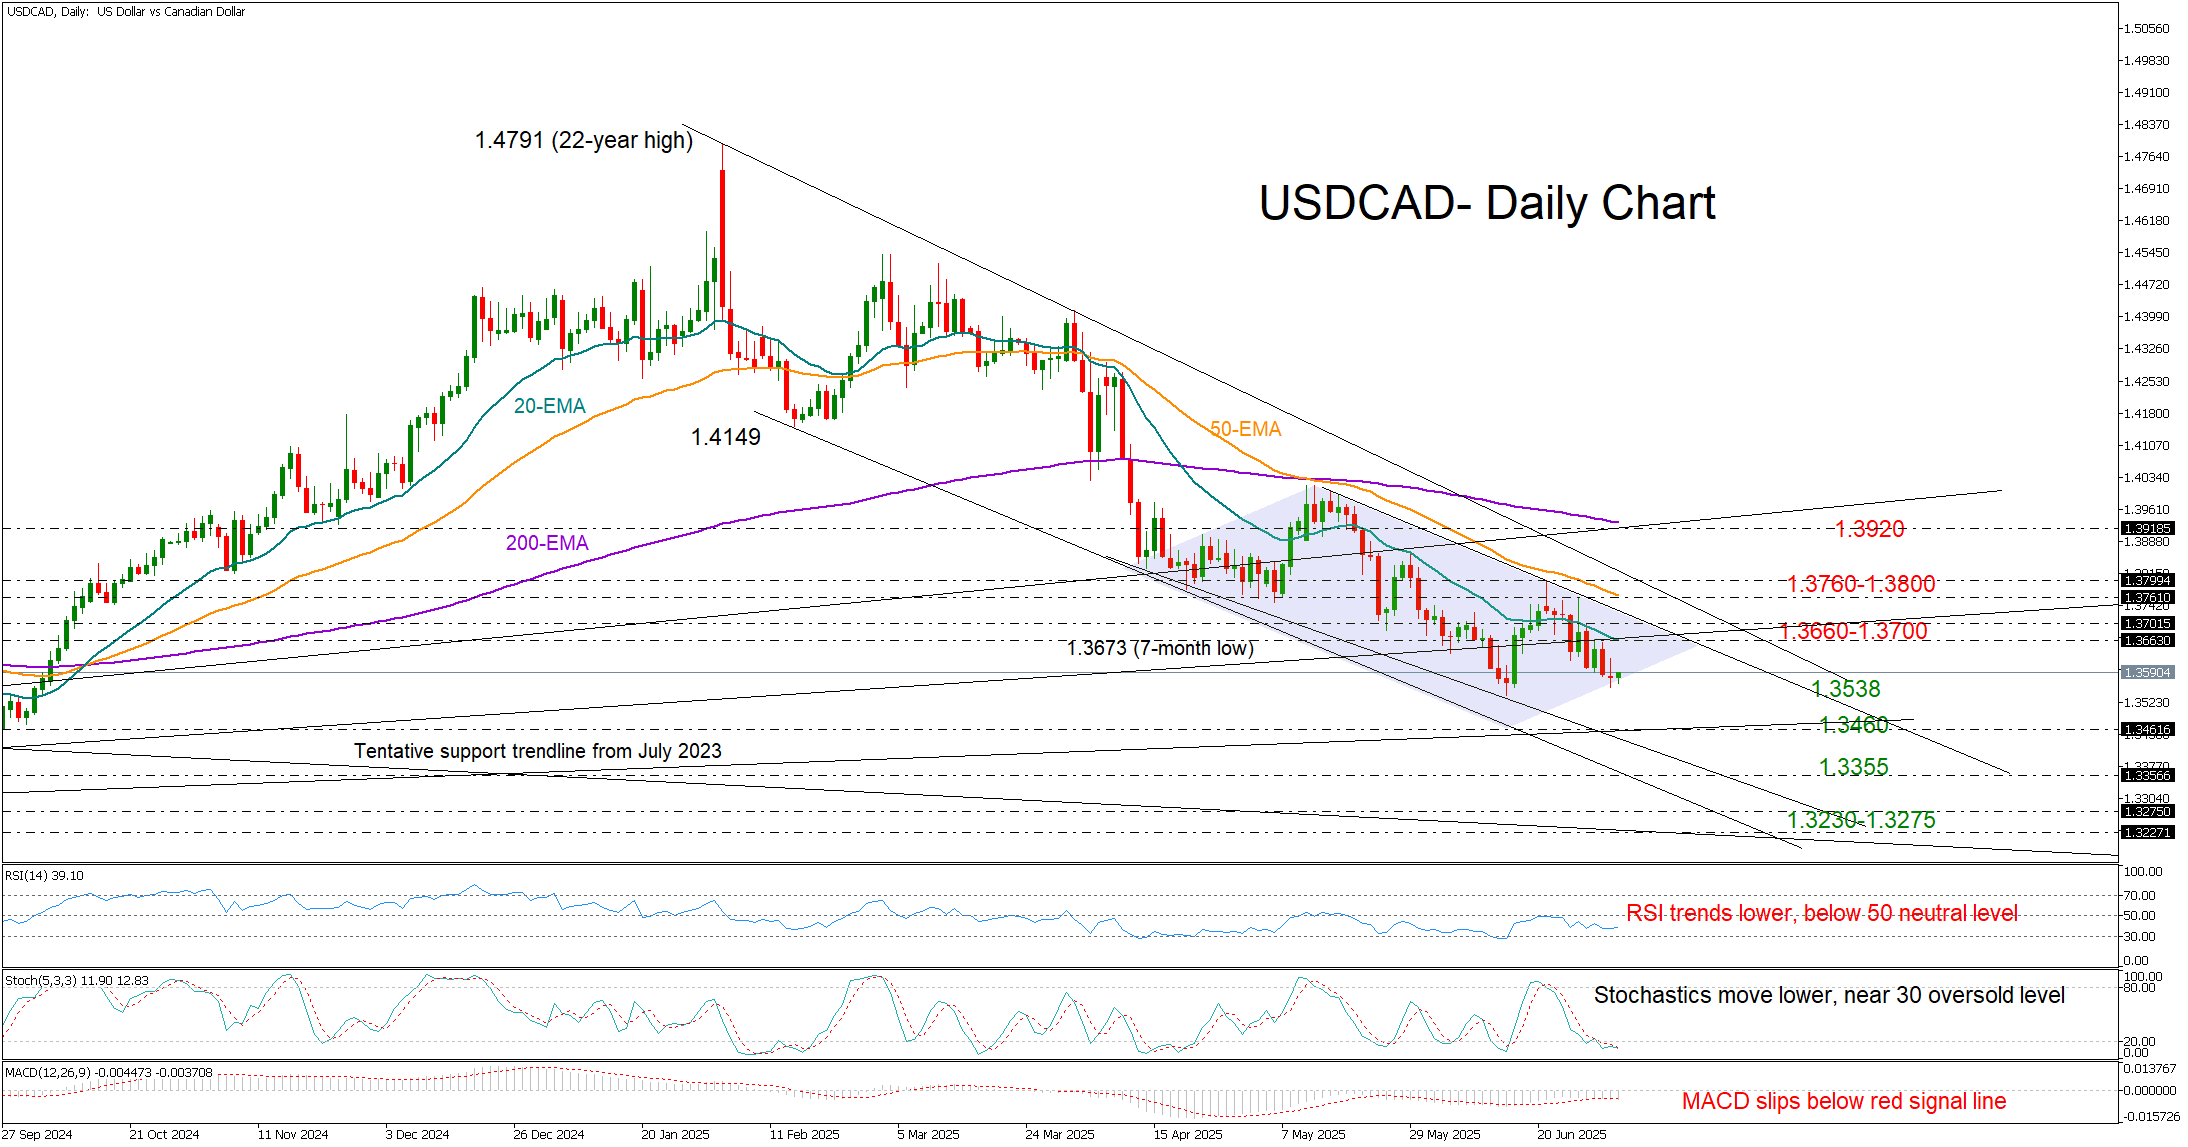
Technical indicators are clearly pointing downwards, flagging a potential downtrend extension below June’s low of 1.3538. In this scenario, the tentative support line from July 2023 could come to the rescue near 1.3455. If this level fails to hold, the decline may accelerate toward the 1.3355 support zone, which was last tested in January–February 2024. A further drop could target the 1.3230–1.3275 area.
On the upside, the bulls may encounter immediate resistance between the 20-day simple exponential average (EMA) at 1.3660 and the psychological 1.3700 level. Further up, the 50-day EMA and the 1.3800 mark, which may limit upward momentum and prevent a swift recovery toward 1.3915.
In summary, the current bearish phase in USD/CAD appears to have more room to run, with a new lower low potentially forming around 1.3460.
S&P 500 Hit Record High Ahead of Holiday Break
Today, financial markets in the United States are closed in observance of Independence Day. Investor sentiment was likely buoyed by the latest rally in the S&P 500 index (US SPX 500 mini on FXOpen), which set a new all-time high yesterday, surpassing 6,280.
The bullish momentum has been driven by robust labour market data in the US. According to ForexFactory, analysts had anticipated a rise in the unemployment rate from 4.2% to 4.3%, but instead, it unexpectedly declined to 4.1%.
Can the stock market continue to climb?
Technical Analysis of the S&P 500 Chart
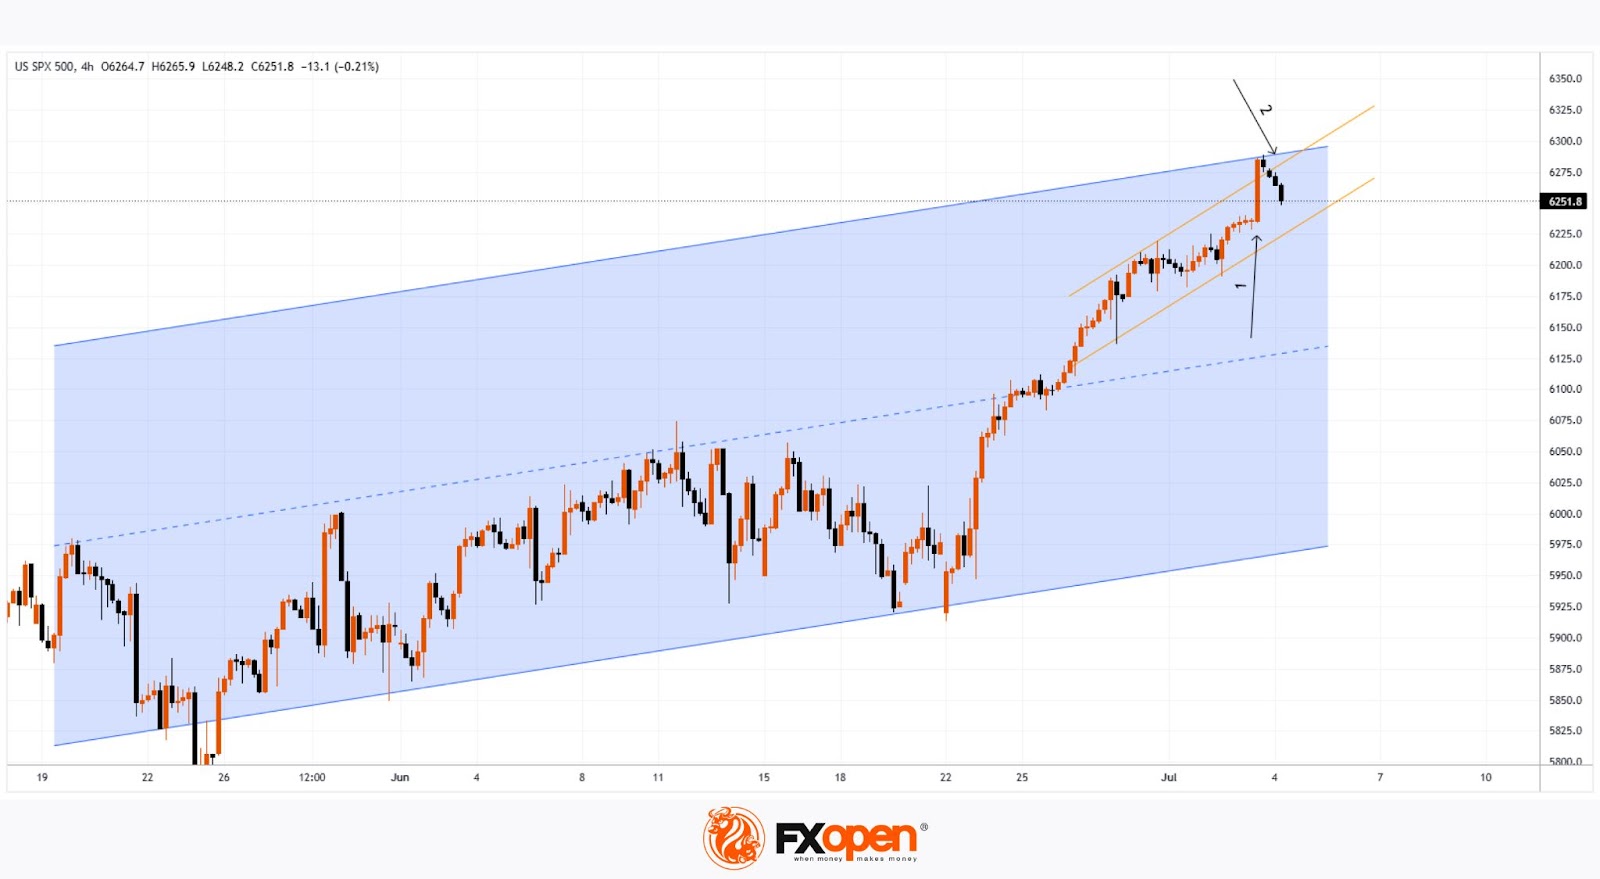
Analysing the 4-hour chart of the S&P 500 index (US SPX 500 mini on FXOpen)on 30 June, we observed the following:
→ An ascending channel was formed (indicated in blue);
→ A developing bullish impulse (marked with an orange line) suggested the price would move towards the upper boundary of the channel – a scenario that materialised with yesterday’s rally (as shown by arrow 1).
However, from a price action perspective, the recent downward move (arrow 2) has now gained significance. It may indicate that sellers are becoming more active around the identified resistance level.
Should the price decline towards the lower orange line, this could negate the current bullish impulse altogether, effectively reflecting a classic bearish engulfing pattern.
Given the above, there is reason to believe that bears are attempting to regain control after the S&P 500 (US SPX 500 mini on FXOpen) surged over 5% in the past 10 days. As such, a potential breakout below the orange line cannot be ruled out, with price action possibly targeting the median of the blue ascending channel.
What happens next?
The market’s trajectory will largely hinge on developments related to tariffs. Trade policy will remain in the spotlight next week, as key deadlines set by the White House approach — events that traders will be closely monitoring.
Trade global index CFDs with zero commission and tight spreads. Open your FXOpen account now or learn more about trading index CFDs with FXOpen.
This article represents the opinion of the Companies operating under the FXOpen brand only. It is not to be construed as an offer, solicitation, or recommendation with respect to products and services provided by the Companies operating under the FXOpen brand, nor is it to be considered financial advice.
ECB’s Lagarde urges reforms to boost Euro’s global standing
ECB President Christine Lagarde said Euro can only rival the US Dollar’s dominance in global finance if European Union leaders commit to improving productivity and internal efficiency. In an interview with German broadcaster ARD, Lagarde called on EU policymakers to reduce trade barriers within the bloc and simplify regulatory frameworks.
“Political leaders need to engage to make our economy more productive and more efficient,” she said, adding that such steps are essential for Euro to become the world’s leading currency.
Lagarde also reiterated that interest rates in the Eurozone are now “in a good place” following June’s deposit rate cut to 2.00%. She emphasized ECB's full commitment to its 2% inflation target.
GBP/JPY Daily Outlook
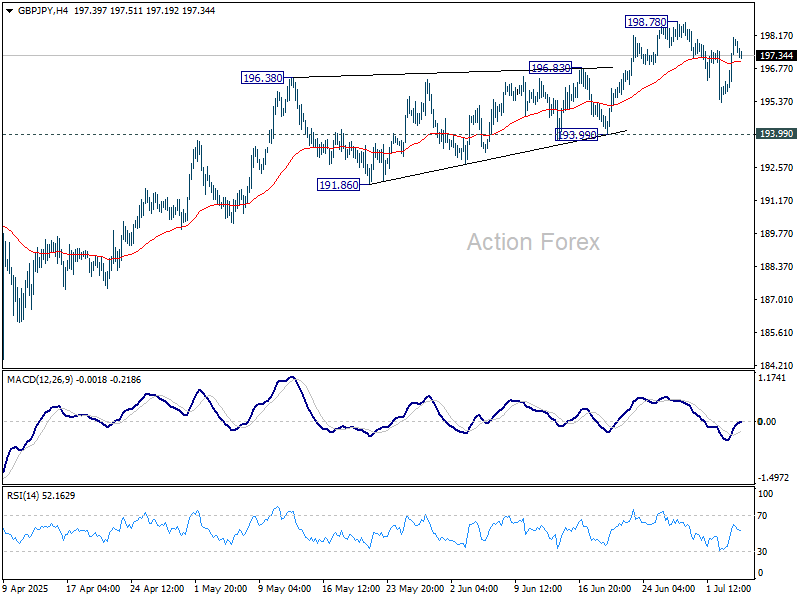
Daily Pivots: (S1) 196.40; (P) 197.25; (R1) 198.75; More...
GBP/JPY is staying in consolidations below 198.78 and intraday bias remains neutral at this point. Another dip might be seen but outlook will stay bullish as long as 193.99 support holds. Above 198.78 will resume the rise from 184.35 to 199.79 resistance. Break there will target 100% projection of 180.00 to 199.79 from 184.35 at 204.14.
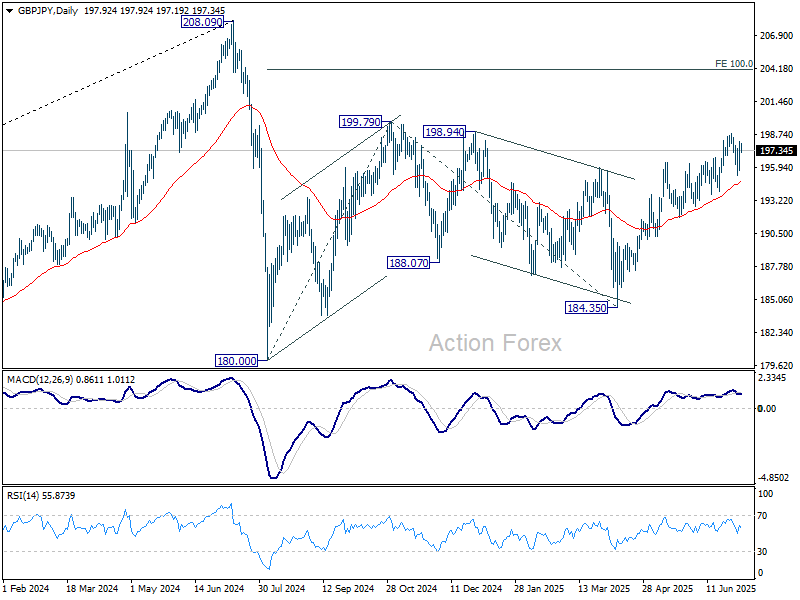
In the bigger picture, price actions from 208.09 are seen as a correction to rally from 123.94 (2020 low). Strong support should be seen from 38.2% retracement of 123.94 to 208.09 at 175.94 to contain downside. However, sustained break of 175.94 will bring deeper fall even still as a correction.
EUR/JPY Daily Outlook
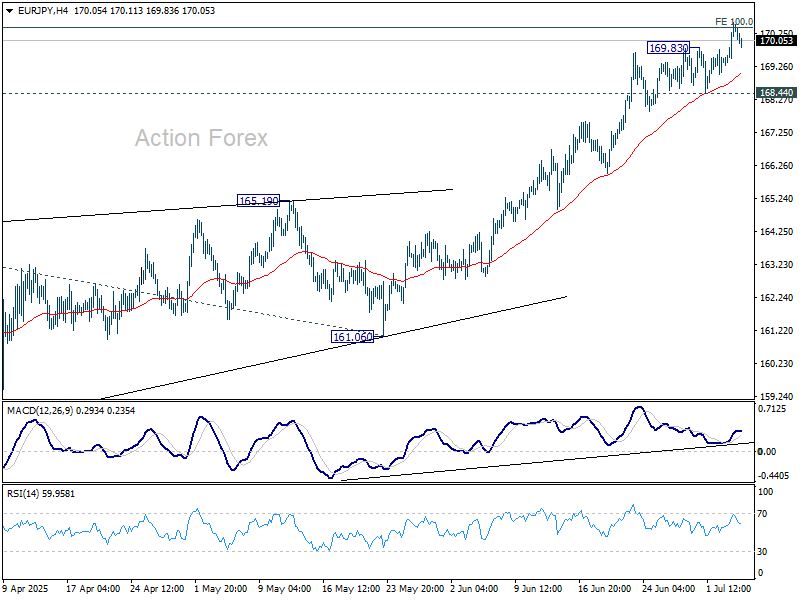
Daily Pivots: (S1) 169.60; (P) 170.10; (R1) 170.90; More...
EUR/JPY's rally resumed after brief consolidations and met 100% projection of 154.77 to 164.16 from 161.06 at 170.45 already. Intraday bias is back on the upside. Sustained trading above 170.45 will extend the rise from 154.77 to 138.2% projection at 174.03. On the downside, however, break of 168.44 support will indicate short term topping, and turn bias to the downside for deeper pullback.
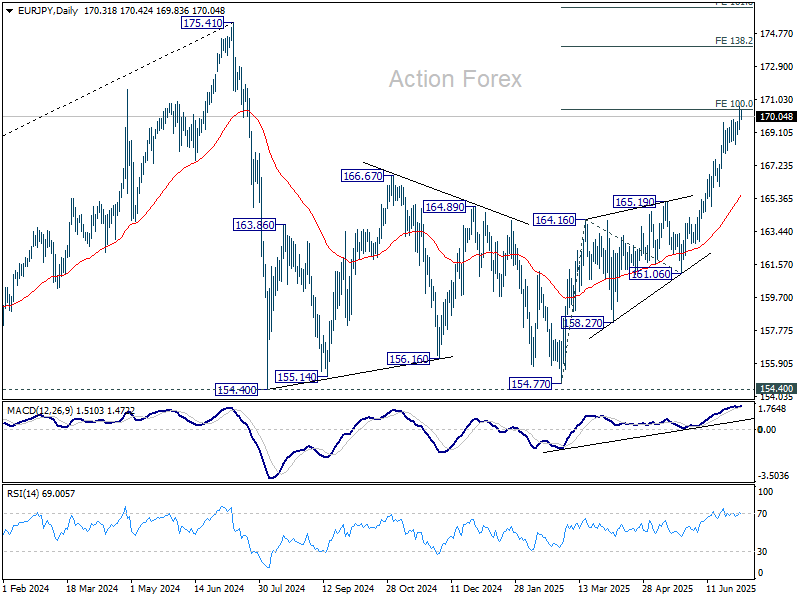
In the bigger picture, price actions from 175.41 are seen as correction to up trend from 114.42 (2020 low). Strong support should be seen from 38.2% retracement of 114.42 to 175.41 at 152.11 to contain downside. However, sustained break of 152.11 will bring deeper fall even still as a correction.
EUR/GBP Daily Outlook
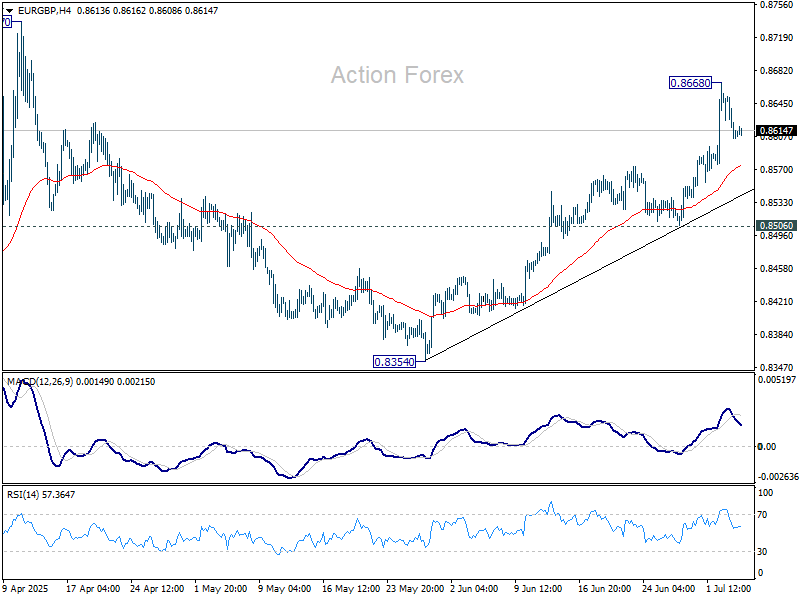
Daily Pivots: (S1) 0.8591; (P) 0.8624; (R1) 0.8642; More...
Intraday bias in EUR/GBP is turned neutral with current retreat, and some consolidations could be seen below 0.8668 temporary top. Further rally is expected as long as 0.8506 support holds. Above 0.8668 will resume the rally from 0.8354 to retest 0.8737 high. Decisive break there will resume the whole rise from 0.8221 low.
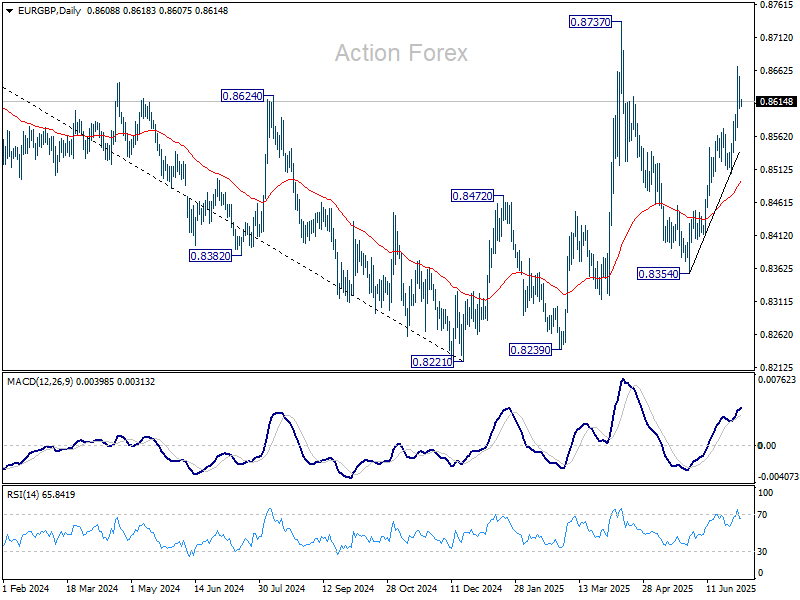
In the bigger picture, the structure from 0.8221 medium term bottom are not impulsive enough to suggest that it's reversing the downside from 0.9267 (2022 high). But even if it's a correction, firm break of 0.8737 will still pave the way to 61.8% retracement of 0.9267 to 0.8221 at 0.8867.
EUR/AUD Daily Outlook
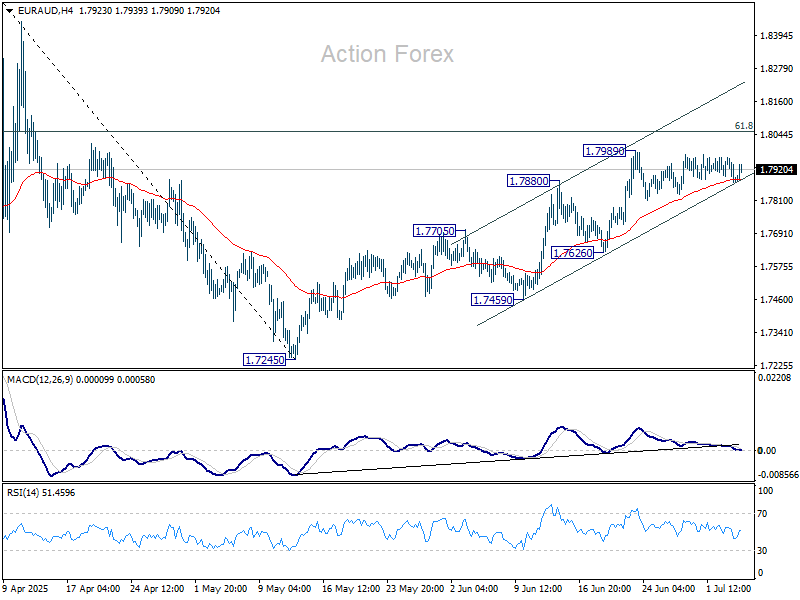
Daily Pivots: (S1) 1.7857; (P) 1.7912; (R1) 1.7947; More...
EUR/AUD is staying in tight range below 1.7989. Intraday bias stays neutral and more consolidations could be seen. Further rally is expected as long as 1.7626 support holds. Above 1.7989 will target 61.8% retracement of 1.8554 to 1.7245 at 1.8054. Sustained break there will pave the way to 1.8554.
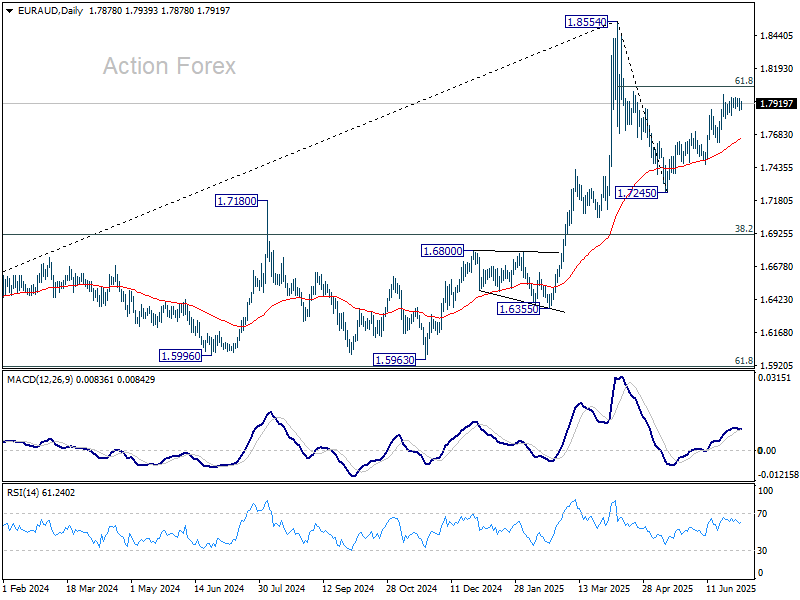
In the bigger picture, price actions from 1.8554 medium term are seen as a corrective pattern. While deeper pullback might be seen, downside should be contained by 38.2% retracement of 1.4281 (2022 low) to 1.8554 at 1.6922 to bring rebound. Up trend from 1.4281 is expected to resume at a later stage.
EUR/CHF Daily Outlook
Daily Pivots: (S1) 0.9328; (P) 0.9346; (R1) 0.9370; More....
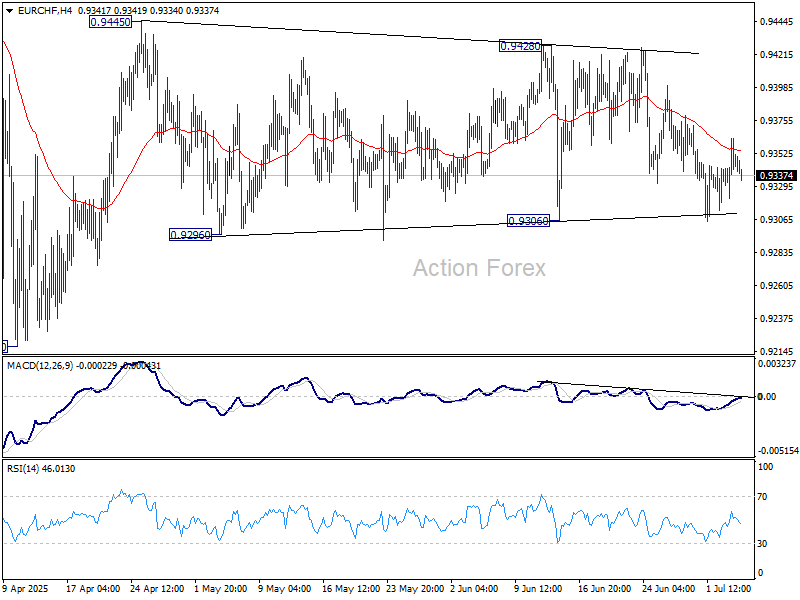
EUR/CHF is still bounded in sideway trading and intraday bias remains neutral. On the downside, decisive break of 0.9306 support will turn bias to the downside for retesting 0.9218 low. On the upside, break of 0.9428/45 resistance zone will resume the rebound from 0.9218.
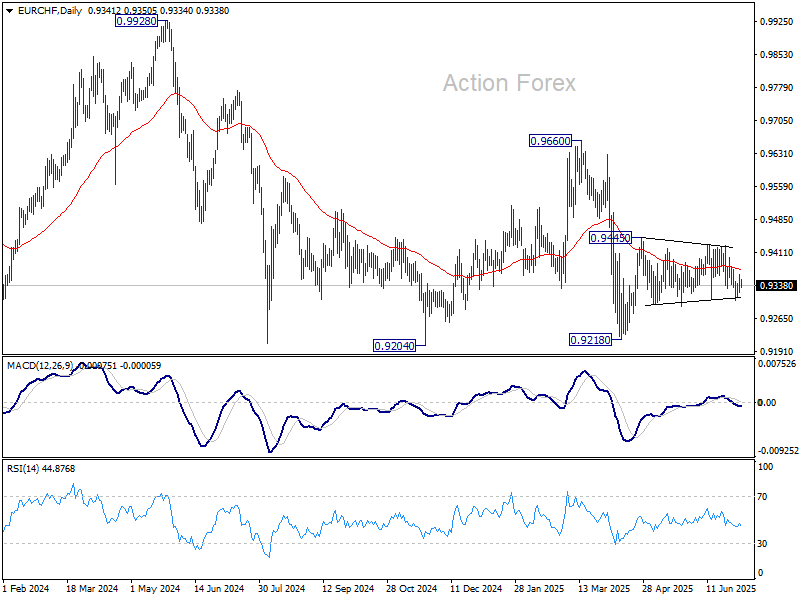
In the bigger picture, while downside momentum has been diminishing as seen in W MACD, there is no sign of bottoming yet. EUR/CHF is still staying below 55 W EMA and well inside long term falling channel. Outlook will stay bearish as long as 0.9660 resistance holds. Break of 0.9204 (2024 low) will confirm resumption of down trend from 1.2004 (2018 high).
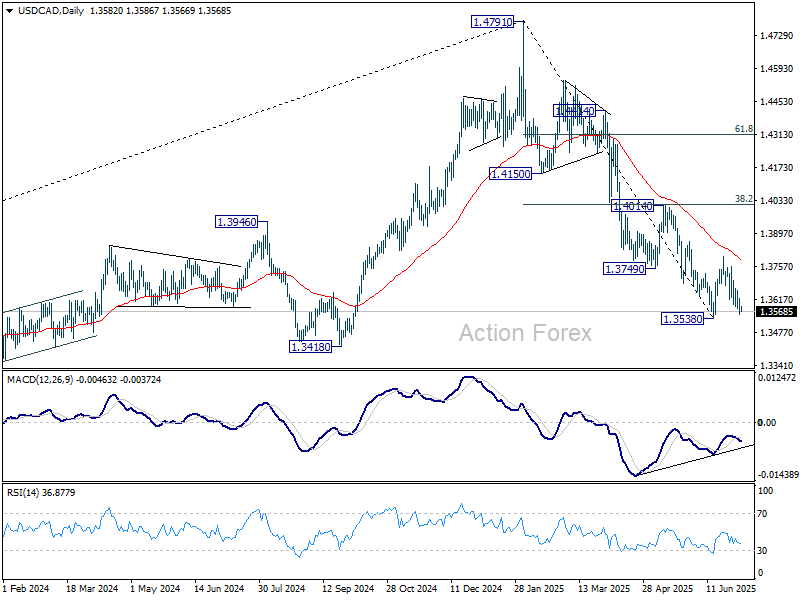
USD/CAD Daily Outlook
Daily Pivots: (S1) 1.3553; (P) 1.3589; (R1) 1.3620; More...
Intraday bias in USD/CAD stays mildly on the downside for retesting 1.3538 low. Firm break there will resume larger decline from 1.4791. On the upside, break of 1.3666 minor resistance will delay the bearish case, and extend the corrective pattern from 1.3538 will another rise back to 1.3797 resistance.
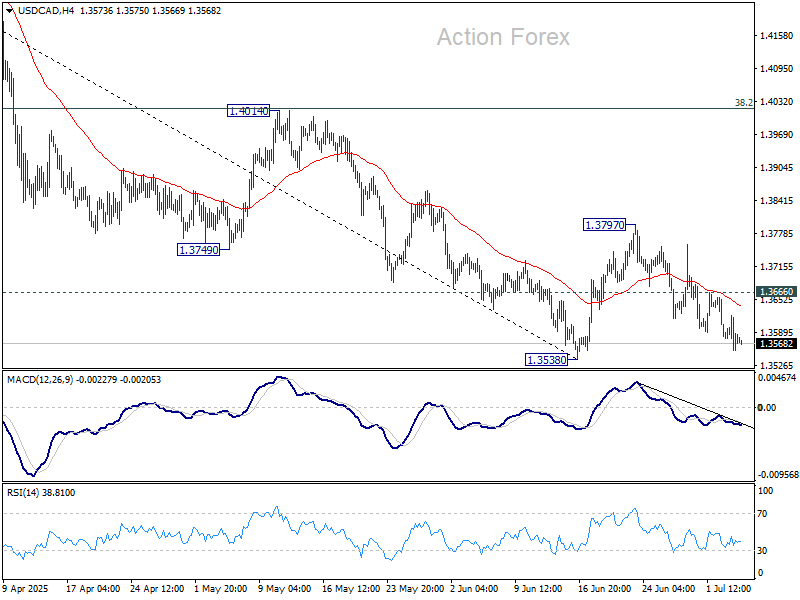
In the bigger picture, price actions from 1.4791 medium term top could either be a correction to rise from 1.2005 (2021 low), or trend reversal. In either case, further decline is expected as long as 1.4014 resistance holds. Next target is 61.8% retracement of 1.2005 (2021 low) to 1.4791 at 1.3069.