
Sample Category Title
EUR/CHF Weekly Outlook
EUR/CHF gyrated lower to 0.9305 last week but quickly recovered after drawing support from 0.9306. Overall, range trading is still in progress. Initial bias stays neutral this week first. On the upside, break of 0.9428/45 resistance zone will resume the rebound from 0.9218. On the downside, break of 0.9305 will bring retest of 0.9218 low instead.
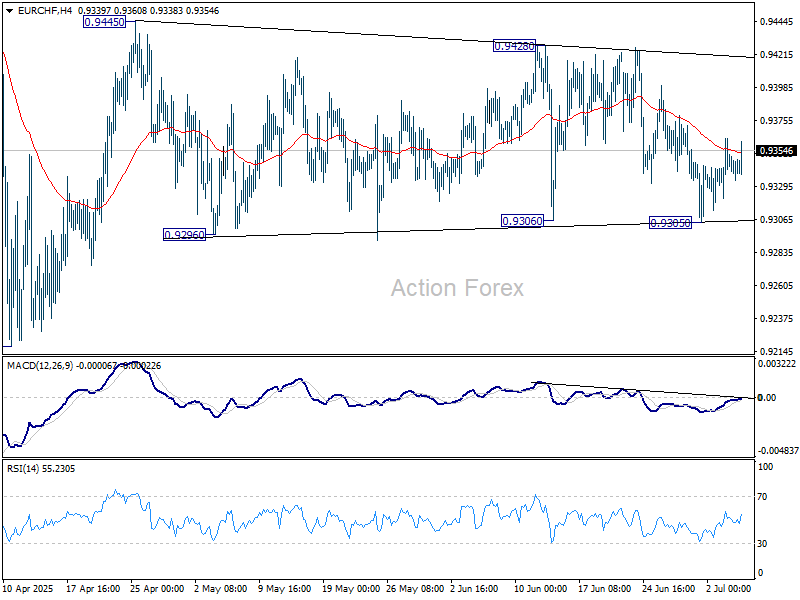
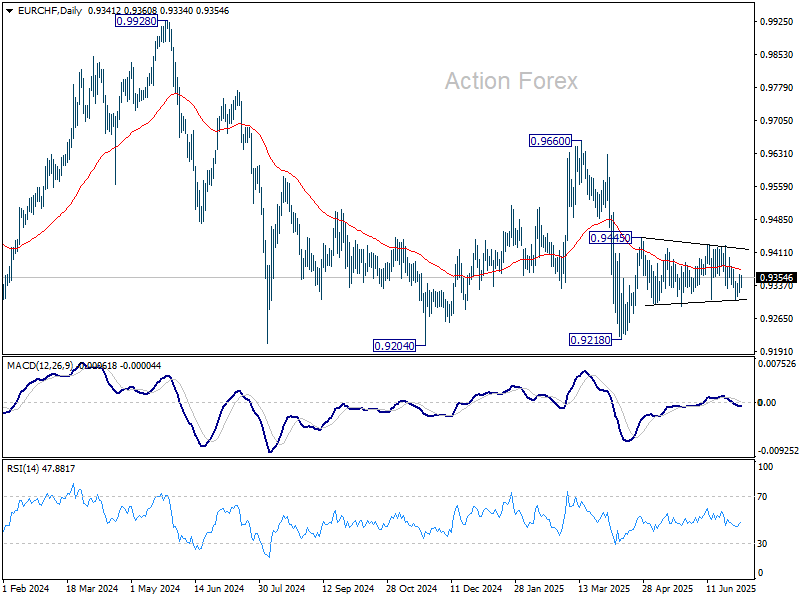
In the bigger picture, while downside momentum has been diminishing as seen in W MACD, there is no sign of bottoming yet. EUR/CHF is still staying below 55 W EMA (now at 0.9437) and well inside long term falling channel. Outlook will stay bearish as long as 0.9660 resistance holds. Break of 0.9204 (2024 low) will confirm resumption of down trend from 1.2004 (2018 high).
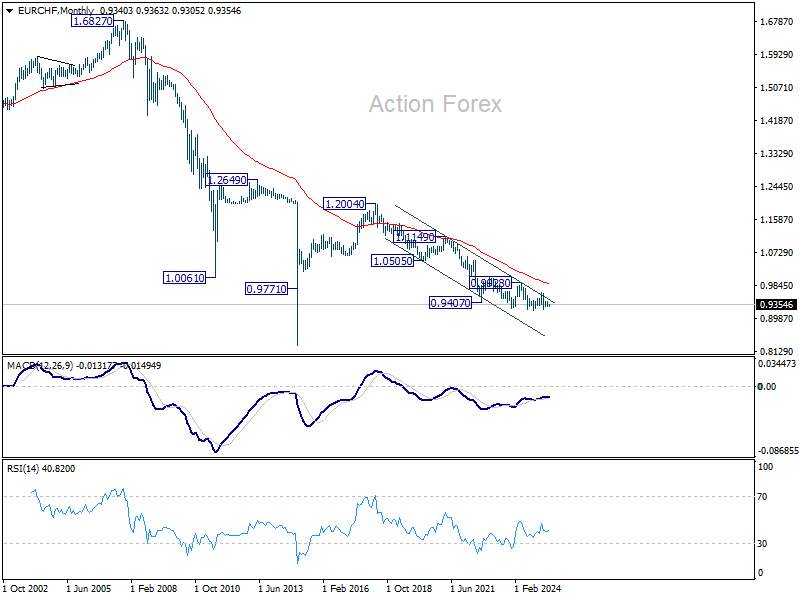
In the long term picture, overall long term down trend is still in progress in EUR/CHF. Outlook will continue to stay bearish as long as 55 M EMA (now at 0.9898) holds.

Summary 7/7 – 7/11
Monday, Jul 7, 2025
| GMT | Ccy | Events | Consensus | Previous |
|---|---|---|---|---|
| 23:30 | JPY | Labor Cash Earnings Y/Y May | 2.40% | 2.30% |
| 05:00 | JPY | Leading Economic Index May P | 105.3 | 104.2 |
| 06:00 | EUR | Germany Industrial Production M/M May | -0.60% | -1.40% |
| 07:00 | CHF | Foreign Currency Reserves (CHF) Jun | 704B | |
| 08:30 | EUR | Eurozone Sentix Investor Confidence Jul | 1.1 | 0.2 |
| 09:00 | EUR | Eurozone Retail Sales M/M May | -0.80% | 0.10% |
| 23:50 | JPY | Bank Lending Y/Y Jun | 2.30% | 2.40% |
| 23:50 | JPY | Current Account (JPY) May | 2.58T | 2.31T |
| GMT | Ccy | Events | |
|---|---|---|---|
| 23:30 | JPY | Labor Cash Earnings Y/Y May | |
| Forecast: 2.40% | Previous: 2.30% | ||
| 05:00 | JPY | Leading Economic Index May P | |
| Forecast: 105.3 | Previous: 104.2 | ||
| 06:00 | EUR | Germany Industrial Production M/M May | |
| Forecast: -0.60% | Previous: -1.40% | ||
| 07:00 | CHF | Foreign Currency Reserves (CHF) Jun | |
| Forecast: | Previous: 704B | ||
| 08:30 | EUR | Eurozone Sentix Investor Confidence Jul | |
| Forecast: 1.1 | Previous: 0.2 | ||
| 09:00 | EUR | Eurozone Retail Sales M/M May | |
| Forecast: -0.80% | Previous: 0.10% | ||
| 23:50 | JPY | Bank Lending Y/Y Jun | |
| Forecast: 2.30% | Previous: 2.40% | ||
| 23:50 | JPY | Current Account (JPY) May | |
| Forecast: 2.58T | Previous: 2.31T | ||
Tuesday, Jul 8, 2025
| GMT | Ccy | Events | Consensus | Previous |
|---|---|---|---|---|
| 01:30 | AUD | NAB Business Confidence Jun | 2 | |
| 01:30 | AUD | NAB Business Conditions Jun | 0 | |
| 04:30 | AUD | RBA Interest Rate Decision | 3.60% | 3.85% |
| 05:00 | JPY | Eco Watchers Survey: Current Jun | 45.2 | 44.4 |
| 05:30 | AUD | RBA Press Conference | ||
| 06:00 | EUR | Germany Trade Balance (EUR) May | 18.1B | 14.6B |
| 06:45 | EUR | France Trade Balance (EUR) May | -7.7B | -8.0B |
| 10:00 | USD | NFIB Business Optimism Index Jun | 98.9 | 98.8 |
| 14:00 | CAD | Ivey PMI Jun | 49.1 | 48.9 |
| 23:50 | JPY | Money Supply M2+CD Y/Y Jun | 0.20% | 0.60% |
| GMT | Ccy | Events | |
|---|---|---|---|
| 01:30 | AUD | NAB Business Confidence Jun | |
| Forecast: | Previous: 2 | ||
| 01:30 | AUD | NAB Business Conditions Jun | |
| Forecast: | Previous: 0 | ||
| 04:30 | AUD | RBA Interest Rate Decision | |
| Forecast: 3.60% | Previous: 3.85% | ||
| 05:00 | JPY | Eco Watchers Survey: Current Jun | |
| Forecast: 45.2 | Previous: 44.4 | ||
| 05:30 | AUD | RBA Press Conference | |
| Forecast: | Previous: | ||
| 06:00 | EUR | Germany Trade Balance (EUR) May | |
| Forecast: 18.1B | Previous: 14.6B | ||
| 06:45 | EUR | France Trade Balance (EUR) May | |
| Forecast: -7.7B | Previous: -8.0B | ||
| 10:00 | USD | NFIB Business Optimism Index Jun | |
| Forecast: 98.9 | Previous: 98.8 | ||
| 14:00 | CAD | Ivey PMI Jun | |
| Forecast: 49.1 | Previous: 48.9 | ||
| 23:50 | JPY | Money Supply M2+CD Y/Y Jun | |
| Forecast: 0.20% | Previous: 0.60% | ||
Wednesday, Jul 9, 2025
| GMT | Ccy | Events | Consensus | Previous |
|---|---|---|---|---|
| 01:30 | CNY | CPI Y/Y Jun | -0.10% | -0.10% |
| 01:30 | CNY | PPI Y/Y Jun | -3.20% | -3.30% |
| 02:00 | NZD | RBNZ Interest Rate Decision | 3.25% | 3.25% |
| 06:00 | JPY | Machine Tool Orders Y/Y Jun | 3.40% | 3.40% |
| 14:00 | USD | Wholesale Inventories May F | -0.30% | -0.30% |
| 14:30 | USD | Crude Oil Inventories | 3.8M | |
| 18:00 | USD | FOMC Minutes | ||
| 23:50 | JPY | PPI Y/Y Jun | 3.20% |
| GMT | Ccy | Events | |
|---|---|---|---|
| 01:30 | CNY | CPI Y/Y Jun | |
| Forecast: -0.10% | Previous: -0.10% | ||
| 01:30 | CNY | PPI Y/Y Jun | |
| Forecast: -3.20% | Previous: -3.30% | ||
| 02:00 | NZD | RBNZ Interest Rate Decision | |
| Forecast: 3.25% | Previous: 3.25% | ||
| 06:00 | JPY | Machine Tool Orders Y/Y Jun | |
| Forecast: 3.40% | Previous: 3.40% | ||
| 14:00 | USD | Wholesale Inventories May F | |
| Forecast: -0.30% | Previous: -0.30% | ||
| 14:30 | USD | Crude Oil Inventories | |
| Forecast: | Previous: 3.8M | ||
| 18:00 | USD | FOMC Minutes | |
| Forecast: | Previous: | ||
| 23:50 | JPY | PPI Y/Y Jun | |
| Forecast: | Previous: 3.20% | ||
Thursday, Jul 10, 2025
| GMT | Ccy | Events | Consensus | Previous |
|---|---|---|---|---|
| 12:30 | USD | Initial Jobless Claims (Jul 4) | 233K | |
| 14:30 | USD | Natural Gas Storage | 55B | |
| 22:30 | NZD | Business NZ PMI Jun | 47.5 |
| GMT | Ccy | Events | |
|---|---|---|---|
| 12:30 | USD | Initial Jobless Claims (Jul 4) | |
| Forecast: | Previous: 233K | ||
| 14:30 | USD | Natural Gas Storage | |
| Forecast: | Previous: 55B | ||
| 22:30 | NZD | Business NZ PMI Jun | |
| Forecast: | Previous: 47.5 | ||
Friday, Jul 11, 2025
| GMT | Ccy | Events | Consensus | Previous |
|---|---|---|---|---|
| 06:00 | EUR | Germany CPI M/M Jun F | 0% | 0% |
| 06:00 | EUR | Germany CPI Y/Y Jun F | 2% | 2% |
| 06:00 | GBP | GDP M/M May | -0.30% | |
| 06:00 | GBP | Manufacturing Production M/M May | -0.90% | |
| 06:00 | GBP | Manufacturing Production Y/Y May | 0.40% | |
| 06:00 | GBP | Industrial Production Y/Y May | -0.30% | |
| 06:00 | GBP | Industrial Production M/M May | -0.60% | |
| 06:00 | GBP | Goods Trade Balance (GBP) May | -23.2B | |
| 12:30 | CAD | Net Change in Employment Jun | 8.8K | |
| 12:30 | CAD | Unemployment Rate Jun | 7% | |
| 12:30 | CAD | Building Permits M/M May | -6.60% |
| GMT | Ccy | Events | |
|---|---|---|---|
| 06:00 | EUR | Germany CPI M/M Jun F | |
| Forecast: 0% | Previous: 0% | ||
| 06:00 | EUR | Germany CPI Y/Y Jun F | |
| Forecast: 2% | Previous: 2% | ||
| 06:00 | GBP | GDP M/M May | |
| Forecast: | Previous: -0.30% | ||
| 06:00 | GBP | Manufacturing Production M/M May | |
| Forecast: | Previous: -0.90% | ||
| 06:00 | GBP | Manufacturing Production Y/Y May | |
| Forecast: | Previous: 0.40% | ||
| 06:00 | GBP | Industrial Production Y/Y May | |
| Forecast: | Previous: -0.30% | ||
| 06:00 | GBP | Industrial Production M/M May | |
| Forecast: | Previous: -0.60% | ||
| 06:00 | GBP | Goods Trade Balance (GBP) May | |
| Forecast: | Previous: -23.2B | ||
| 12:30 | CAD | Net Change in Employment Jun | |
| Forecast: | Previous: 8.8K | ||
| 12:30 | CAD | Unemployment Rate Jun | |
| Forecast: | Previous: 7% | ||
| 12:30 | CAD | Building Permits M/M May | |
| Forecast: | Previous: -6.60% | ||
Markets Weekly Outlook – RBA and RBNZ Rate Decisions, July 9th Trump Deadline and BRICS Meeting Trading on the...
Week in review: Strictly risk-on Markets, Non-Farm Payrolls beat & US Deals
This week was heavily focused around the US with Indices hitting almost daily all-time highs in a stringent euphoric mood, with markets turning from War fears back to "TACO" trades, bullish on global economic outlook.
One thing to note is that asset managers are increasingly more bullish on stocks and market mood maybe a bit too euphoric, which may pull positioning too far on one side and lead to higher volatility in case of bad news – with some catalysts coming with the July 9th Trump deadline.
In terms of data, markets saw ECB inflation rates consolidating around 2% with some policymakers, the latest with Banque de France's Villeroy commenting on the potential deflationary impact of a stronger Euro.
More directly market moving however was the streak of positive data releases for the United States, particularly as it comes to employment with NFP at +37K vs expectations and a beat on JOLTS.
One thing to be wary about in the solidity of that data point is the major rise in Government Jobs, providing a boost to the data without generating direct contribution to GDP.
Only ADP Private Employment missed, and and the miss was not a small one: -33K vs 97K expected.
This point of data tends to be less market moving than NFP, however Jerome Powell had previously mentioned private employment as a reason for the last year's one-off 50 Bps cut from the FED.
The Week ahead: RBA and RBNZ rate decisions, July 9th Trump deadline, FOMC Minutes and BRICS Meeting
The week ahead will shift the market's focus back to central banks and geopolitics, as participants brace for a series of global catalysts that could reintroduce uncertainty after several weeks of sustained positive sentiment.
Asia-Pacific Markets
Reserve Bank of Australia Rate Decision
The Reserve Bank of Australia, after cutting its cash rate by 25 bps to 3.85 % in May (its first trim since January), is widely expected to shave another 25 bps to around 3.60 % at its upcoming meeting as inflation cools but global headwinds linger.
The decision will be released in the July 7th to 8th overnight session at 00:30 A.M. (8/07).
Reserve Bank of New Zealand Rate Decision
The Reserve Bank of New Zealand—having lowered its OCR by 25 bps to 3.25 % in May—is forecast to hold rates at 3.25 % on Tuesday July 8th at 10:00 PM, though markets see further easing into early 2026 amid a still‑negative output gap.
Central Bank Cut/Hike Market Pricing
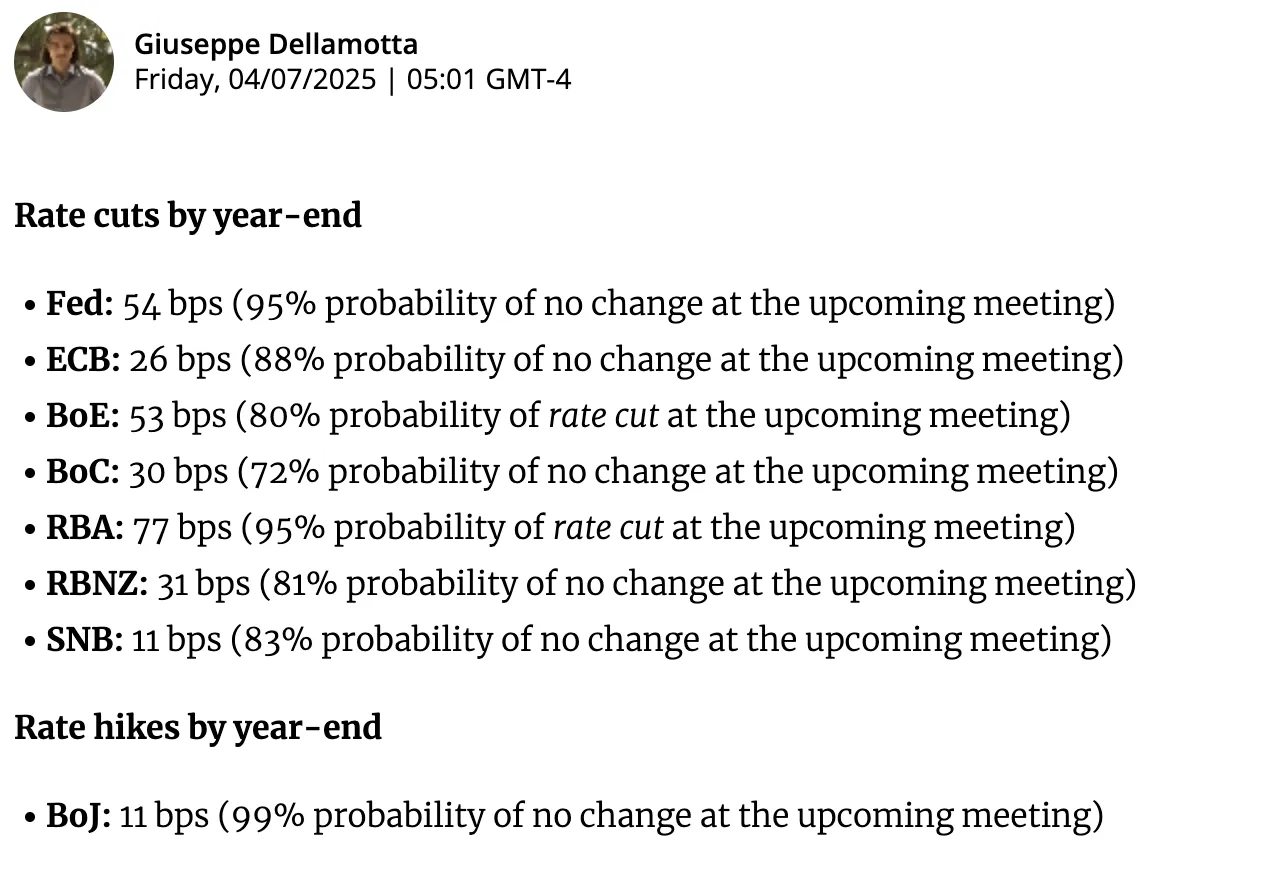 Central Bank Cut/Hike market pricing – Source: Forexlive.com
BRICS Meeting in Rio De Janeiro
Brazil, Russia, India, China, and South Africa will convene this week in Rio de Janeiro, July 6 and 7 to discuss current geopolitical issues, including US tariffs, recent Middle East developments and other habitual subjects (expansion, climate action, commodity demand, development goals, ...).
Economic Data from Europe, UK and North America
North America will mostly be concerned with the July 9th deadline from the Trump Administration to start imposing tariffs, which even though it had been priced in severely in the beginning of this year, has been broadly downplayed in the "TACO" trade trend.
Don't forget the few bouts of CAD moving data with Ivey PMI on Tuesday at 10:00 A.M. and Canadian Employment on Friday at 8:30 ET.
In European markets, economic releases will mostly focus on the Eurozone Retail Sales and some ECB Speakers – the rest will be lower-tier data.
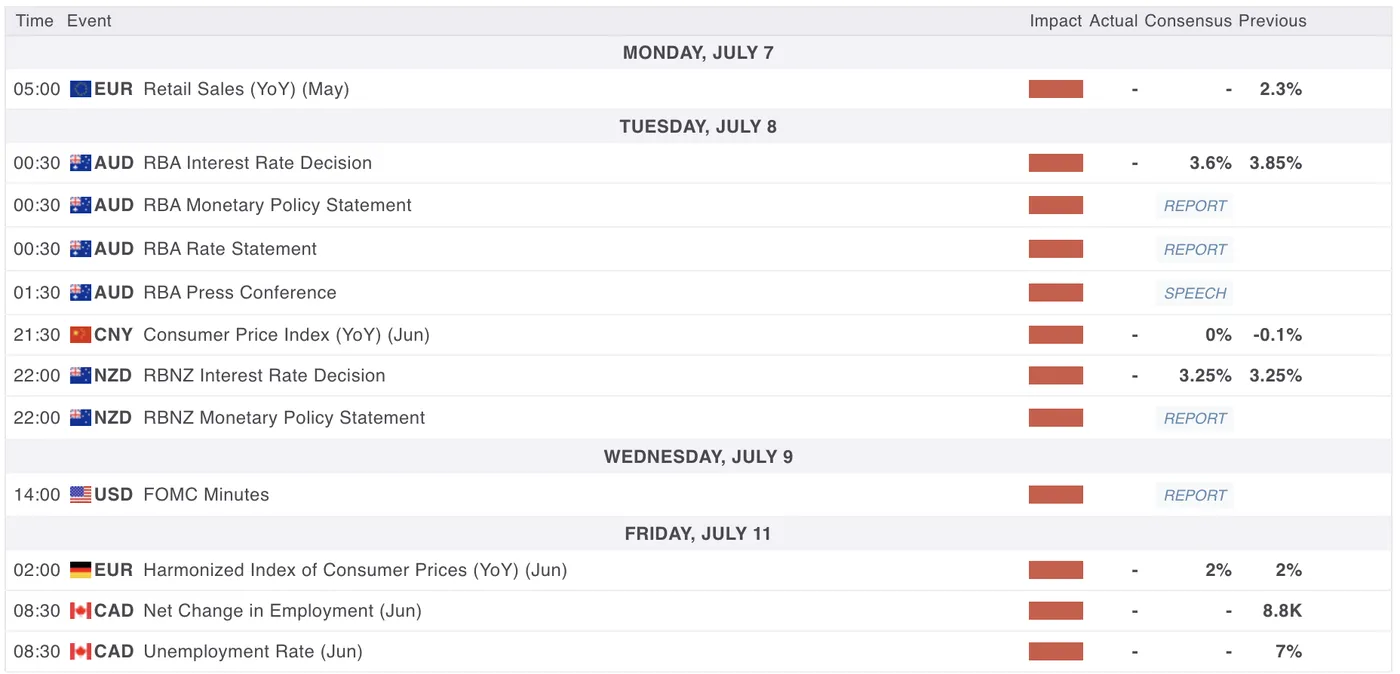
Key Events coming up next week (Hier-Tier Data only) – MarketPulse Economic Calendar
US Dollar performance versus other Forex Major counterparts
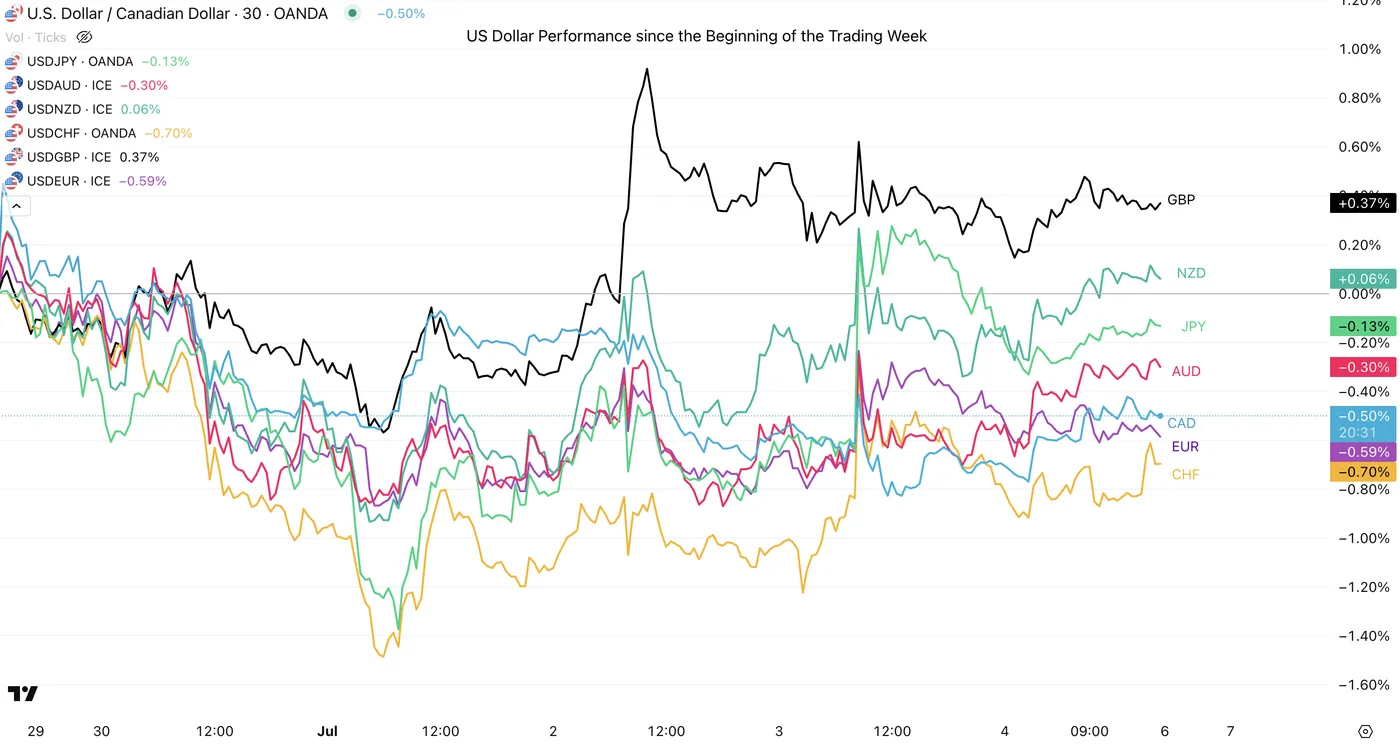
US Dollar Performance since the Beginning of the Trading Week, July 4, 2025 – Source: TradingView
The US Dollar has seen a decent rebound in the latter part of this week but still finishes down against most of its major counterparts – The CAD has however held particularly strong against the USD in the end of the week, something to check in the upcoming week.
CHF and the EUR have also had a consistent decent performance in the beginning of the week particularly but have started to show signs of potential tops – This will depend heavily on an upcoming potential US Dollar rebound, scenario explored in our latest Dollar Index analysis.
Weekly Asset Performance
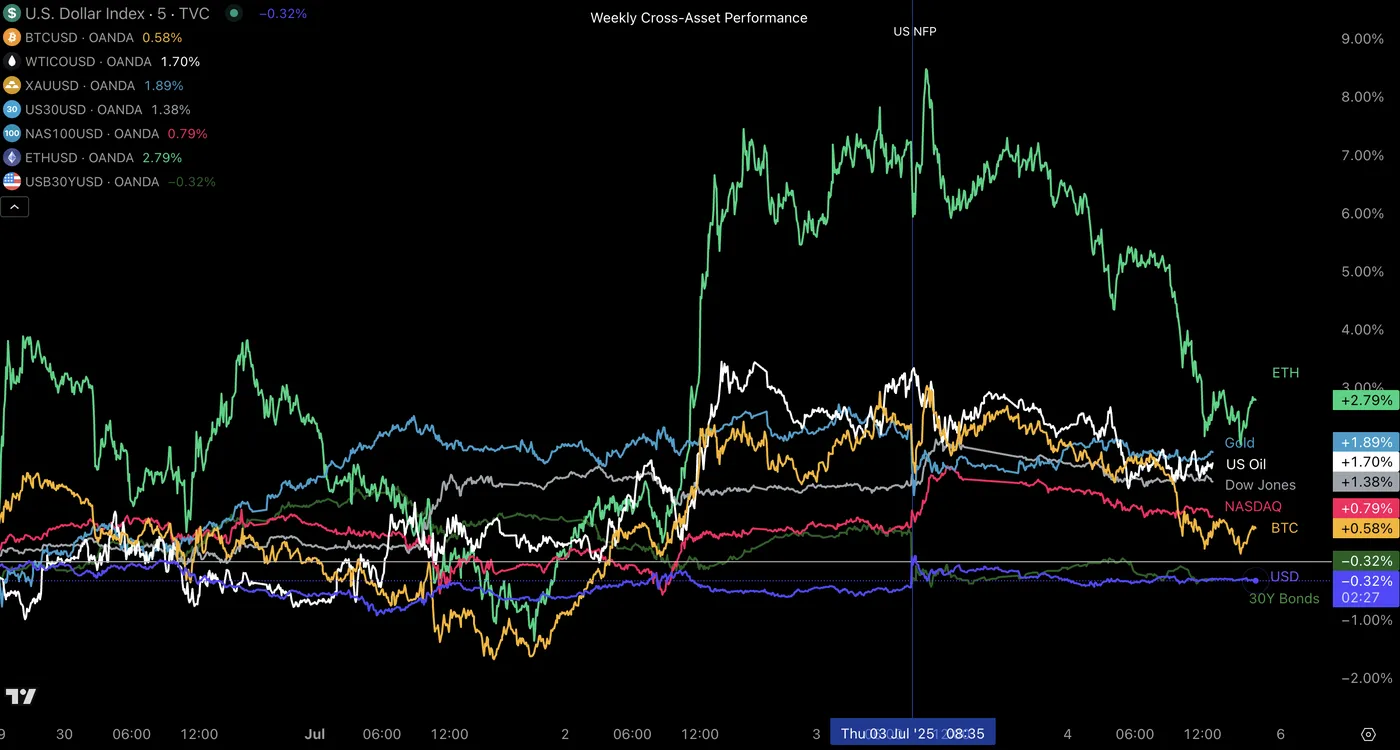
Cross-Asset Weekly Performance, July 4, 2025 – Source: TradingView
Gold has bulls have seen some newfound strength but Ethereum takes the crown for this week's cross asset performance.
The US Dollar and 30Y Bonds have on the other hand been the laggers of the week, again. Let's see if the Dollar regains some ground after the positive NFP report from Thursday.
Safe Trades in the upcoming week!
Week Ahead – RBA, RBNZ Decisions and Fed Minutes Eyed as Trade Deals Awaited
- July 9 tariff deadline looms as trade deals remain elusive.
- Fed minutes to be watched after positive jobs report.
- RBA expected to cut but RBNZ to likely stay on hold.
- OPEC+ to probably raise output again.
- UK GDP, Canadian employment and Chinese CPI data also on tap.
The race to the finish line
It’s been three months since President Trump delayed the start of the punitive reciprocal tariffs, allowing negotiators time to strike more favourable trade deals with America’s main trading partners. However, as the July 9 deadline approaches, the US has only signed two trade deals – with the United Kingdom and Vietnam – while it has agreed a formal trade truce with China that has, at least temporarily, massively lowered the triple digit tariff rates.
However, despite repeated reports that trade talks with India, Japan and South Korea are progressing well, no deal has been reached with any of those countries, and in a surprise turnaround, negotiations with the European Union appear to be going somewhat better. A deal with Canada is also possible in the coming days.
But even if there are several announcements incoming on or before July 9, it’s looking increasingly likely that the White House’s aim of completing deals with all 18 of America’s biggest trading partners won’t be possible by that deadline. This then raises the question of whether Trump will extend the deadline with those countries that no agreement has been reached yet, or will he re-impose the reciprocal tariffs.
The most likely outcome is that Trump will make some threats to slap levies that are much higher than the ones announced on ‘Liberation Day’ to squeeze enough concessions from those countries that the US is still negotiating with before granting a further extension.
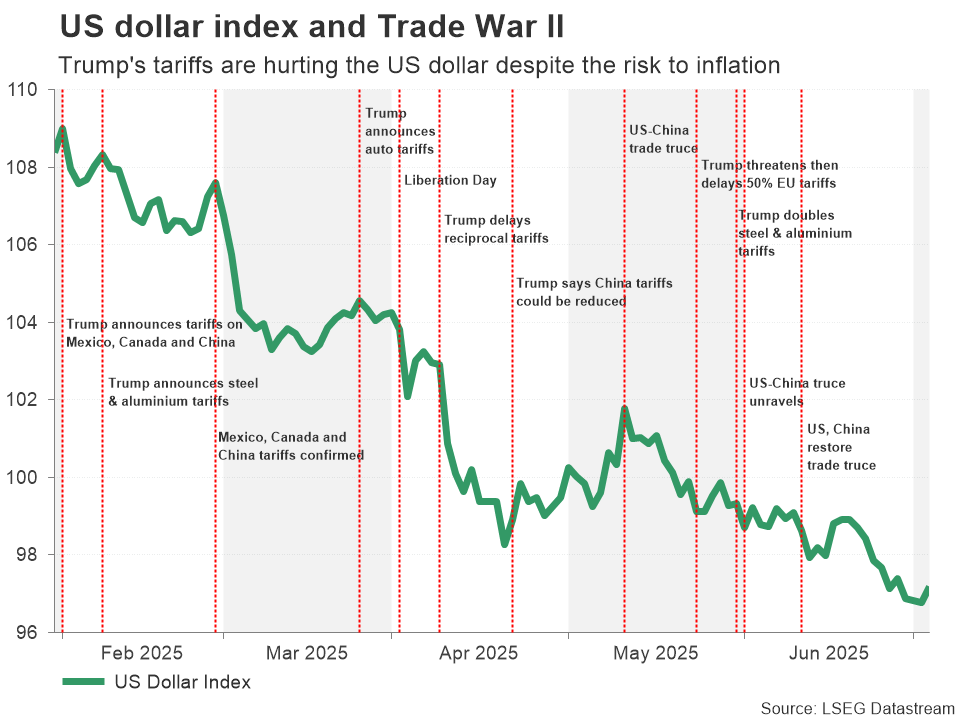
As for the market reaction, that will probably depend on how many deals are signed over the coming week. If there are agreements with just a handful of countries and they don’t include any of the major ones such as Japan, India and the EU, then only a cautious sense of optimism is to be expected, which would modestly boost risk assets but may not necessarily do much in lifting the US dollar.
Fed minutes to dominate in quiet data week
Investors will also be preoccupied with how soon the Fed will cut rates again. Hopes of a July cut were dashed following the stronger-than-expected nonfarm payrolls report for June. But if the data continues to surprise to the upside, the odds of a September move may also start to dwindle.
But any update on the economy will have to wait for mid-July as there aren’t any major releases on the agenda next week and traders will be getting their cues from Wednesday’s minutes of the Fed’s June policy meeting and the limited Fedspeak that’s on the schedule.
After the dollar staged a much-needed recovery in the past few days, a hawkish tone from the FOMC minutes could help it extend its rebound.
RBA set to cut for third time
The Reserve Bank of Australia has lagged other central banks in lowering rates, mainly due to inflation in Australia being more persistent. But it now appears to be well and truly on an easing path, and it is widely expected to trim its cash rate by a further 25 basis points on Tuesday when it meets.
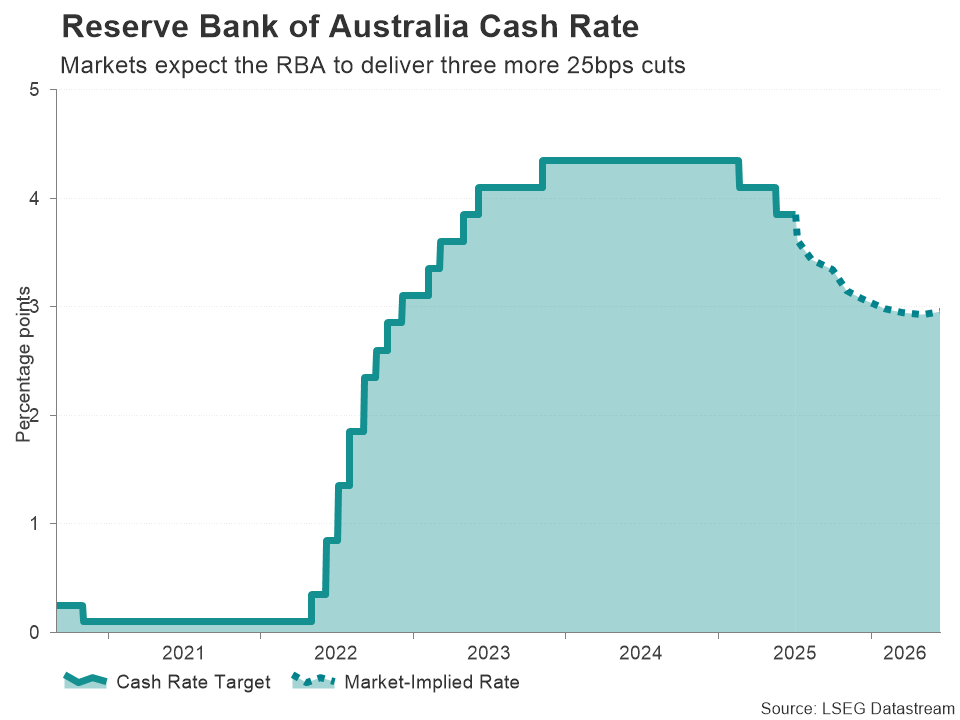
Investors have priced in two more cuts of similar size after the July meeting so the focus will be on whether or not Governor Michele Bullock will signal a rate path that is steeper or shallower than that implied by the markets. In the absence of explicit clues, investors will be watching how worried Bullock will sound about the impact of the trade war on the economy.
But with the Australian dollar having just recorded its fourth straight month of gains versus the US dollar, a dovish set of remarks risks sparking a near-term correction in the pair.
RBNZ expected to go on pause
Across the Tasman Sea, the Reserve Bank of New Zealand will also be setting policy 24 hours after its Aussie counterpart. Unlike the RBA, the RBNZ has been quite aggressive in slashing rates, lowering the cash rate six times by a cumulative 225 basis points since last August.
Recent data have been mixed: the unemployment rate is stuck at the cycle peak of 5.1%, but GDP posted a solid rebound in the first quarter, while inflation edged up to 2.5%.
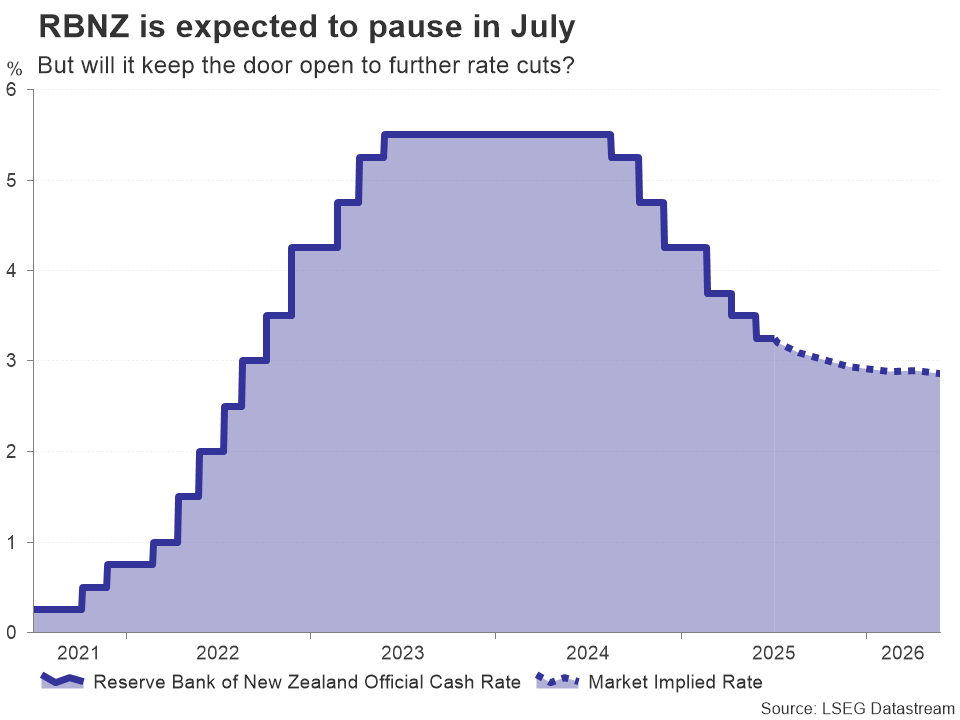
Investors think there’s about an 80% probability that the RBNZ will keep the cash rate on hold at 3.25% on Wednesday but foresee one final 25-bps cut by year-end. If the Bank signals that it’s done with rate cuts, the New Zealand dollar could appreciate against the greenback. But should it keep the door wide open, the kiwi could slip slightly.
OPEC+ could opt for a larger output hike
Amid the ongoing trade uncertainty and recent geopolitical flare-up, one relief for central banks has been the speed at which oil prices tumbled back down after Israel and Iran agreed a ceasefire, lowering the risks to inflation. Moreover, there’s strong indications that OPEC and its non-OPEC allies are not deterred by this pullback and will push for another monthly output hike when they meet on July 5.
The OPEC+ alliance has shifted its stance from supporting high oil prices to defending its market share during 2025. The problem isn’t just other producers such as the US gaining a bigger market share but also member countries like Kazakhstan overproducing and refusing to abide by their supply quotas.
If there is a surprise from the OPEC+ meeting over the weekend, it’s more likely to be an output increase that’s greater than the 411,000 barrels per day that was agreed for May, June and July.
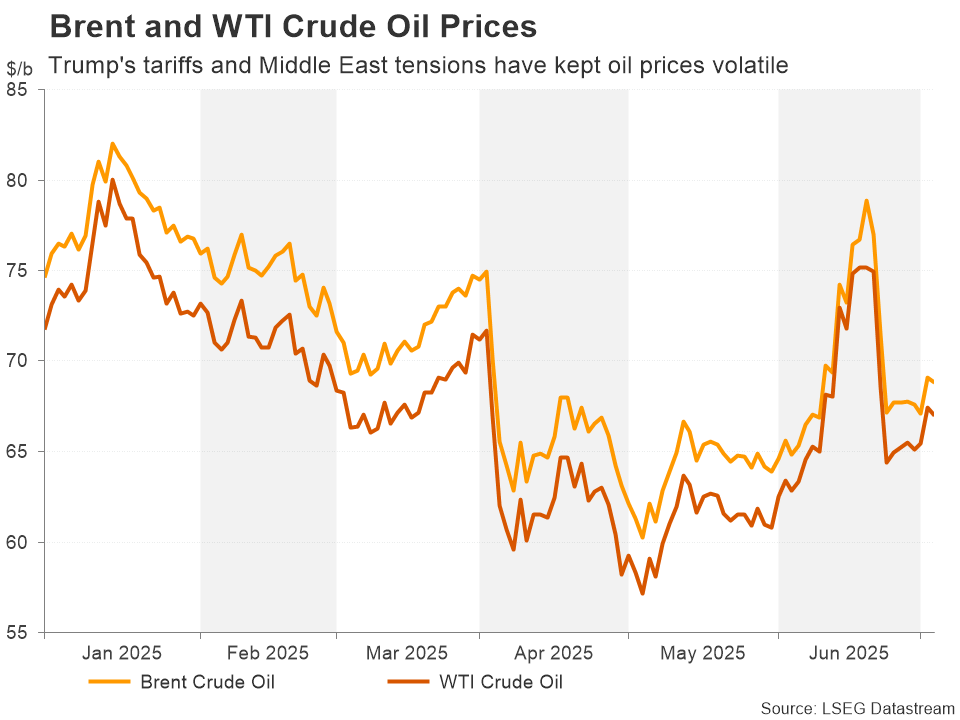
Should that turn out to be the case, there’s a good chance oil futures will start the week in the red.
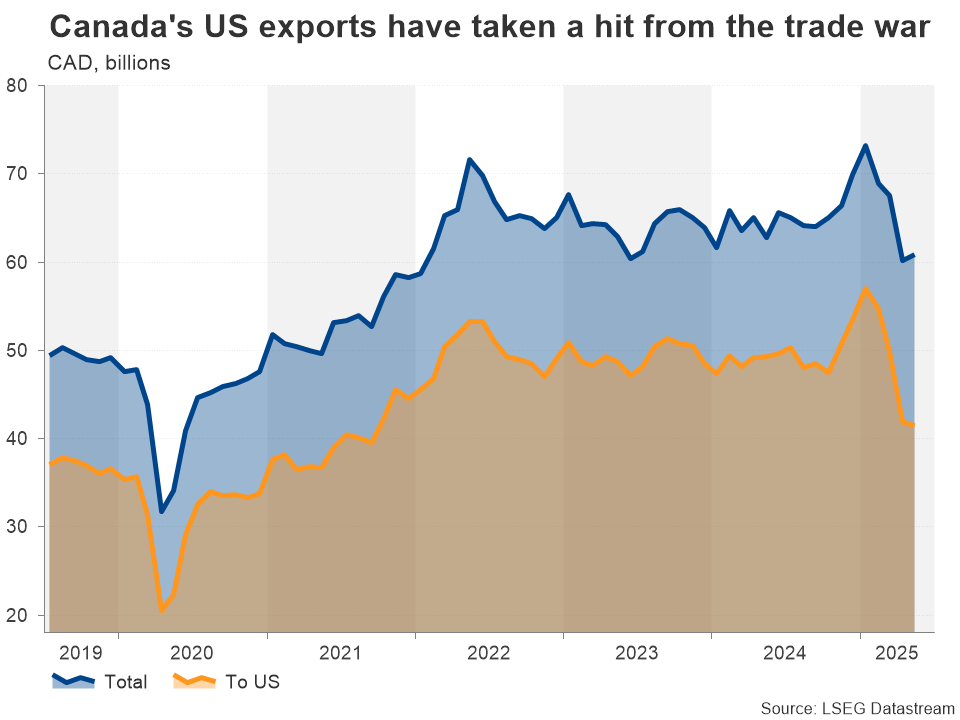
Canadian jobs depressed by trade war with US
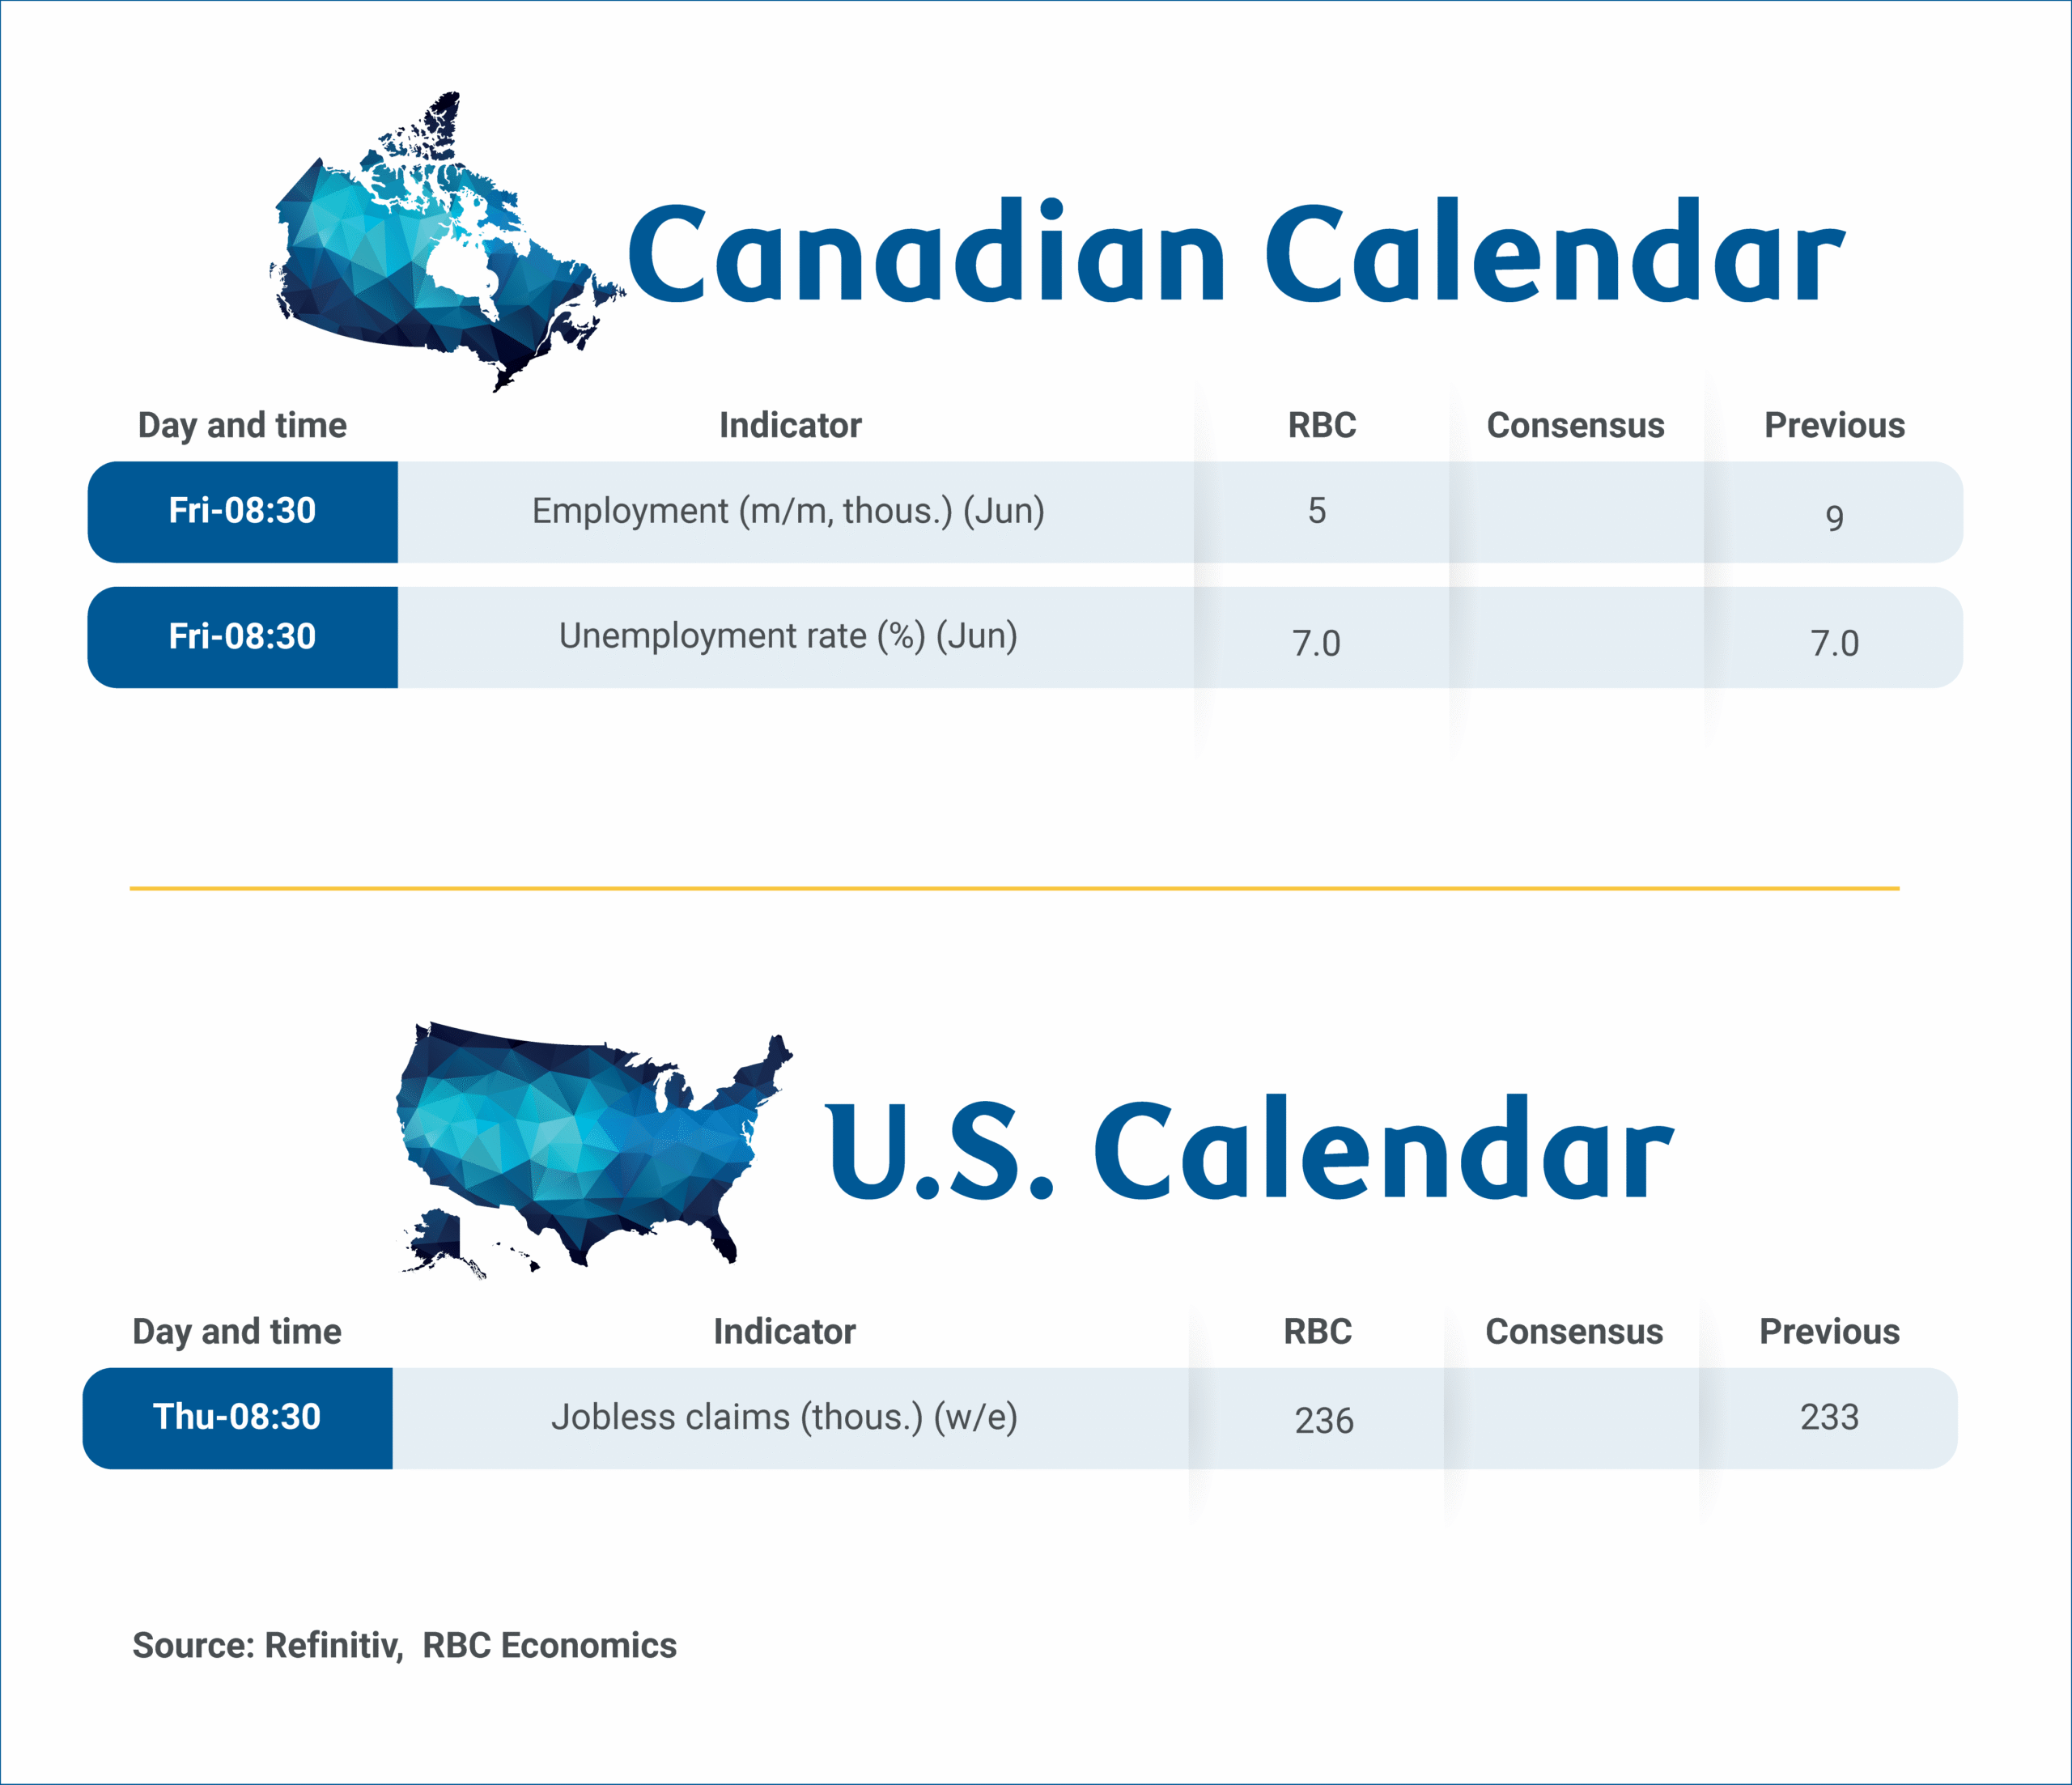
Elsewhere, investors will be keeping an eye on some major economic releases due in Canada, China, Japan and the United Kingdom. Starting with the Canada where the June employment report is out on Friday, another lackluster print could see the odds of a rate cut later this month rising from the current 25%.
the odds of a rate cut later this month rising from the current 25%.
There was some good news for the Bank of Canada when two of three core inflation readings eased in May. So, unless there was some kind of a rebound in the jobs market in June, the BoC could well cut interest rates again at its July meeting, or strongly signal one later in the year, especially if there’s still no permanent trade deal in place with Washington.
The loonie, however, is more likely to be driven by the strength or weakness of the US dollar.
Key data from China, Japan and UK
In China, CPI and PPI numbers are due on Wednesday. Both consumer and producer price inflation have been negative since February. If this trend remains unchanged in June, worries about a worsening deflation picture in China could weigh on market sentiment.
One country that is definitely glad to be out of deflation is Japan, where inflation has been strong enough for the Bank of Japan to finally exit negative interest rates. With the energy shock now fully faded, the BoJ is focusing primarily on sustained wage growth for guiding it on when to resume its policy tightening.
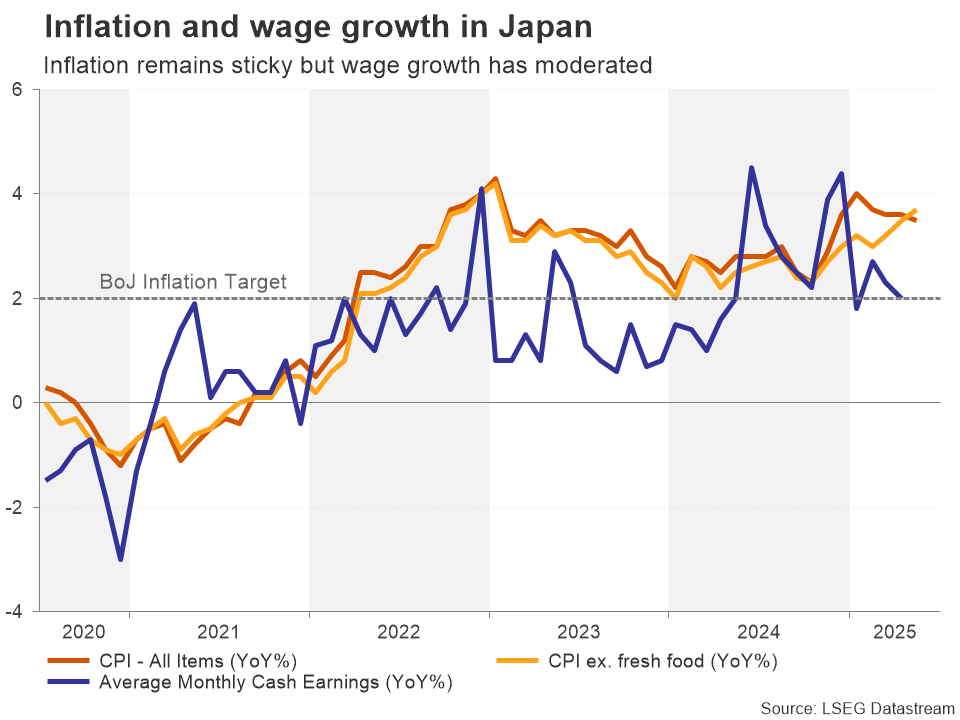
Wage growth figures for May are out on Monday and corporate good prices for June will follow on Thursday. The Japanese yen could strengthen slightly if wage growth comes in hotter than expected.
Finally in the UK, the focus is again on the government’s mismanagement of public finances, which triggered a spike in gilt yields during the past week, pushing the pound lower. Next Friday’s monthly GDP readings could help sterling regain its positive footing, as stronger growth tends to boost government revenue and would lessen the pressure for spending cuts or tax increases.
Research US – July 9 unlikely to turn into a ‘Liberation Day 2.0’
We expect possible tariff increases on July 9 to remain smaller in scale compared to the salvo announced on April 1st 'Liberation Day'.
US could strike preliminary deals with trading partners to buy time for more thorough negotiations. Treasury Secretary Bessent has appeared ready to postpone the deadline towards fall for countries negotiating in 'good faith'.
Legality of country-specific 'reciprocal tariffs' and the unclear outlook for new sectoral tariffs complicate the negotiations. Stricter stance on limiting re-routing of trade could mean higher tariffs for especially SEA countries, and cause tariffs to bite harder on the American consumer.
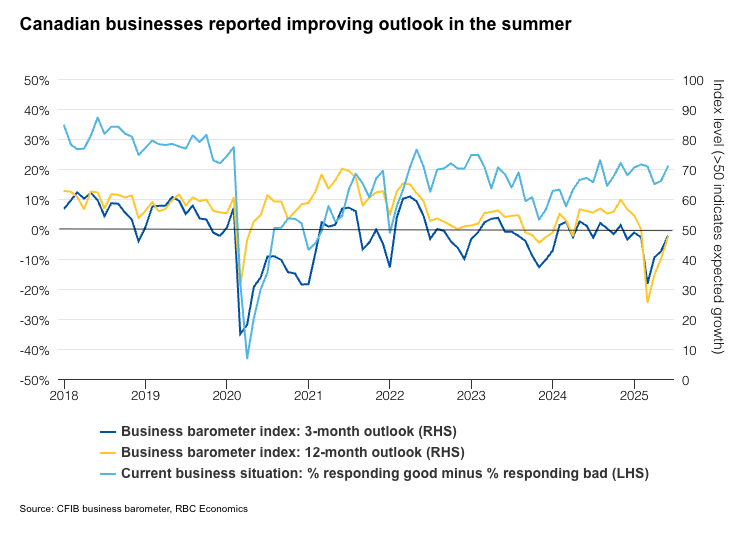
Softening Canadian Labour Market May Be Reaching a Bottom.
The Canadian labour market has weakened significantly since the beginning of the year with the unemployment rate hitting 7% in May—but it may be reaching a bottom soon.
Slowing has been significant, but is concentrated in sectors and regions most exposed to international trade headwinds. Manufacturing lost 55,000 jobs since January and the unemployment rate in parts of Southern Ontario that are manufacturing hubs are well above the national average—reaching highs not seen since the 2020 pandemic lockdowns.
But with domestic demand broadly holding up, we don’t expect the weakness to spread. In fact, solid consumer spending trends into the summer is supporting job growth in domestic service sectors, leaving headline employment growth mostly positive this year.
In June, we expect a similar dynamic will play out. Potential losses in trade exposed sectors like manufacturing, wholesale and transportation would be offset by job growth in other sectors to leave overall employment and the unemployment rate largely unchanged from May.
The threat of further global tariffs remains, including the expiry of the 90-day pause on the most severe U.S. reciprocal tariffs announced in April in the week ahead. But the most severely negative global trade scenarios still look less likely than they did a few months ago.
Crucially, we expect CUSMA exemptions to stay in place. The latest trade statistics continue to reaffirm that, for now, Canada is relatively well positioned among U.S. trade partners to compete for its import market. The majority of Canadian goods exports were crossing the border duty free in May, thanks to those exemptions.
Trade talks between the U.S. and partners are ongoing, and tensions will continue to restrain hiring. But, business confidence measures have improved from April to June and job openings posted on indeed.com have stabilized significantly since mid-April after falling earlier this year.
Barring more significant negative developments on trade, we expect the bottom is near for the Canadian labour market with the unemployment rate peaking not far from where it is today.
S&P 500, Dow Jones Q3 Outlook: Tariffs, Tech, and Small Cap Concerns
Markets remain very much in limbo when it comes to US tariffs and trade negotiations. However, looking at risk assets and US equities in particular, one would none the wiser as to the bevy of risks that lie ahead.
Let us take a look at what we can expect from Q3.
S&P 500 Prints Fresh All-Time Highs, Can the Rally Continue?
The S&P 500 finished Q2 with a flourish as optimism has continued to grow that trade deals will be reached between the US and a host of trading partners. The S&P rallied to print fresh all-time highs in the last week of June with US Treasury Secretary Scott Bessent recently remarking that about 100 countries will get a minimum 10% reciprocal tariff.
On July 9th, President Trump's 90-day tariff pause will officially expire.
The surprise for many in regard to the US stock market comes from the fact that foreign investors appear to be diversifying out of US stocks in 2025. Investors from overseas withdrew $5 billion from US equity ETFs over the last month, the largest outflow in at least 3 years.
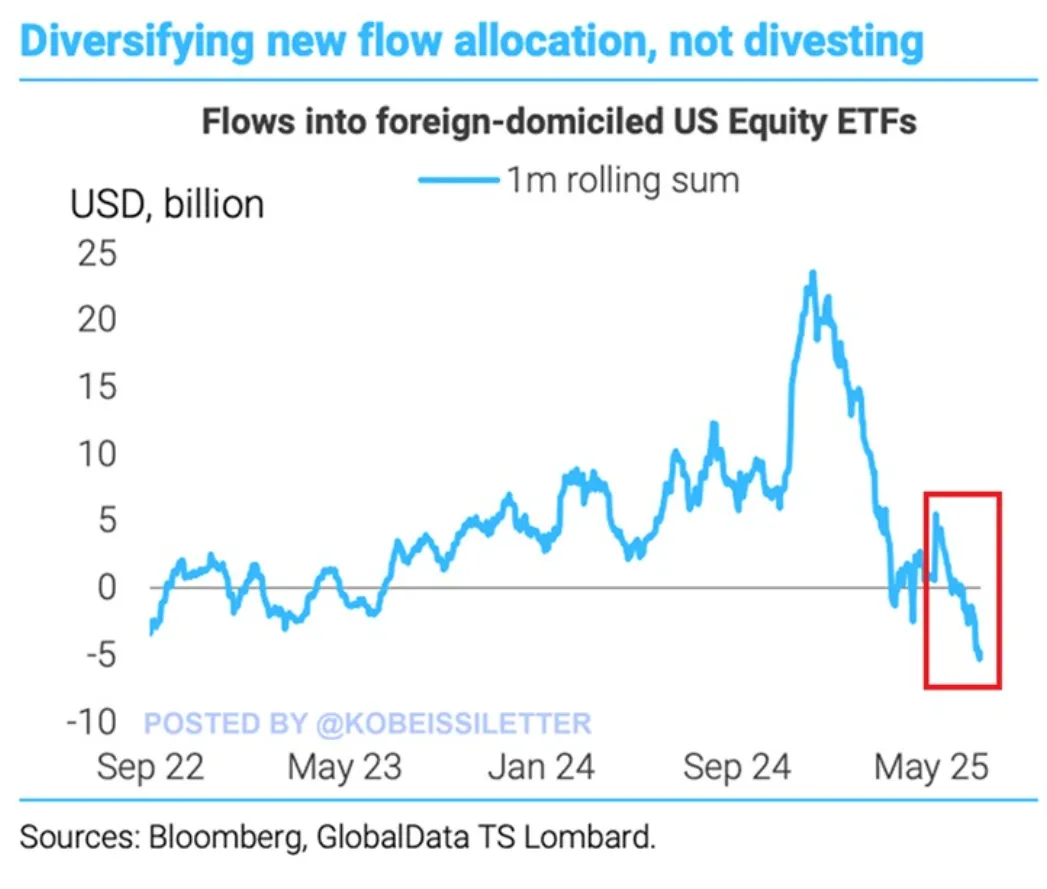
Source: Bloomberg, Kobeissi Letter
This is all despite the S&P 500 rallying +5% over the last month and hitting an all-time high for the first time since February.
However, I always believe it is important to put things into perspective. Despite the recent outflows, foreign investors poured in a whopping $24 billion into US stock ETFs in November 2024. The month of May also saw $5 billion in net purchases of US stocks.
So are foreign investors really pulling away from US stocks? If they are, US stocks are certainly not showing it with large cap stocks in particular doing well.
The issue with US stocks comes from the difference in performance between megacap and small cap stocks, as well as the growing discrepancy between the ‘mag 7’ and its weighting when it comes to the Nasdaq 100 and S&P 500.
The top 10 tech stocks reached a record market value of $20.5 trillion in June. Just 3 stocks, Nvidia, $NVDA, Microsoft, $MSFT, and Apple, $AAPL, reflect half of that total.
This also marks a $3 trillion market cap recovery since April’s low. Collectively, the top 10 have gained over $12 TRILLION in value over the last 3 years. Since 2012, these stocks' market cap has grown at an average annual rate of 23.4%.
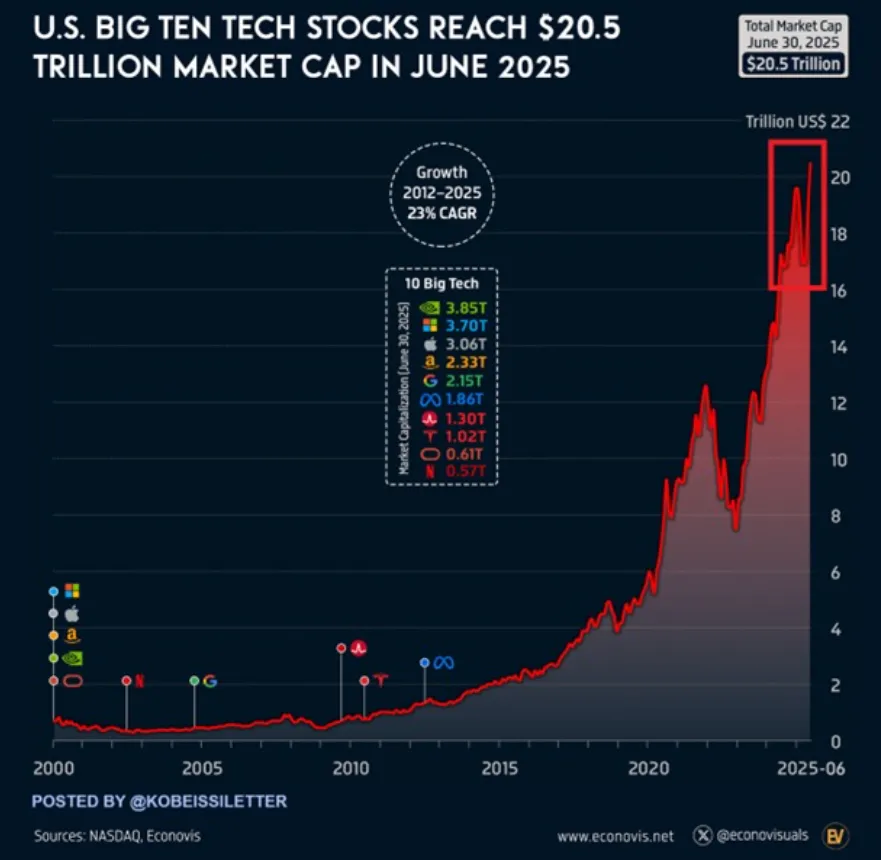
Source: Nasdaq, Kobeissi Letter
The best gauge of this for 2025 comes from a comparison in performance between the Russell 200 Index, S&P 500 and Nasdaq 100. The Russell 2000 index has gone 913 trading days without hitting an all-time high, the longest streak in 14 years.
This also marks the 3rd-longest stretch in history. The index is currently trading 10% below its November 2021 peak.
While the Nasdaq 100 and S&P 500 have reached multiple record highs in 2025, small caps continue to lag. Year-to-date, the Russell 2000 is flat, significantly underperforming the S&P 500 and Nasdaq, which are up 5.9% and 7.8%, respectively.
Meanwhile, 46% of companies in the index are currently unprofitable, near the highest share on record.
This has not fazed markets in recent years as Tech shares dominance continues to grow and this trend is thus far continuing.
Risks to Watch for in Q3
Tariffs remain a key component for Q3 2025, with President Trump's tariff pause coming to an end on July 9, 2025. There has been constant comments that trade deals are on the horizon, however any setback and challenges could have repercussions to overall market sentiment and thus weigh on equities.
However, until a deal or no deal is actually announced any such moves may prove to be short-lived as we have seen so far in 2025.
Earnings season is on the horizon once more and poor performances or significant downgrades to companies' outlooks could weigh on US equities. July is set to be a big one with 6 of the ‘Mag 7’ stocks reporting during the months with Tesla kicking things off on July 17.
Other Dates for the ‘Mag 7’ stocks earnings releases:
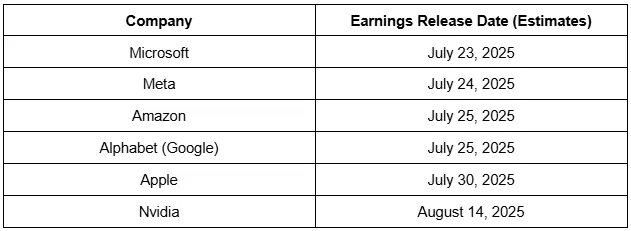
Source: TradingView Earnings Calendar, Table Created by Zain Vawda
S&P 500 Technical Outlook
Looking at the S&P 500 from a technical lens, there is no historical price action to analyze as price hovers near all-time highs.
With that in mind, I thought it may be prudent to look at seasonality and other indicators that may provide some valuable insights.
The S&P posted a fresh all-time high last week which coincided with a golden cross pattern completion on June 27, as the 50-day MA crossed above the 200-day MA. Now, this is a bullish sign but there is some interesting data I came across which I thought is worth taking a look at.
Since 1950, the S&P 500's golden cross has been a reliable bullish signal, generating median returns of 13% over the following year, with positive returns about 80% of the time.
The chart below shows that three months after a golden cross pattern, the S&P 500 goes up 75.7% of the time, with an average return of about 4%. Over a 12 month period, the average return is around 11.2%.
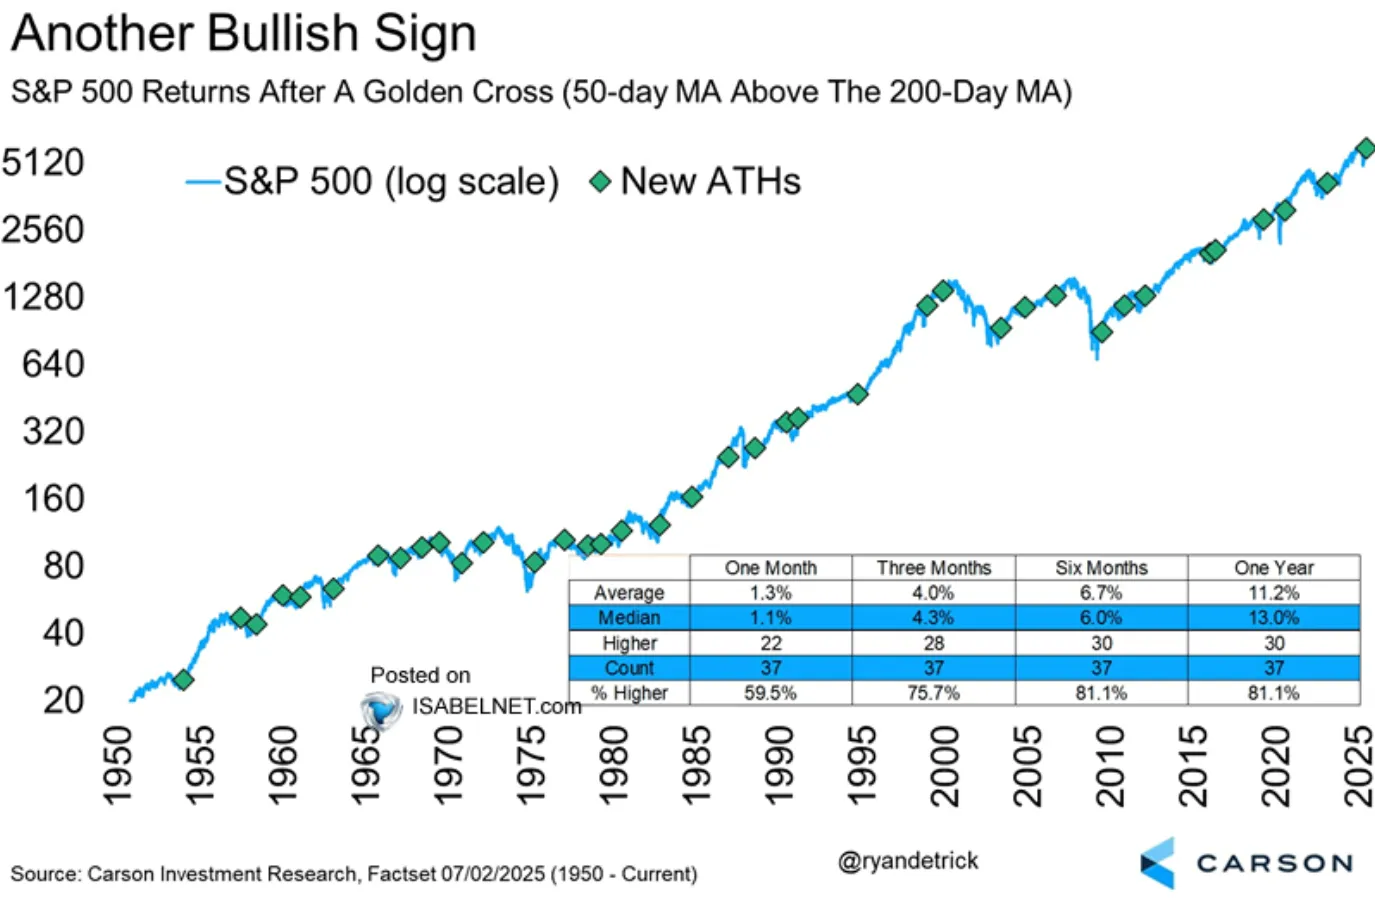
Source: Carson Investment Research, Isabelnet
This does bode well for bulls but it is just data at the end of the day and no guarantee that this will occur once more. It is something to bear in mind and could prove useful when combined with technical and fundamental outlooks.
Key levels to keep an eye on:
Support
- 6067
- 6000
- 5851
Resistance
- 6282
- 6500
- 6750
Dow Jones Technical Outlook
The Dow Jones technical picture is slightly different with the index having tested its all-time highs from January, around the 45226 mark.
Similar to the S&P 500, there is no historical price action beyond this level to analyze. Thus I will be focused on psychological levels such as 45500, 46000 and 46500.
Looking at the downside though and there are some key levels to keep an eye on.
For now, bulls are firmly in control on the weekly chart below with a weekly candle close below the 42000 handle needed to invalidate the bullish momentum. Such a candle close leads to a change in structure and thus could lead to further downside.
Key support levels to keep an eye on rest at 42750, 42000 and the psychological 40000 handle.
Dow Jones Weekly Chart, July 4, 2025
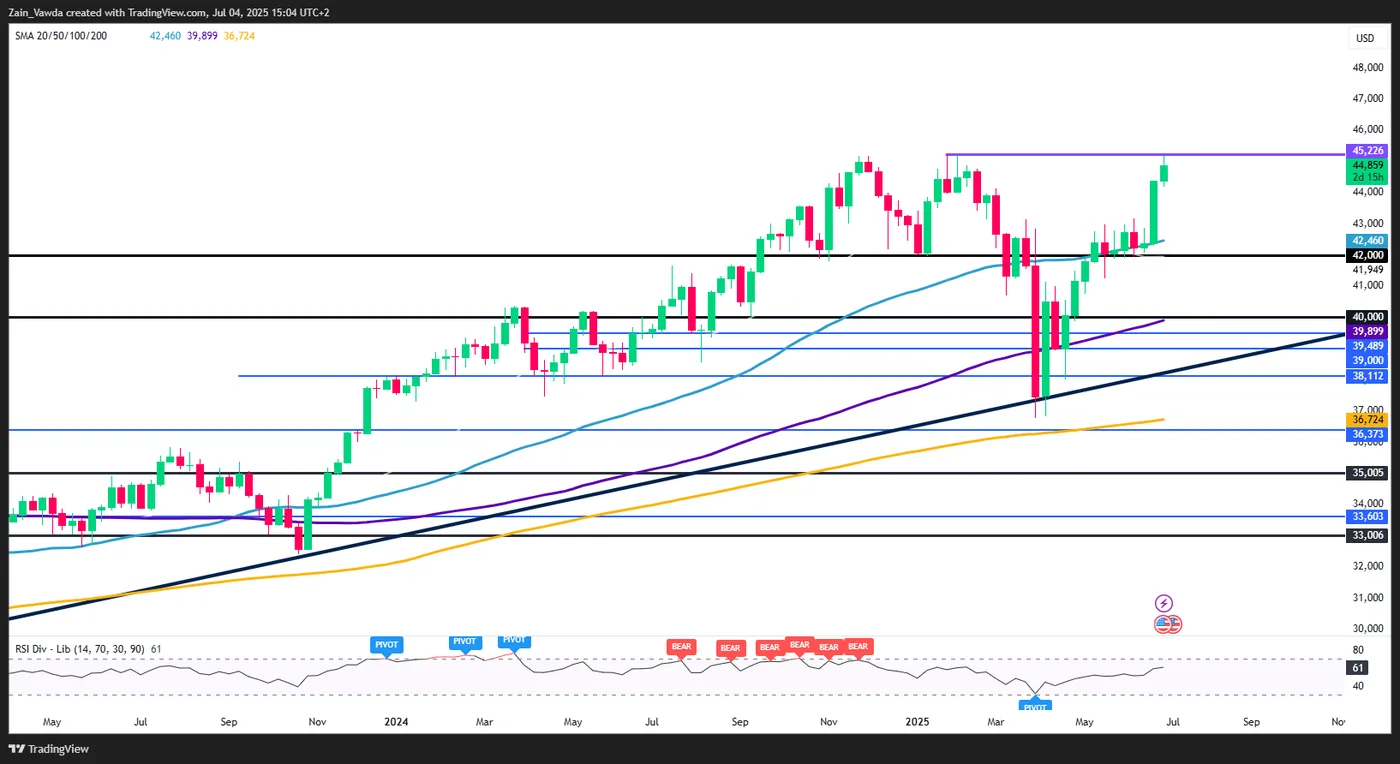
Source: TradingView
Final Thoughts
The outlook for equities remains filled with optimism, at least that is what is being reflected in the price and recovery we have seen in Q2. Moving forward further gains remain possible especially if geopolitical risk subsides and the tariff saga finally reaches a conclusion.
Sunset Market Commentary
Markets
US president Trump upped the ante ahead of a potentially important weekend. Trade talks take center stage and will continue to do so next week now Trump’s BBB made it through Congress. The deadline for the temporarily reduced import levies (to the 10% baseline) lapses July 9th but so far only the UK and Vietnam secured (the contours of a) trade deal. Trump started to send out letters dictating the applicable tariffs to the trade partners that haven’t from today on. According to the man himself, these vary between 10% and 70% with the upper end even being above the highest level announced on Liberation Day (50%). It’s against this backdrop and lacking inspiration from the economic calendar or from US investors (busy celebrating Independence Day) that markets are taking some chips off the table going into the weekend. European stock markets slid a little over 1% and European rates ease a couple of basis points. Bunds marginally outperform vs swap with net daily changes varying between -0.4 bps (30-yr) and -3 bps (2-yr). ECB’s Villeroy supported the bull steepening move with another series dovish comments. While sticking to the official guidance (“ECB is in a good position on rates”) he sees risks for an inflation undershoot increasing, particularly due to the recent euro appreciation. ECB’s Nagel ahead of the European open called for calm: the ECB mustn’t get nervous if prices would temporarily drop below 2%. He’s probably eying the more stubborn above-2% inflation measures including core and services CPI. Euro area money markets in any case aren’t expecting anything from the ECB at the July 24 meeting and rightly so. A full rate cut isn’t priced in before the end-of-year meeting in December. We’re not at all convinced. A trade deal between the US and the EU could for example quickly make those bets outdated. UK gilt yields ease around 1 bp across the curve. They slid up to 8 bps at the long end of the curve after a concerted effort by prime minister Starmer and Chancellor Reeves. They tried to calm a market concerned about Reeves’ exit and potential fiscal slippage. The former explicitly supported Reeves in her position as finance minister after failing to do so in Wednesday’s parliamentary session, leading to a 20 bps yield surge. The latter reaffirmed her commitment to the current set of fiscal rules.
FX markets are as you could have expected: dull. The dollar fails to build on yesterday’s gains, which were already limited to begin with. EUR/USD even appreciates marginally into the 1.177 area. DXY stabilizes around 97. The Japanese yen outperforms on haven flows. USD/JPY returns from 145 back to 144.4. EUR/JPY, after moving beyond the recent highs yesterday to top 170 for the first time since last year is now testing that big figure again. Sterling’s relief rally yesterday is already over. EUR/GBP bounces back to the 0.8630 area. From a technical perspective the pair faces little resistance ahead of the April high at 0.8738.
News & Views
Preliminary Czech inflation numbers for June showed inflation slowing less than expected, from 0.5% M/M to 0.3% M/M (vs 0.2% expected). Annual inflation accelerated from 2.4% Y/Y to 2.9% Y/Y, matching its second highest level since end 2023. Details showed sticky services inflation at 0.5% M/M and 5% Y/Y (from 4.9%) with goods price inflation rising by 0.1% M/M and 1.6% Y/Y (from 0.9%). Energy prices fell by 5% Y/Y (from -6.2% Y/Y) while food prices rose by 5.5% Y/Y (from 5%). Final data will be published by the Czech Statistical Office on 10 July 2025 when the CNB also shares its view on inflation numbers. Minutes of the previous meeting showed central bankers naming core inflation as a key risk given sticky services prices. CNB governor Michl yesterday reiterated that Czech rates are likely to be stable for some time while leaving all options nevertheless open. EUR/CZK initially extended its Q2 decline towards a new YtD low at 24.60.
Hungarian industrial production fell by 1.3% M/M in May, leaving output 2.6% lower compared than a year earlier. YtD, production was 4.1% lower compared to first five months of 2024. Details showed production volume decreasing in most manufacturing subcategories, like the manufacturing of electrical equipment and of food products (weakness in external demand for electric vehicles, beverages and tobacco products). EUR/HUF holds just below the 400 level with key support (YtD low) lingering around at 397.
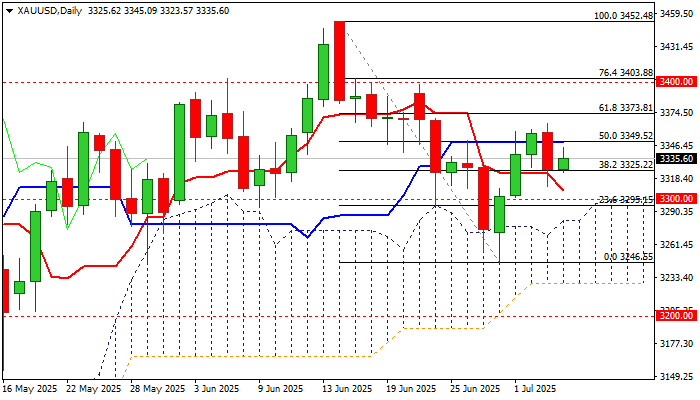
GOLD – Bullish Bias Above $3325, US Fiscal Uncertainty Underpins
Gold was firmer on Friday morning and recovered a part of post-NFP losses.
The metal is on track for a weekly gain after being in red for two consecutive weeks that adds to positive signals, as the price remains at the upper side of larger consolidation range ($3500/$3120).
Negative impact from upbeat US labor data was short-lived, with growing fiscal concerns after the US Congress passed President Trump’s tax-cut and spending bill (which will add $3.4 trillion to a massive US debt) expected add pressure on dollar and underpin safe-haven demand.
Technical picture on daily chart is still mixed as near-term action remains supported by thickening daily Ichimoku cloud, but positive signal being countered by 14-d momentum still in negative territory and overbought stochastic.
Near-term bias is expected to remain with bulls while the price holds above $3325 (broken Fibo 38.2% of $3452/$3246) though sustained break above cracked $3350 barrier (50% retracement / daily Kijun-sen) and $3365 (Thursday’s high) required to strengthen near-term structure and shift focus on targets at $3373 (Fibo 61.8%) and $3400 (psychological).
However, Friday’s action is likely to be less dynamic due to lower volumes, as US markets will be shut for Independence Day.
Res: 3345; 3350; 3365; 3373
Sup: 3325; 3311; 3308; 3300
British Pound Retreats After Recent Rally
The GBP/USD pair is undergoing a correction, moving towards 1.1627 on Friday, marking its lowest level since 23 June this year.
Strong US jobs data puts pressure on the pound
The pound came under renewed pressure after the release of a strong US employment report, which boosted demand for the US dollar.
Earlier in the session, the pound received support from Prime Minister Keir Starmer’s announcement confirming that Chancellor Rachel Reeves would remain in office for the foreseeable future. This eased fears of changes to economic policy and reduced concerns about increased fiscal stimulus through further borrowing.
The market continues to factor in expectations of monetary policy easing, with the possibility of a Bank of England rate cut as early as August.
BoE Governor Andrew Bailey stated it was too early to assess the inflationary impact of trade tariffs but confirmed that interest rates are moving downwards. Meanwhile, MPC member Alan Taylor called for faster rate cuts, warning of the risk of a hard landing for the UK economy.
Technical analysis of GBP/USD
On the H4 chart, GBP/USD completed a decline to 1.3562, followed by a growth link to 1.3675. Today, another downward move to 1.3528 is possible, followed by growth back to 1.3675. The market is likely to continue forming a broad consolidation range around 1.3675. A breakout upwards would open the way for the trend to continue towards 1.4000, while a breakdown below would signal continuation of the downward wave to 1.3485. The MACD indicator confirms this scenario, with its signal line below zero and pointing firmly downwards, indicating that the bearish momentum remains.
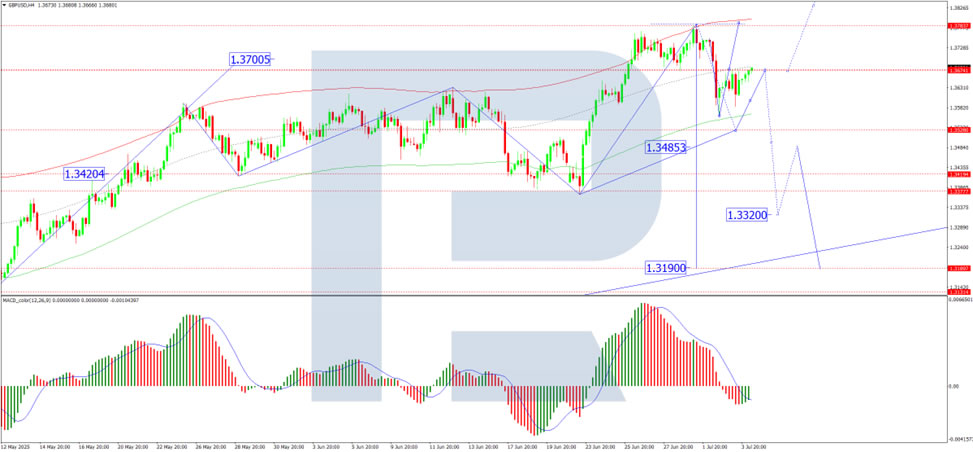
On the H1 chart, GBP/USD completed a correction to 1.3565 and a growth wave to 1.3675, marking the boundaries of the consolidation range around this level. An upward breakout would suggest a move to 1.3788, while a downward breakout would open potential for a decline to 1.3485. The Stochastic oscillator confirms this setup, with its signal line below 80 and pointing sharply downwards towards 20, indicating building downward pressure.
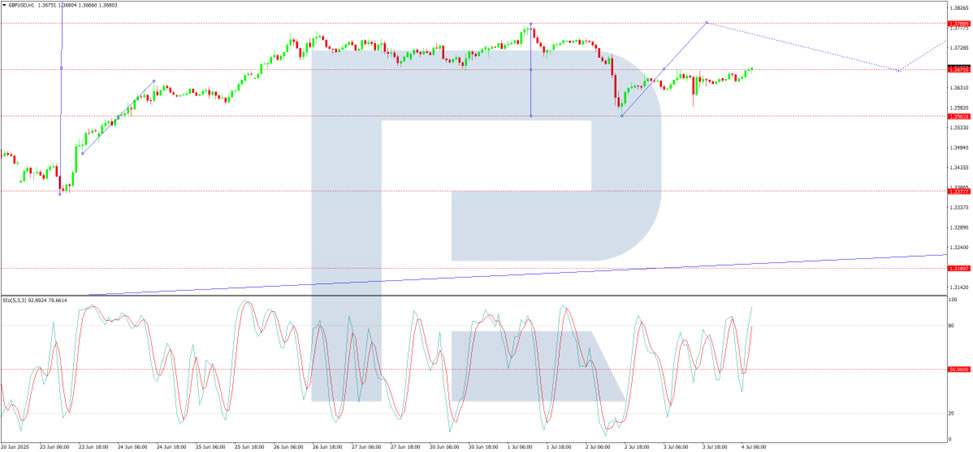
Conclusion
GBP/USD is correcting after its recent rally, with near-term support at 1.3528-1.3485 and resistance at 1.3675-1.3788. Market sentiment remains driven by the strength of the US dollar, BoE policy expectations, and evolving UK fiscal outlooks, with technical indicators pointing to potential further downside in the short term.