

Sample Category Title
Aussie Trading Lower In The Asian Session
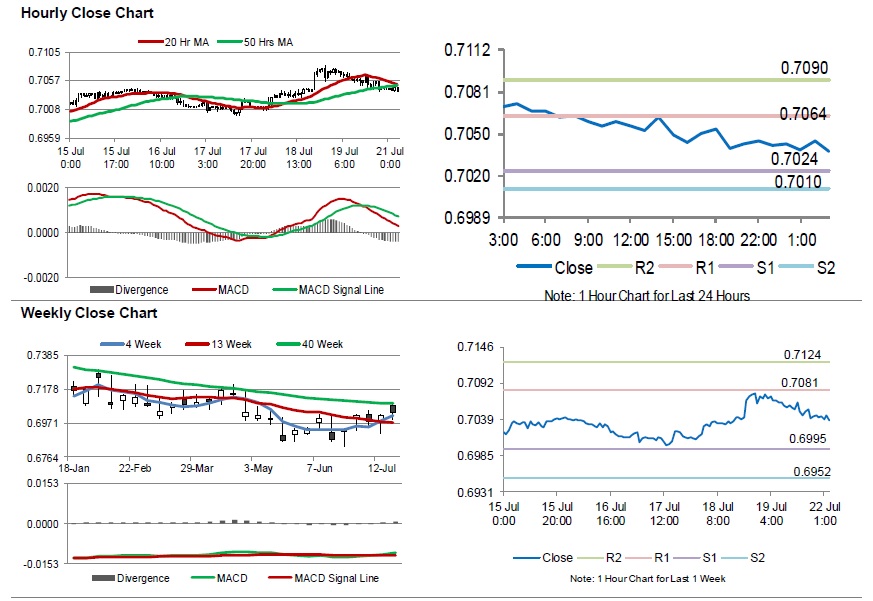
For the 24 hours to 23:00 GMT, the AUD declined 0.27% against the USD and closed at 0.7043 on Friday.
LME Copper prices rose 2.0% or $118.0/MT to $6066.0/MT. Aluminium prices rose 0.3% or $5.5/MT to $1833.0/MT.
In the Asian session, at GMT0300, the pair is trading at 0.7037, with the AUD trading 0.09% lower against the USD from Friday’s close.
The pair is expected to find support at 0.7024, and a fall through could take it to the next support level of 0.7010. The pair is expected to find its first resistance at 0.7064, and a rise through could take it to the next resistance level of 0.7090.
With no macroeconomic releases in Australia today, investors would look forward to global macroeconomic releases for further direction.
The currency pair is trading above its 20 Hr and 50 Hr moving averages.
Gold: Yellow Metal Reverses Its Losses In The Morning Session
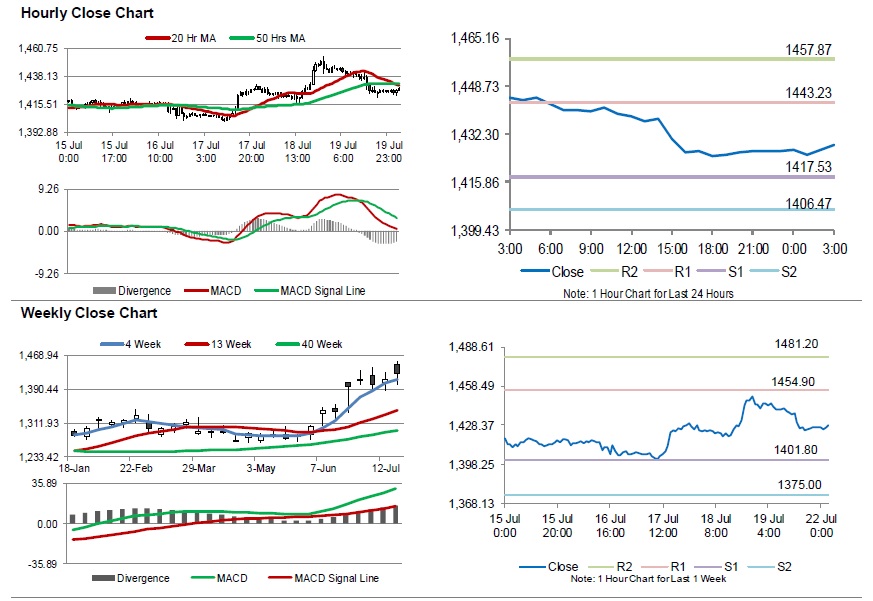
For the 24 hours to 23:00 GMT, Gold declined 1.33% against the USD and closed at USD1425.20 per ounce on Friday, amid strength in the US dollar.
In the Asian session, at GMT0300, the pair is trading at 1428.60, with gold trading 0.24% higher against the USD from Friday’s close.
The pair is expected to find support at 1417.53, and a fall through could take it to the next support level of 1406.47. The pair is expected to find its first resistance at 1443.23, and a rise through could take it to the next resistance level of 1457.87.
The yellow metal is trading below its 20 Hr and 50 Hr moving averages.
Silver: White Metal Trading On A Stronger Footing This Morning
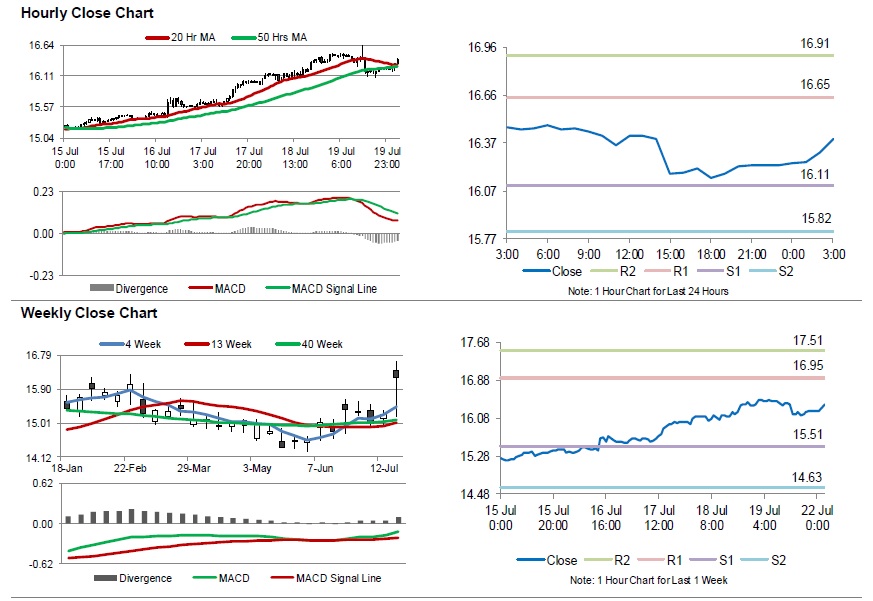
For the 24 hours to 23:00 GMT, Silver declined 0.80% against the USD and closed at USD16.22 per ounce on Friday, tracking losses in gold prices.
In the Asian session, at GMT0300, the pair is trading at 16.39, with silver trading 1.05% higher against the USD from Friday’s close.
The pair is expected to find support at 16.11, and a fall through could take it to the next support level of 15.82. The pair is expected to find its first resistance at 16.65, and a rise through could take it to the next resistance level of 16.91.
The white metal is showing convergence with its 20 Hr and 50 Hr moving averages.
Crude Oil: Oil Trading Higher In The Asian Session
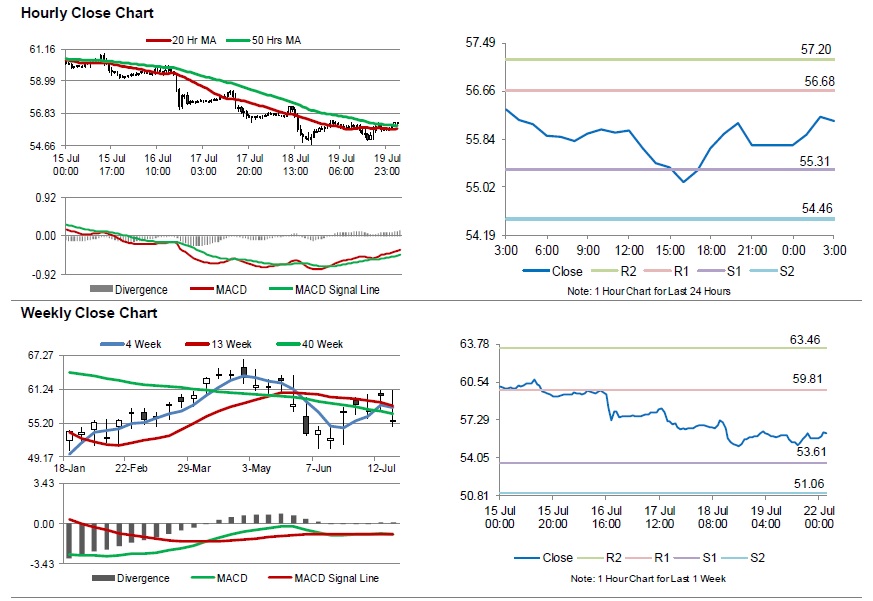
For the 24 hours to 23:00 GMT, Crude Oil rose 0.57% against the USD and closed at USD56.12 per barrel on Friday, after a report indicated that UK’s flagged oil tanker was seized by Iranian Revolutionary Guard in the Gulf of Oman. Additionally, fresh figures from Baker Hughes disclosed that the number of active oil rigs fell by 5 to 779 in the week ended 19 July, marking its lowest level since February 2018.
In the Asian session, at GMT0300, the pair is trading at 56.15, with oil trading 0.05% higher against the USD from Friday’s close.
The pair is expected to find support at 55.31, and a fall through could take it to the next support level of 54.46. The pair is expected to find its first resistance at 56.68, and a rise through could take it to the next resistance level of 57.20.
Crude oil is trading above its 20 Hr moving average and showing convergence with its 50 Hr moving average.
A Steady Start To The week
Hong Kong shares pressured
It was a quiet session in Asia to open the week with equities performing better than other asset classes. Most indices countered Friday’s losses on Friday, eking out small gains without any particular motive driving sentiment. US indices rose between 0.20% and 0.25% but Hong Kong stocks under-performed following more weekend anti-government protests which turned violent again. The HK33 index slumped 0.75% to 28,540.
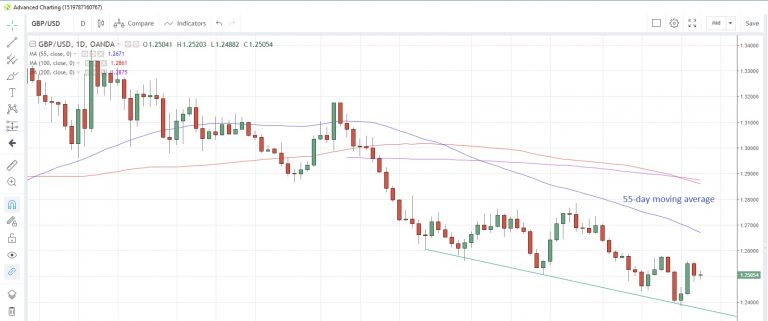
On the currency side, the yen was slightly better offered, falling 0.2% vs the US dollar and 0.07% versus the Australian dollar. The pound was steady versus the greenback as markets await the result of the Conservative Party leadership race, which will probably be known tomorrow.
GBP/USD Daily Chart
Raising the debt ceiling
The US press is reporting that the Trump Administration and legislators are close to reaching an agreement on US budget caps and the debt ceiling. The deal supposedly raises the debt ceiling for two years while spending limits would also be set for two years. It is believed that any spending cuts would be in the future and seen significantly below the $150 billion requested by the Trump Administration. Last Thursday, US Treasury Secretary Mnuchin said there could be cash issues as early as September if the debt ceiling was not raised.
EUR/USD Remains At Risk Of More Downsides
Key Highlights
- The Euro failed to break the key 1.1280 resistance and declined against the US Dollar.
- A major bearish trend line is forming with resistance near 1.1280 on the 4-hours of EUR/USD.
- The Michigan Consumer Sentiment Index in July 2019 (Prelim) increased from 98.2 to 98.4.
- The Chicago Fed National Activity Index in June 2019 might increase from -0.05 to 0.10.
EURUSD Technical Analysis
The Euro made a few attempts to break the key 1.1280 resistance area against the US Dollar. However, the EUR/USD failed to gain momentum above 1.1280 and recently declined below 1.1250.
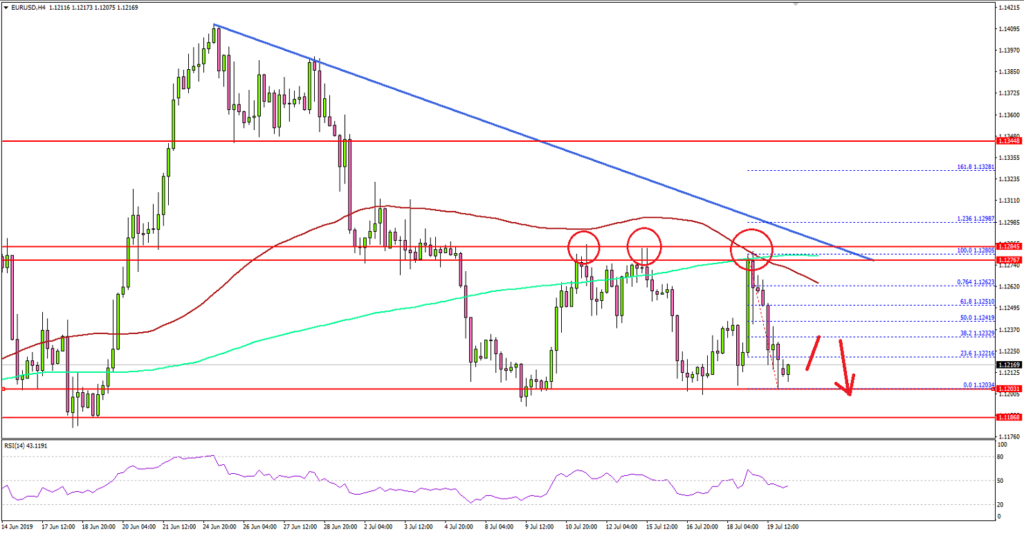
Looking at the 4-hours chart, the pair failed near a crucial resistance area at 1.1280, the 100 simple moving average (red, 4-hours), and 200 simple moving average (green, 4-hours).
As a result, there was a bearish reaction below the 1.1250 and 1.1240 support levels. The pair even broke the 1.1220 support area and traded close to the 1.1200 support area.
A swing low was formed near 1.1204 and the pair is currently consolidating losses. An immediate resistance is near the 1.1240 level and the 50% Fib retracement level of the downward move from the 1.1280 high to 1.1204 low.
However, the main resistance is near the 1.1280 level. Moreover, there is a major bearish trend line forming with resistance near 1.1280 on the same chart.
Therefore, the pair might continue to struggle near 1.1280. On the downside, if there is a bearish break below the 1.1200 support, the pair could accelerate losses in the coming sessions.
The next key supports are near 1.1180 and 1.1175, below which the pair might decline towards the 1.1150 support area.
Looking at GBP/USD, the pair is also facing a strong resistance near the 1.2550-1.1260 area. Besides, USD/JPY needs to clear the 108.20 resistance area to continue higher in the near term.
Economic Releases to Watch Today
- UK's CBI Industrial Trends Survey Orders July 2019 (MoM) – Forecast -10, versus -15 previous.
- Chicago Fed National Activity Index for June 2019 – Forecast 0.10, versus -0.05 previous.
Market Morning Briefing: Euro-Yen Is Stuck Above Support At 121
STOCKS
Equities broadly remain negative in the near term. Market looks likely to be turning cautious ahead of the US Fed meeting next week and some profit is being taken off the table. Dow, DAX has room to dip further in the coming days. Asians are also trading in the red following the sell-off in the US equities on Friday. Sensex and Nifty are coming near their significant supports and can see a bounce in the coming days.
Dow (27154.20, -68.77, -0.25%) is facing resistance at 27350 now. The near-term view is negative. It can test 27000. A break below 27000 can see the fall accelerating to 26600. Dow has to rise past 27500 to bring back the bullish sentiment.
DAX (12260.07, +32.22, +0.26%) has resistance between 12350 and 12400. While below 12400 the outlook is bearish to test 12100 and 12000 in the near term.
Nikkei (21394.28, -72.71, -0.34%) has come-off again failing to breach 21450 decisively as expected. The negative view is intact to test 20900 and 20750 on the downside in the coming days. Resistance is at 21500.
Shanghai (2903.04, -21.16, -0.72%) has dipped towards the lower end of it 2900-2950 range. A bounce from here will keep the sideways range intact. But a break below 2900 will drag the index lower to 2850 or even lower in the coming days. We expect 2900 to hold and the sideways move to continue. We will have to wait and see.
Sensex (38337.01, -560.45, -1.44%) tumbled on Friday but has a significant support coming up at 38000 which we expect to hold. A bounce to 38600 and 38800 can be seen after a test of 38000.
Nifty (11419, -177.65, -1.53%) has cluster of supports between 11380 and 11300. We expect the Nifty to bounce to 11600 from this support cluster in the coming days.
COMMODITIES
Commodities are stable. Crude looks bullish for the very near term. Gold and Copper could fall a bit to test support levels in the next couple of sessions. Silver could fall while below resistance near 15.50.
Brent (63.27) and Nymex WTI (56.28) are trading slightly higher. Brent could rise towards 65 in the near term while WTI could test 58 from where another dip looks possible. Although very near term could see slight rise in crude prices, the rise is likely to be short lived. Below current levels there is scope of testing 62 and 54 respectively.
Both Gold (1427.10) and Silver (16.36) have dipped. While silver seems to be holding below immediate resistance near 16.50, Gold has held below 1450. On Gold, 1420 is an immediate support from where a bounce back to levels of 1460/1480 is possible in the medium term. On Silver, while the daily resistance near 16.50 holds on the line chart, price could fall dip towards 16.
Copper (2.7530) rose to test 2.80 on the upside but could not sustain at those levels and instead came down to close lower on Friday. The fall could extend towards 2.70-2.68 from where a rise back towards 2.80 or higher is possible in the longer run. Near term range could be seen within 2.70-2.80.
FOREX
Dollar Index (97.18) is trading slightly up. Overall ranged movement is seen 96.60-97.60 region and could continue for the near term.
Euro (1.1216) is stuck in the 1.12-1.13 region both being immediate support and resistance levels. A sustained break on either side is required to get directional clarity for the coming sessions. While Dollar Index trades below 97.50, Euro could attempt to re-test 1.13 in the next 2-3 sessions.
Dollar-Yen (107.95) has bounced well from just above support at 107. While above 107, Dollar-Yen could rise towards 108.50-109.00 in the near term. View is bullish while above 107.
Euro-Yen (121.09) is stuck above support at 121. The currency pair is trading at crucial levels and a break below 121, if seen and sustains could be vulnerable to a sharp fall in the longer run. We watch price action near 121 closely. A bounce from here could take it back towards 123 but chances of a bounce looks less likely just now.
Aussie (0.7039) and Pound (1.25) have resistance near 0.71 and 1.26 which seem to be holding well and could the currencies towards 0.69 and 1.24/22 in the medium term.
PBOC has set the day's reference rate at 6.8759 against 6.8635 on Friday. USDCNY (6.8761) could rise towards 6.88-6.90 in the near term. View is bullish while above 6.86.
USDINR (68.8125) could trade within 68.75-69.00 for a couple of sessions with an eventual rise towards crucial resistance at 69.25.
INTEREST RATES
Yields continue to remain negative in the near term. Both the German and the US bond yields can dip further in the coming days. The 10Yr GoI can consolidate and see a corrective bounce in the near term.
The US Treasury yields 2Yr (1.83%), 5Yr (1.82%), 10Yr (2.06%) and 30Yr (2.58%) bounced across tenors on Friday. However, the near term view remains negative. The 30Yr can dip to 2.50% while it remains below 2.60%. The 10Yr Treasury yield can revisit the key psychological level of 2% while it trades below 2.10%.
The German yields have dipped further in line with our expectation. The 2Yr (-0.79%), 5Yr (-0.66%), 10Yr (-0.33%) were down while the 30Yr (0.27%) remained stable. The yields have more room on the downside. The 2Yr can test -0.85% and the 10Yr can dip to -0.40% in the near term.
The 10Yr GoI (6.3615%) remained stable on Friday. As mentioned earlier, a bounce to 6.50% and 6.55% is possible while the 10Yr GoI sustains above 6.25%. A consolidation between 6.25% and 6.42% is also possible before we see the above mentioned rise.
Forex Forecast And Cryptocurrencies Forecast
First, a review of last week's events:
EUR/USD. Recall that the majority (65%) of experts expected further strengthening of the dollar and the slide of the pair to the 1.1150-1.1200 zone. And the pair went down, reaching the level of 1.1200 on the night of July 16-17. However, the strength of the bears dried up there and, two days later, the bulls returned the pair to where it started on Monday July 15, to the level of 1.1285. Thus, for the second week in a row, the pair is in a fairly narrow side channel, limiting its fluctuations to the boundaries of 1.1190 and 1.1285. The reason for such a lull (perhaps before the storm) is not the summer holidays of investors, but their expectation of the ECB meeting on Thursday July 25, at which the European regulator may decide to lower the interest rate;
GBP/USD. If you look at the D1 chart, you can say that the pound experienced another technical correction last week. The reason for this was strong data on wages and retail sales in the UK. But on the whole, everything was developing exactly as the majority (60%) of the experts had supposed. Being in a downtrend since mid-March, the pair first tested the support in the 1.2440 zone again, then, breaking through it, reached the January 3, 2019.low, 1.2405, after which it dropped another 25 points and, groping the bottom at the level of 1.2380, turned up. As part of the correction, the pair rose by almost 180 points, and ended the week in the 1.2500 zone;
USD/JPY. In general, the dynamics of the pair corresponded to analysts' forecasts. However, volatility was slightly lower than expected. So, against the background of the strong growth of the Dow Jones Industrial Average index, a third of the experts waited from the pair to rise to the zone 108.50-109.00 at the beginning of the week. However, the bulls managed to raise it only to the height of 108.37. After that, the initiative went to the bears and, as predicted by 70% of analysts, the pair went south - to the lows of June around of 106.75-107.00. But here it missed the target by some 20 points as well. The fall stopped at 107.20. This was followed by another trend reversal, and the pair met the end of the week at around 107.70;
Cryptocurrencies. US authorities have literally turned against Facebook's intentions to launch its cryptocurrency Libra. Moreover, the Financial Services Committee of the House of Representatives has prepared a bill to ban the release of cryptocurrencies not only by Facebook, but also by any other large companies with annual profits above $25 billion (for example, Google). If Trump signs this law, violators will pay a fine of $1 million per day. And although Facebook's profit from Libra may be higher than this amount, the company may refuse this project, not wanting to aggravate relations with the authorities.
Against this background, Bitcoin continued to fall, reaching a four-week low at around $9.080. True, then there was a rebound upwards, as a result of which the losses of the BTC/USD pair decreased and amounted to about 11% in seven days.
Ethereum (ETH/USD) and Ripple (XRP/USD) went down as well. But Litecoin (LTC/USD) was able to return to its original values in the second half of the week: on the eve of the halving in August, investors found this altcoin undervalued and began buying it.
As for the forecast for the coming week, summarizing the opinions of a number of analysts, as well as forecasts made on the basis of a variety of methods of technical and graphical analysis, we can say the following:
EUR/USD. The markets continue to be ruled by the expectations of a quick decline in interest rates by the US Federal Reserve and the ECB. As was said, the market does not exclude that the European regulator will announce this already next Thursday, on July 25th. Although many experts believe that until the end of September the rate will remain at the same level, that is, zero. In the first case, the pair can go down sharply. In the second case, sharp fluctuations in the rate are not likely to be expected. Moreover, despite the slowdown in economic growth, the situation in the Eurozone is not so bad: manufacturers' prices are still growing, and the current operations surplus in June was almost €30 billion (compared with €22.5 billion in April). And this despite the trade wars!
It is interesting to see what the US will do in this situation? President Trump was outraged in his Twitter saying that the quantitative easing policy by the ECB and the depreciation of the euro against the dollar will allow the EU to 'unfairly easier compete with the United States.' 'Europe is getting away with it for years - along with China and others!', Trump wrote, which strengthened investors' expectations regarding the devaluation of the dollar and the rate cut by the Fed.
In whose direction, the euro or the dollar, will the scales swing? There are more questions than answers. Moreover, the statements of US Treasury Secretary Stephen Mnuchin are directly opposed to what Trump says and writes. So, recently, after the meeting of G7 finance ministers in France, Mnuchin assured journalists that there was no change in the policy of a strong dollar at the moment.
In the meantime, the absolute majority of experts - 75%! - expect the pair to rise to the height of 1.1350-1.1415. The nearest resistance is 1.1285.
The remaining 25% of analysts and 90% of oscillators and 100% of trend indicators on D1 strongly disagree with them. They all expect the pair to decline to the spring lows in the area of 1.1100-1.1115.
As for the events that may affect the formation of short-term trends, this week we can note the release of the following data: July 23 - results of a study of bank lending in the Eurozone, July 24 - indicators of Markit business index in Germany and the Eurozone, and annual data on US GDP, which will see the light on Friday July 26th.
GBP/USD. On Tuesday, the minutes of the UK Financial Policy Committee meeting will be published. However, this rather important document is unlikely to be noticed by the market against the background of another event that will also happen on this day. On July 23, the British Conservative Party, after the counting of votes, will announce the name of the new prime minister. Recall that there are two candidates for this position: the former mayor of London and the former foreign minister, Boris Johnson, and the current foreign minister, Jeremy Hunt. And the fate of Brexit depends on who of them will occupy this post - how will the process of leaving the EU go, whether it will be completed and under what conditions.
Most analysts (65%) expect the pound to strengthen and the pair to grow to the zone of 1.2650-1.2750. The nearest resistance is 1.2575. The remaining 35% of experts believe that before it goes up, the pair should still return to the zone 1.2380-1.2405. Graphic analysis on D1 takes an even more radical position. According to his forecast, the pair can break through support in the 1.2400 zone and drop another 200 points within two weeks;
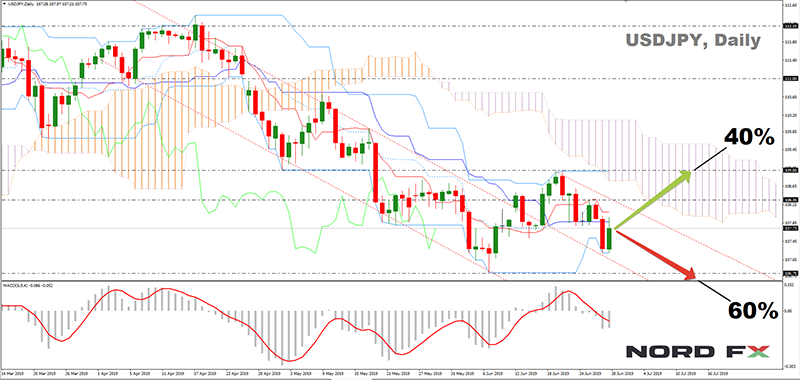
USD/JPY. For this pair, graphical analysis on D1 draws first a movement in the range of 106.75-108.35, and then rising to the height of 109.00. However, only 40% of experts agree with this forecast, their opinion is based on recently published macroeconomic statistics.
Recall that the purpose of the Bank of Japan is the inflation rate of 2%. However, its achievement can only be dreamed of. The inflation in June 2019 turned out to be exactly the same as a year ago and was only 0.7%. In such a situation, the Japanese regulator may start thinking about lowering the interest rate, as their colleagues in the Asia-Pacific region have already done - Australia, India, Indonesia and South Korea.
The remaining 60% of analysts believe such a move by the Bank of Japan is unlikely. In their opinion, the probability of a decrease in the dollar rate at the US Federal Reserve meeting on July 31 is significantly higher. In this case, the pair can not only descend to the horizon of 106.75, but also, breaking through it, rush to the January 2019 low in the zone 105.00. 90% of the oscillators and 100% of the indicators on D1 are siding with the bears;
Cryptocurrencies. At the end of Friday, July 19, the BTC/USD pair was in the area of a strong four-week support level (and now resistance level already) $10,500. And although it is impossible at the moment to formulate any kind of definite opinion, in the transition to the medium-term forecast, the overwhelming majority of experts (65%) vote for the growth of the pair.
In this case, problems of Facebook, Google and other large companies with the release of their own altcoins can play into the hands of bitcoin. Unlike Libra, bitcoin is a decentralized cryptocurrency, and therefore the US government will not be able to blame anyone about its release and regulation anyone.
Moreover, the conspiracy theorism has again surfaced that the patronage of bitcoin is none other than the US Treasury, which will do everything possible to eliminate the competitors of this reference digital asset.
RBA’s Big Challenge with Unemployment
RBA is unlikely to cut rates month but the forecasts which will be released will point to further action later in the year.
The Reserve Bank Board minutes for the July meeting have sent a clear message that the Board plans to pause in its easing cycle at the next meeting in August.
Following the release of the minutes I wrote: the best way to assess the likelihood of a move in August is to compare the wording in the June minutes with the wording in the July minutes. In the June minutes, the key “considerations” section noted “members agreed that it was more likely than not that a further easing in monetary policy would be appropriate in the period ahead”. This very strong sentence was not repeated in the July minutes.
Furthermore the minutes do state that “the Board will continue to monitor developments in the labour market closely, and adjust monetary policy if needed”. In the June minutes, the “if needed” qualification was not used, merely saying instead “members agreed that in assessing whether further monetary easing was appropriate, developments in the labour market would be particularly important”.
Finally, my experience is that when a central bank decides to pause, it often refers back to previous policy decisions. In the final paragraph of the July minutes, the Board notes “this decision, together with the reduction in the cash rate decided at the previous meeting, would assist in reducing spare capacity in the economy”.
However there will be considerable interest in the forecasts which the RBA provides in the Statement on Monetary Policy that will be released on August 9 following the Board meeting on August 6. Whilst these forecasts are not expected to trigger an immediate policy move they will be very important for the policy profile over the next few months.
When the RBA last released forecasts in May it forecast that real GDP growth would be 2.75% in both 2019 and 2020.
Note that the May forecasts were based on market pricing for the cash rate which, at the time, discounted two 25 basis point cuts by year's end.
The cuts were delivered earlier than market expectations at that time and the market is now pricing another move by year’s end. As such there is some justification for lifting the May forecasts, although more recent developments are much more important for comparing the May and August forecasts.
Since then the national accounts printed growth in the March quarter at 0.4%. Based on the RBA’s forecast for growth to June 2019 of 1.75%, we assess that they were expecting growth in 2019 H1 of around 1.25%.
That forecast is now likely to be lowered to 1% for 2019 H1. Consequently the RBA is now likely to lower the growth forecast for year to June 2019 to 1.5%.
However they are still likely to forecast growth in 2019 H2 at 1.5% meaning a downward revision to growth in 2019 of only 0.25% from 2.75% to 2.5%.
The forecast lift in momentum between H1 and H2 will be justified on the basis of the stimulus from the tax cuts, the cash rate cuts, and the return to stability in the housing market. All assessments are realistic although we would favour 1.25% rather than 1.5%.
The advantage of holding growth at 1.5% in 2019 H2 is that the 2019 result of 2.5% can justify a lift to 2.75% in 2020 confirming the Governor’s assessment that the economy will be growing around trend in 2020 – no change from the 2020 forecast in May despite the need to lower the 2019 forecast.
If the RBA had adopted our preferred 2.25% growth rate for 2019 then it would be a much bigger “stretch” to justify 2.75% in 2020.
It will be more difficult to hold to the May forecast of 2.0% for the underlying inflation measure (trimmed mean) in 2020. When the May forecasts were finalised the RBA was aware of the 0.3% print for the trimmed mean in the March quarter of 2019. As a result it was necessary to lower the 2019 forecast made in February from 2% to 1.75% and the 2020 forecast from 2.25% (comfortably within the 2–3% band) to 2%.
Westpac expects that the trimmed mean will print 0.3% in the June quarter (released on July 31) meaning 2019 H1 will be 0.6% for the trimmed mean. Under those circumstances it would be very difficult for the RBA to retain a credible forecast path of 1.75% (2019) and 2.0% (2020) for the trimmed mean.
It may decide to adopt a 1.5% (2019); 1.75% (2020) and 2.0% (2021) profile for the trimmed mean signalling that it will take even longer than previously anticipated to return to the 2–3% target band. As discussed we do not expect that move, in itself, would trigger an immediate rate cut. Yet in not eliciting a policy response, it would certainly cast further doubt on the RBA’s 2–3% inflation commitment.
The RBA has recently changed tack from emphasising growth and inflation to targeting unemployment. This is partly due to its frustration with the stickiness of wages growth. A tighter labour market is expected to boost wage pressures, which then lifts consumer spending, and thus pressures inflation through both higher costs and a narrowing output gap. The Governor has discussed a reasonable target of 4.5% for the unemployment rate.
Back in May the forecasts for the unemployment rate were 5.0% (December 2019), 5.0% December 2020, and 4.75% (June 2021). Since then unemployment has drifted up to 5.24% in June. Note that we expect the RBA will be forecasting growth in 2019 (H2) at around 3% (annualised) and 2.75% in 2020. This is only slightly above trend in 2019 (H2) and at trend in 2020.
Trend growth is not sufficient to lower the unemployment rate, challenging the RBA to raise its forecast for the unemployment rate in 2020 to 5.25%.
That is a long way from the Governor’s desired 4.5% target.
Such a forecast certainly justifies our call for another rate cut and intensifies our expectation (which we highlighted in our note in May) that risks to the 0.75% target rate were to the downside.
The vulnerability of the unemployment forecast also requires a very realistic expectation that the RBA will not wait until November to deliver the next move with every meeting after August likely to be very much a live meeting.
If we concede that the risks to our 0.75% “bottom” to the cash rate are to the downside, the issue becomes one of what is the realistic lower bound for the cash rate?
Issues to be considered are the effectiveness of policy, noting that the RBA sees the two major channels of stimulus coming through a lift in disposable income for borrowers and the currency.
The first two cuts in this cycle have been quite effective with an average of 45 basis points of pass through. The effectiveness of the next cut - which we confidently anticipate - will be an important indicator of likely future moves.
Daily Markets Broadcast
Wall Street falls as Fed hopes dialed back
US indices gave back early gains to close in the red on Friday after Fed’s Bullard dented hopes of a 50bps rate cut next week. Weekend protest in Hong Kong turned violent again, which could hurt Hong Kong and China shares. Tensions remain high in the Gulf.
US30USD Daily Chart
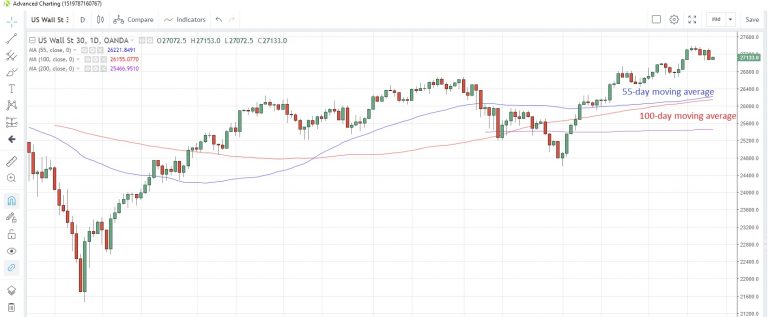
The US30 index slumped to the lowest close in more than a week on Friday, despite upbeat earnings from Microsoft
The 100-day moving average at 26,155 and the 55-day average at 26,222 continue to track each other higher
St. Louis Fed President James Bullard said a 50-basis-point cut would be overdone and may cause markets to sell off. There are no US data releases scheduled for today.
DE30EUR Daily Chart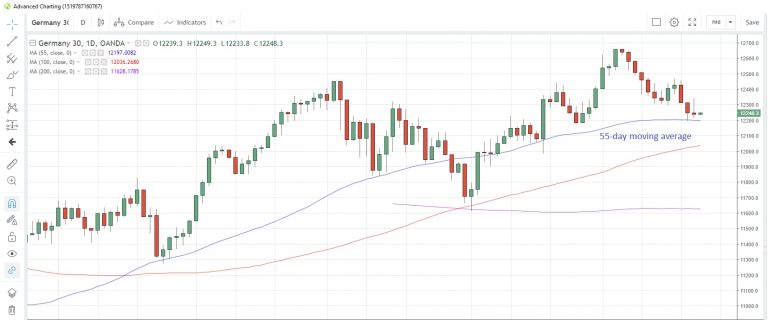
The Germany30 index fell for a third straight day on Friday amid rising speculation that Italy may be headed for early elections
The index is hovering above the 55-day moving average at 12,197, which has supported prices on a closing basis since June 3
Germany’s producer prices fell more than expected in June, declining 0.4% m/m versus a forecast of -0.2%. That was the weakest reading in six months. There are no major data releases from either Germany or the Euro-zone today.
WTICOUSD Daily Chart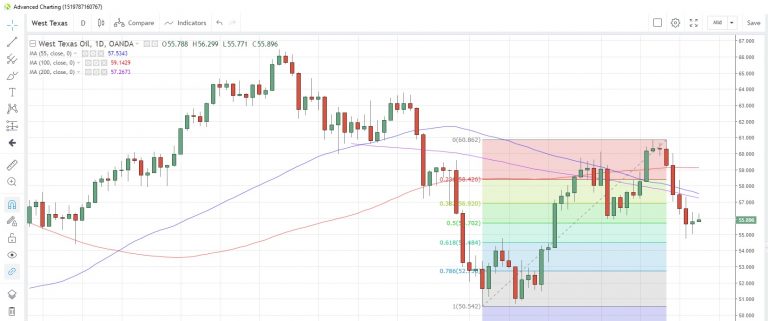
Crude oil prices snapped a five-day losing streak on Friday after news emerged that Iran had seized a British oil tanker in the Straits of Hormuz, heightening geopolitical tensions in the region
WTI is extending the rebound from one-month lows to a second day in early trading this morning. Prices are rising toward the 200-day moving average at $57.27
The American Petroleum Institute releases crude oil stockpiles data as at July 19 tomorrow. Last week saw a drawdown of 1.4 million barrels from inventories.