Sample Category Title
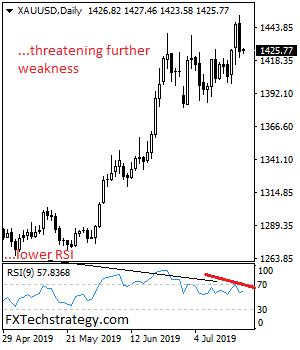
GOLD Backs Off Higher Prices On Pullback
GOLD may be biased to the upside in the medium term but faces pullback risk after rejecting higher prices on Friday. On the downside, support comes in at the 1,420.00 level where a break will turn attention to the 1,410.00 level. Further down, a cut through here will open the door for a move lower towards the 1,400.00 level. Below here if seen could trigger further downside pressure targeting the 1,390.00 level. Conversely, resistance resides at the 1,430.00 level. Further out, resistance resides at the 1,440.00 level where a break will aim at the 1,450.00 level. A turn above there will expose the 1,460.00 level. Further out, resistance stands at the 1,470.00 level. All in all, GOLD looks to strengthen further in the short term.
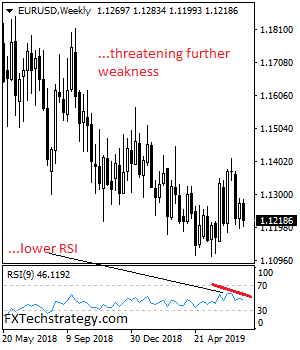
EURUSD Consolidates With Downside Threats
EURUSD consolidates with downside threats as it retains its broader medium term trend. Support comes in at the 1.1200 where a violation will turn risk to the 1.1150 level. A break below here will target the 1.1100 level. Further down, support sits at the 1.1050. Its weekly RSI is bearish and pointing lower suggesting more weakness. Conversely, on the upside, resistance resides at 1.1250 level with a break through there opening the door for further upside towards the 1.1.1300 level. Further up, resistance comes in at the 1.1350 level where a violation will expose the 1.1400 level. All in all, EURUSD expects more weakness to occur in the days ahead.
USDCHF Retains Its Downside Pressure
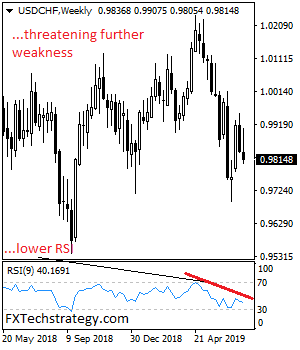
USDCHF retains its downside pressure as it looks to weaken further in the days ahead. Resistance resides at the 0.9850 level. Above here, resistance lies at the 0.9900 level and then the 0.9950 level. Further out, resistance comes in at the 1.0000 level. On the downside, support is seen at the 0.9750 level with a turn below here opening the doorUSDCHF Retains Its Downside Pressure
by Mohammed Isah | July 20th, 2019
USDCHF retains its downside pressure as it looks to weaken further in the days ahead. Resistance resides at the 0.9850 level. Above here, resistance lies at the 0.9900 level and then the 0.9950 level. Further out, resistance comes in at the 1.0000 level. On the downside, support is seen at the 0.9750 level with a turn below here opening the door for more decline towards the 0.9700 level. And then the 0.9650 level. Further down, support resides at the 0.9600 level. Its daily RSI is bearish and pointing lower suggesting further weakness. All in all, USDCHF remains biased to the downside on further corrective weakness.
for more decline towards the 0.9700 level. And then the 0.9650 level. Further down, support resides at the 0.9600 level. Its daily RSI is bearish and pointing lower suggesting further weakness. All in all, USDCHF remains biased to the downside on further corrective weakness.
Eco Data 7/22/19
[php_everywhere instance="1"]
EUR/USD Weekly Outlook
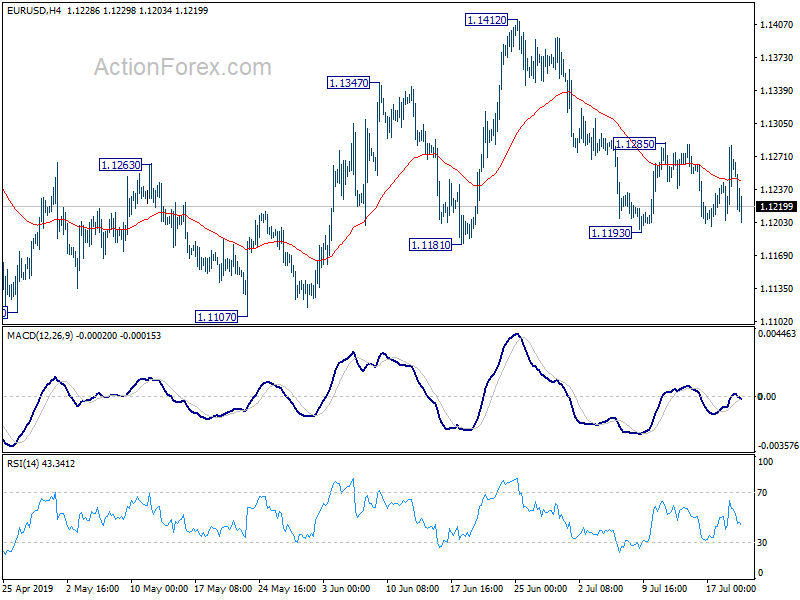
EUR/USD stayed in range of 1.1193/1285 last week and initial bias remains neutral this week first. On the downside, break of 1.1193 will resume the fall from 1.1412 to retest 1.1107 low. On the upside, above 1.1285 resistance will turn bias back to the upside for 1.1412 resistance.
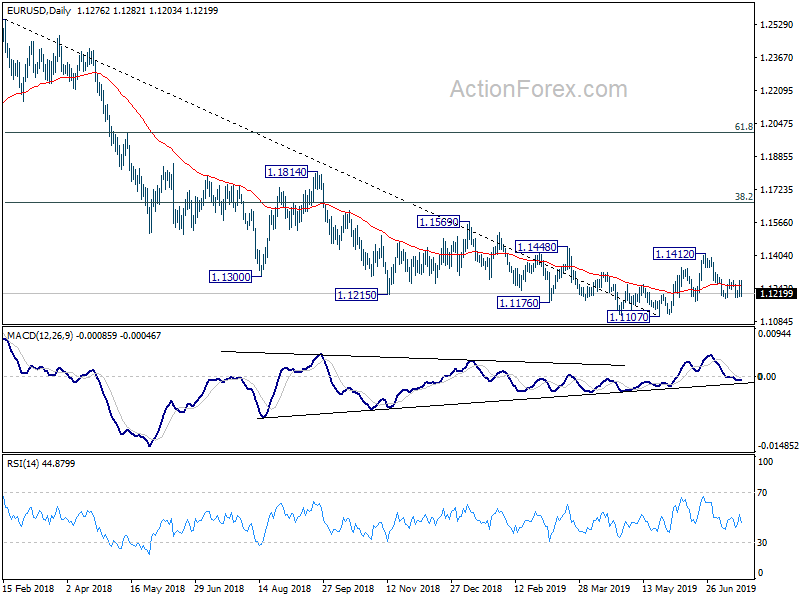
In the bigger picture, on the one hand, 1.1107 is seen as a medium term bottom on bullish convergence condition in weekly MACD. On the other hand, rejection by 55 week EMA retains medium term bearishness. Outlook stays neutral for now. On the downside, break of 1.1107 will resume the down trend from 1.2555 (2018 high) to 78.6% retracement of 1.0339 to 1.2555 at 1.0813. Meanwhile, break of 1.1412 will resume the rebound to 38.2% retracement of 1.2555 to 1.1107 at 1.1660.
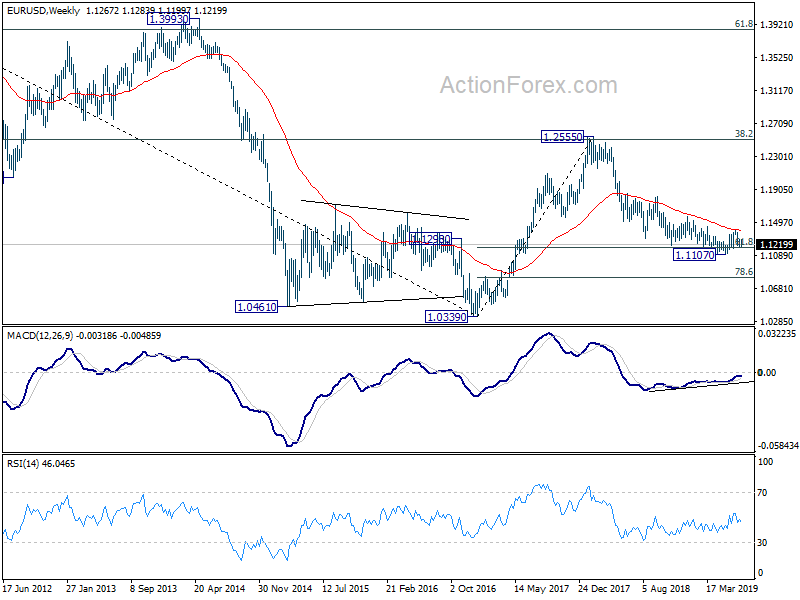
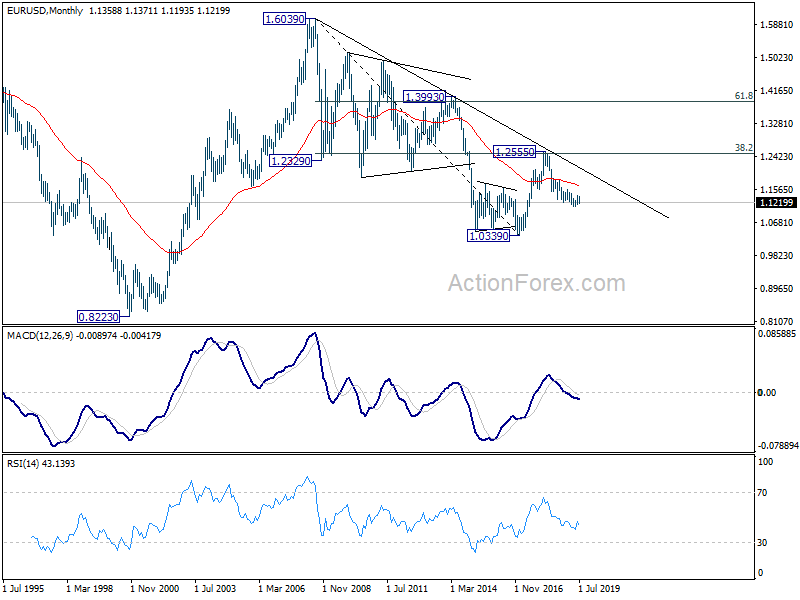
In the long term picture, outlook remains bearish for now. EUR/USD is held below decade long trend line that started from 1.6039 (2008 high). It was also rejected by 38.2% retracement of 1.6039 to 1.0339 at 1.2516 before. A break of 1.0039 low will remain in favor as long as 55 month EMA (now at 1.1658) holds).
USD/JPY Weekly Outlook
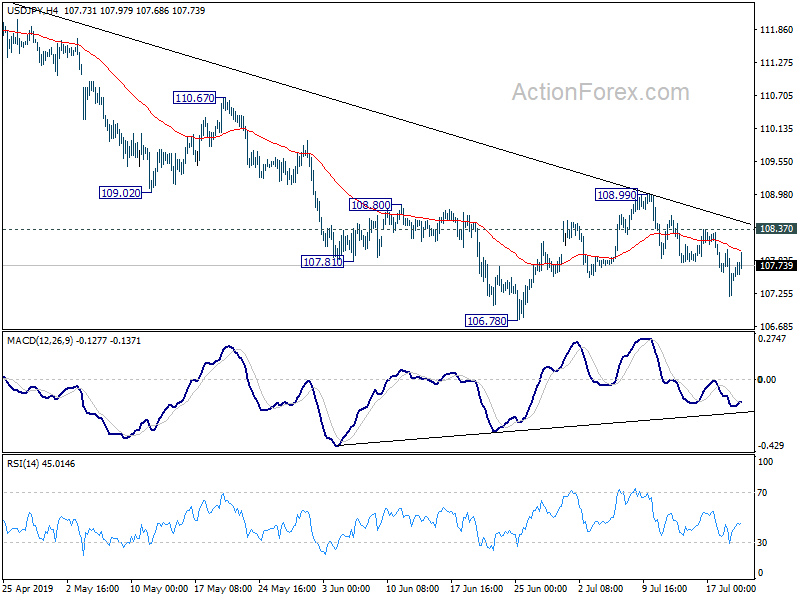
USD/JPY's gyrated lower last week as fall from 108.99 extends. Deeper fall should be seen initially this week for 106.78. Decisive break there will resume whole decline from 112.40 and target 104.69 low. On the upside, break of 108.37 will extend the correction from 106.78 with another rise, possibly through 108.99 resistance.
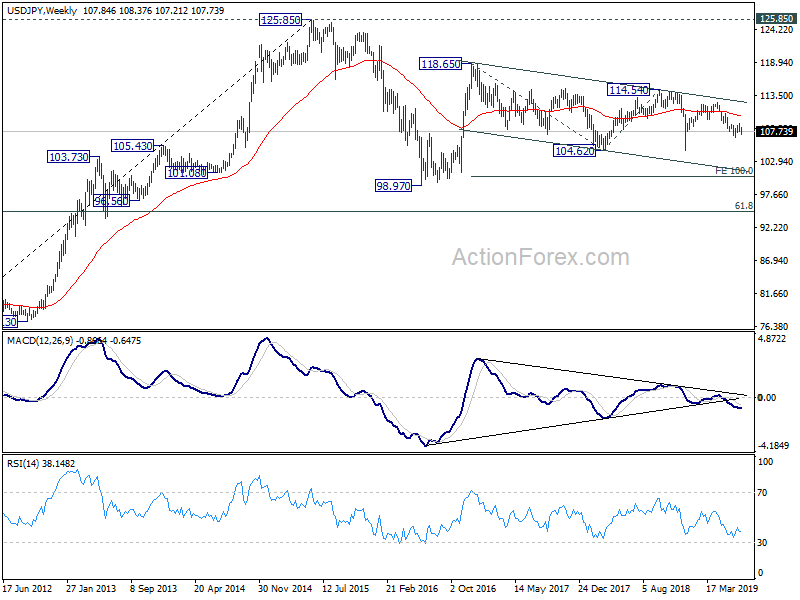
In the bigger picture, decline from 118.65 (Dec 2016) is still in progress, with the pair staying inside long term falling channel. Break of 104.62 will target 100% projection of 118.65 to 104.62 from 114.54 at 100.51. For now, we'd expect strong support above 98.97 (2016 low) to contain downside to bring rebound. In any case, break of 112.40 is needed to the first serious sign of medium term bullishness. Otherwise, further decline will remain in favor in case of rebound.

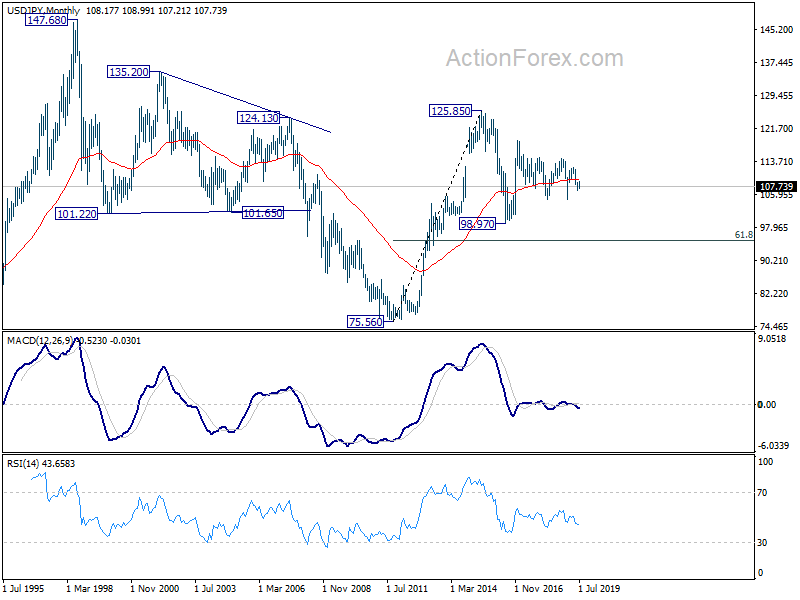
In the long term picture, the rise from 75.56 (2011 low) long term bottom to 125.85 (2015 high) is viewed as an impulsive move, no change in this view. Price actions from 125.85 are seen as a corrective move which could still extend. In case of deeper fall, downside should be contained by 61.8% retracement of 75.56 to 125.85 at 94.77. Up trend from 75.56 is expected to resume at a later stage for above 135.20/147.68 resistance zone.
GBP/USD Weekly Outlook
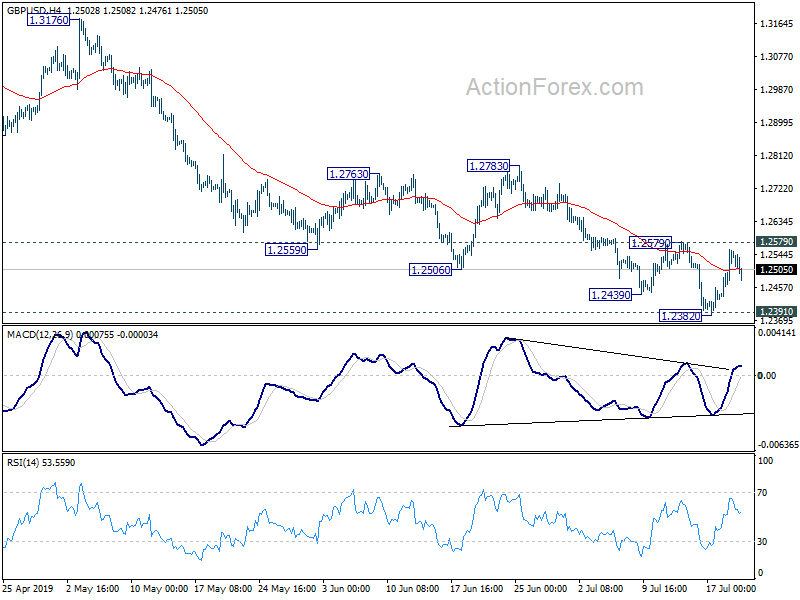
GBP/USD edged lower to 1.2382 last week but couldn't sustain below 1.2391 low and recovered. Initial bias is neutral this week first. Further fall is in favor as long as 1.2579 resistance holds. Sustained break of 1.2391 will resume larger down trend for 61.8% projection of 1.4376 to 1.2391 from 1.3381 at 1.2154 next. Though, break of 1.2579 will indicate short term bottoming and bring stronger rebound back to 1.2783 resistance. In this case, consolidation from 1.2391 would extend with another rise before completion.
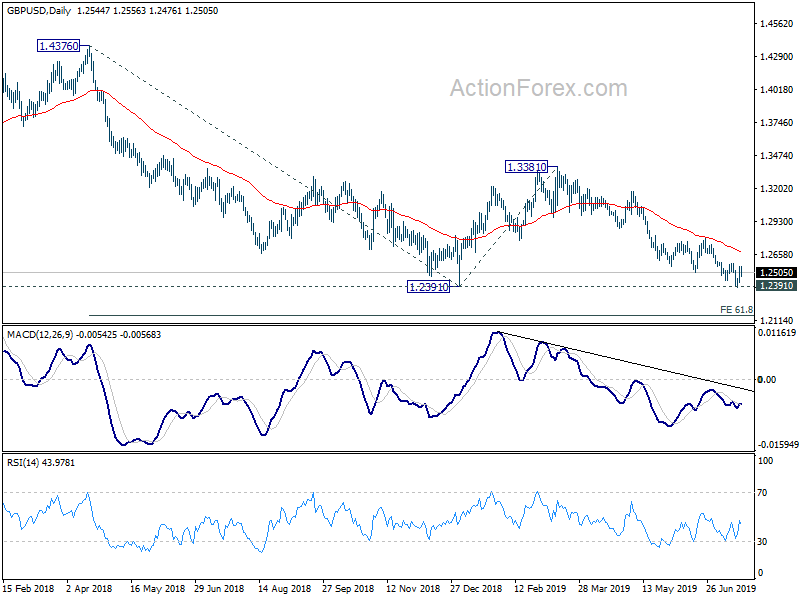
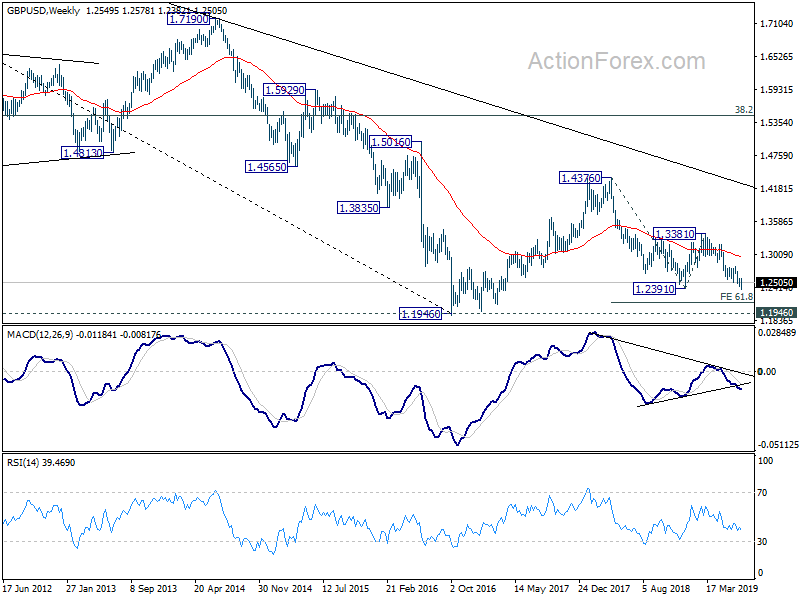
In the bigger picture, down trend from 1.4376 (2018 high) is still in progress. Break of 1.2391 would target a test on 1.1946 long term bottom (2016 low). For now, we don't expect a firm break there yet. Hence, focus will be on bottoming signal as it approaches 1.1946. In any case, medium term outlook will stay bearish as long as 1.3381 resistance holds, in case of strong rebound.
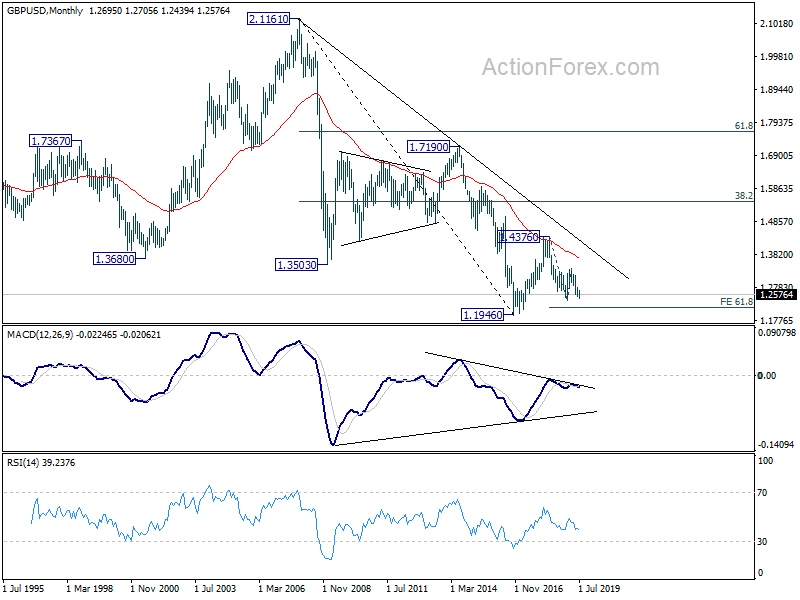
In the longer term picture, consolidative pattern from 1.1946 (2016 low) could still extend with another rising leg. But after all, decisive break of 38.2% retracement of 2.1161 (2007 high) to 1.1946 at 1.5466 is needed to indicate long term reversal. Otherwise, an eventual downside breakout will remain in favor.
USD/CHF Weekly Outlook
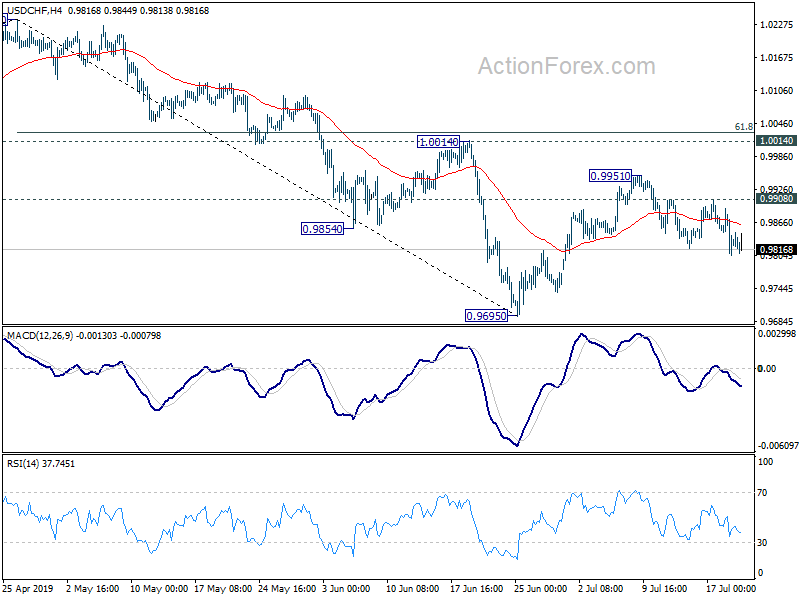
USD/CHF gyrated lower last week as fall from 0.9951 extended. Initial bias stays on the downside this week for retesting 0.9695 low first. Break will resume whole decline from 1.0237. On the upside, break of 0.9908 resistance will likely resume the rebound from 0.9695, through 0.9951, to 1.0014 resistance.
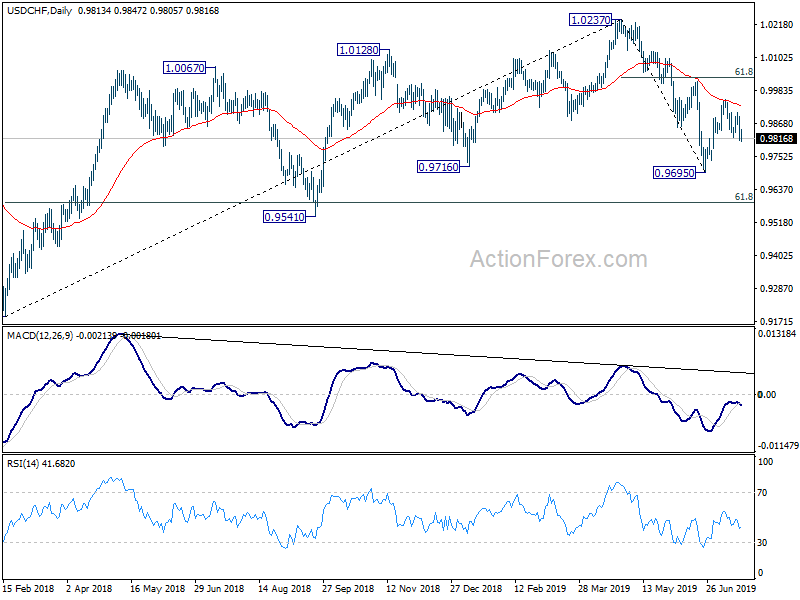
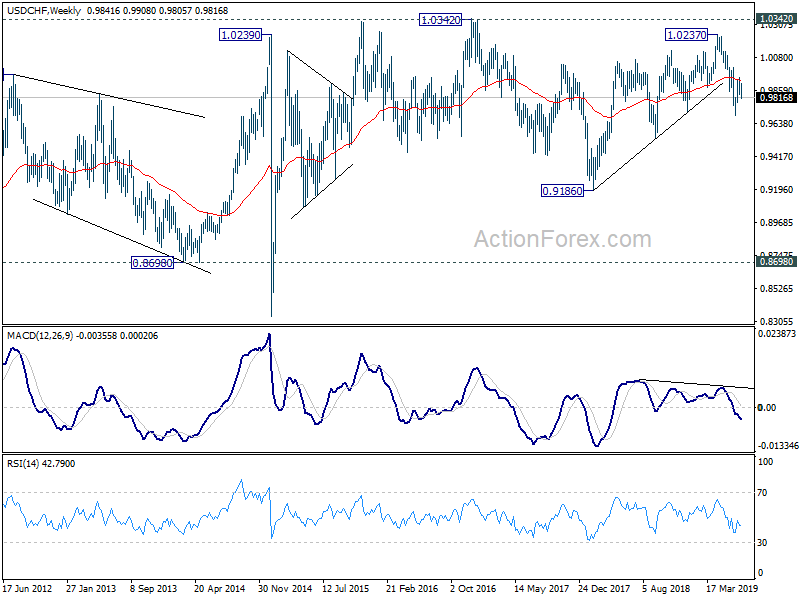
In the bigger picture, up trend from 0.9186 (2018 low) should have completed at 1.0237 already. Deeper decline would be seen to 61.8% retracement of 0.9186 to 1.0237 at 0.9587 and below. For now, USD/CHF is seen as in long term range pattern between 0.9186 and 1.0342. Hence, we'd pay attention to bottoming signal below 0.9587. However, sustained break of 1.0014 will revive medium term bullishness and turn focus back to 1.0237 high.
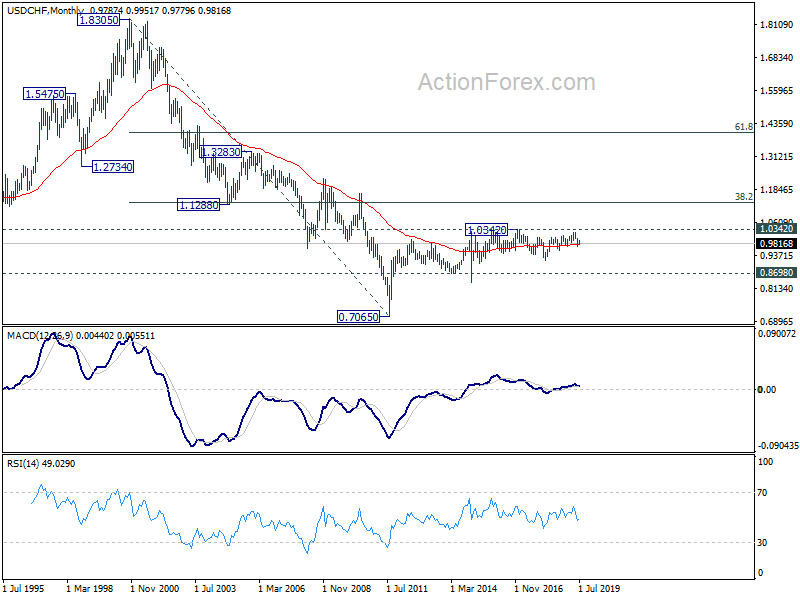
In the long term picture, price actions from 0.7065 (2011 low) are not clearly impulsive yet. Thus, we'll treat it as developing into a corrective pattern, at least, until a firm break of 1.0342 resistance.
AUD/USD Weekly Outlook
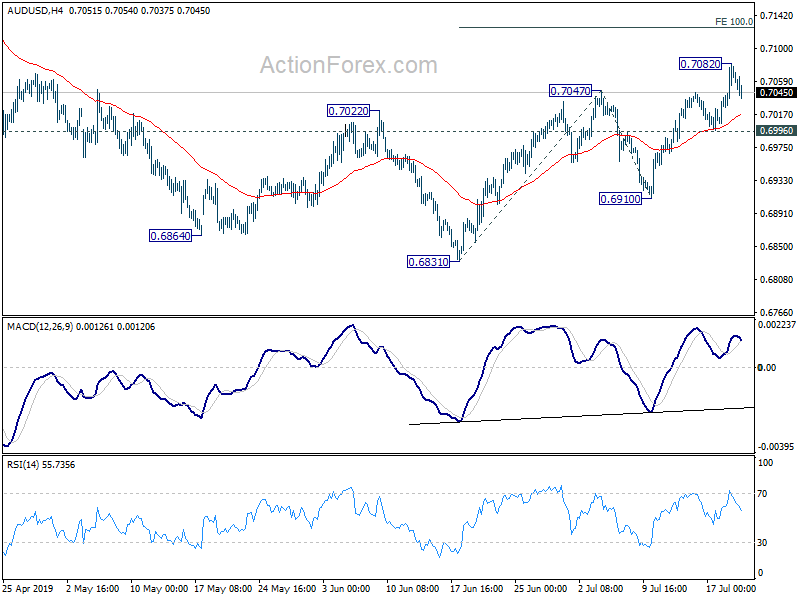
AUD/USD's rise from 0.6831 resumed last week by breaking 0.7047 resistance to 0.7082. As a temporary top was formed, initial bias is neutral this week first. Further rally is expected as long as 0.6996 minor support holds. Break ow 0.7082 will target 100% projection of 0.6831 to 0.7047 from 0.6910 at 0.7126. Sustained break there will indicate solid upside momentum for 0.7205 resistance next. On the downside, break of 0.6996 will suggest that the rebound has completed and turn bias to the downside for 0.6910 support instead.
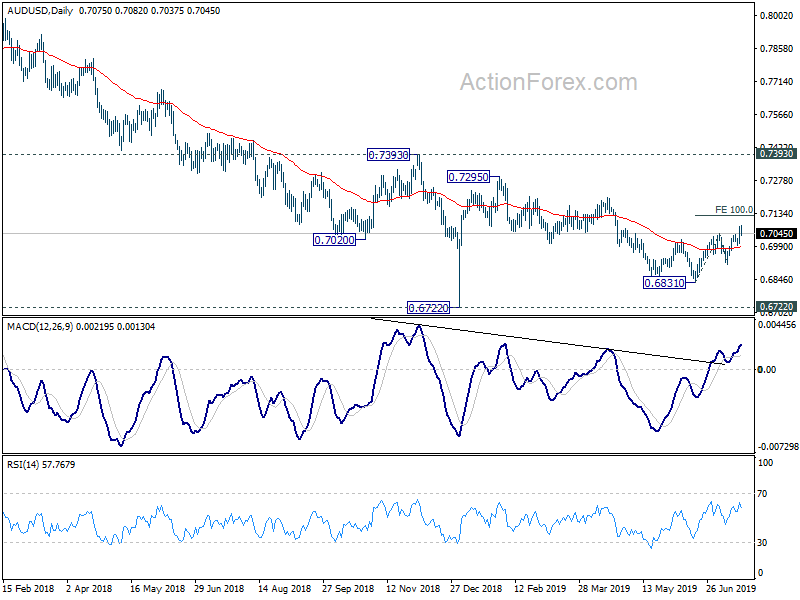
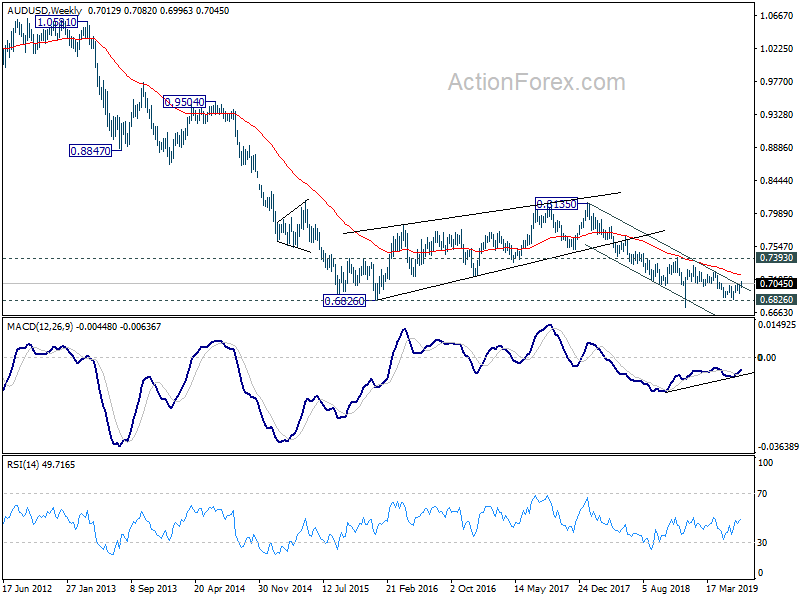
In the bigger picture, with 0.7393 key resistance intact, medium term outlook remains bearish. The decline from 0.8135 (2018 high) is seen as resuming long term down trend from 1.1079 (2011 high). Decisive break of 0.6826 (2016 low) will confirm this bearish view and resume the down trend to 0.6008 (2008 low). However, firm break of 0.7393 will argue that fall from 0.8135 has completed. And corrective pattern from 0.6826 has started the third leg, targeting 0.8135 again.
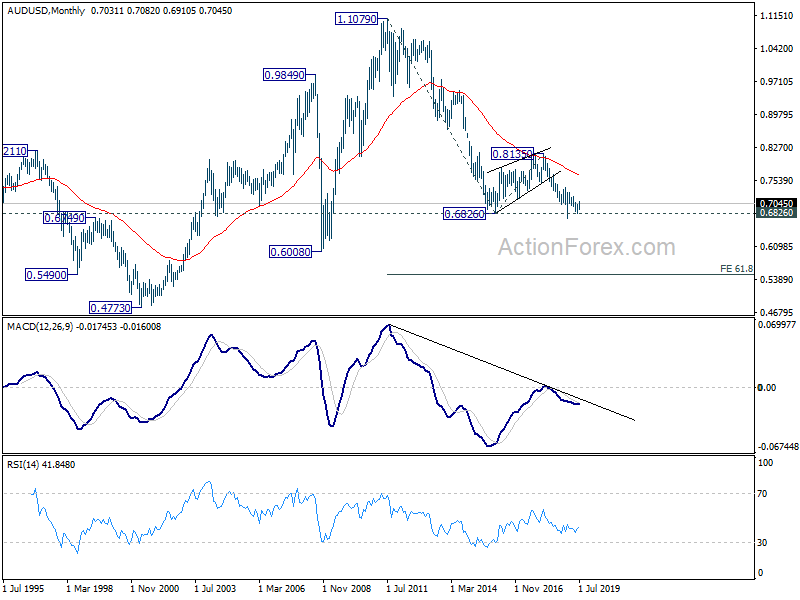
In the longer term picture, prior rejection by 55 month EMA maintained long term bearishness in AUD/USD. That is, down trend from 1.1079 (2011 high) is still in progress. Sustained break of 0.6826 will target 0.6008 low and then 61.8% projection of 1.1079 to 0.6826 from 0.8135 at 0.5507.
USD/CAD Weekly Outlook
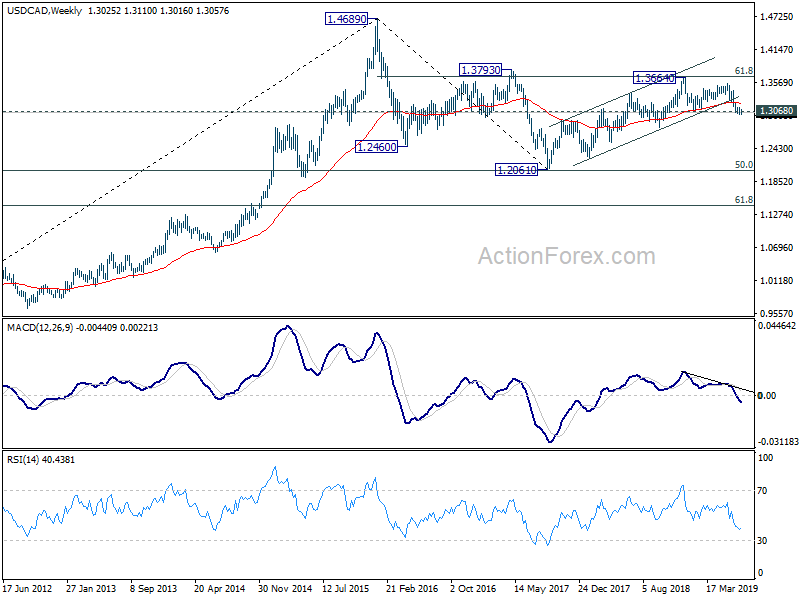
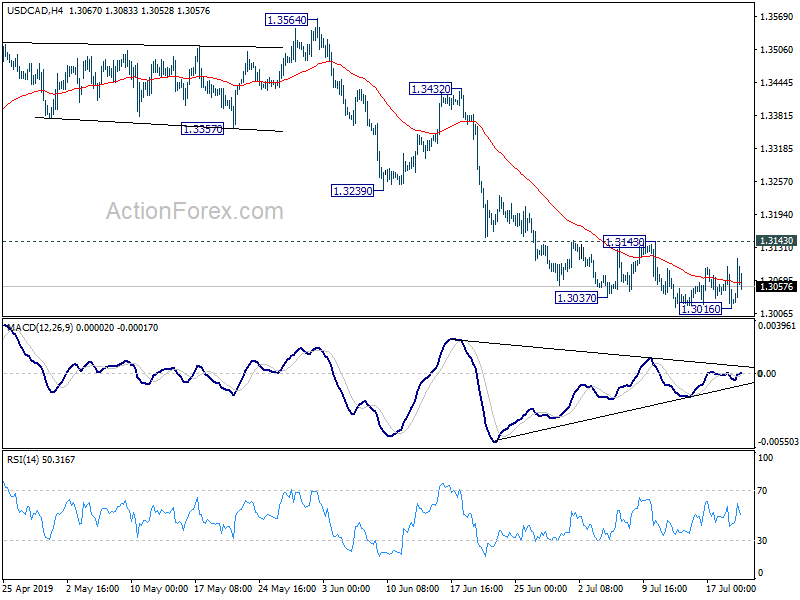
USD/CAD edged lower to 1.3016 last week but couldn't sustain below 1.3052/68 cluster support yet. Initial bias remains neutral this week first. Deeper fall is in favor with 1.3143 minor resistance intact. Sustain trading below 1.3052/68 cluster support should confirm medium term reversal. Deeper decline should then be seen to 1.2781 support next. Nevertheless, break of 1.3143 resistance will confirm short term bottoming and bring stronger rebound.
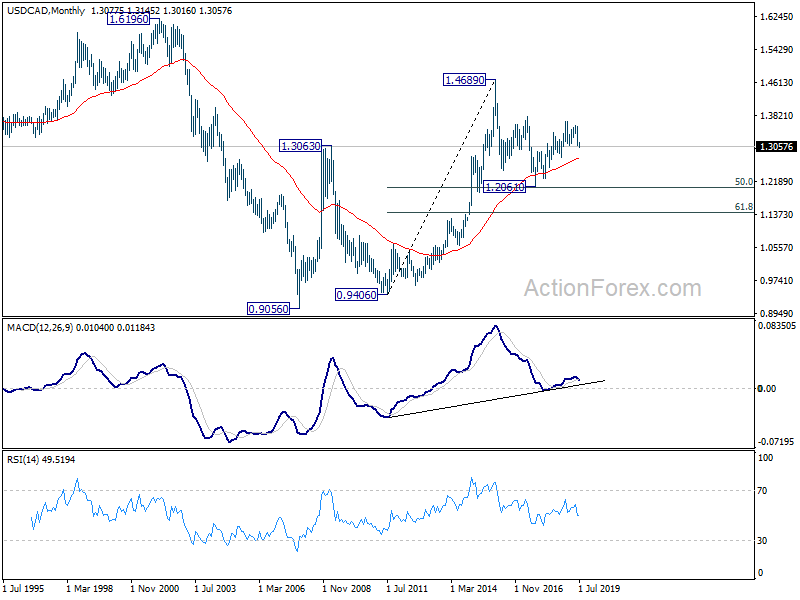
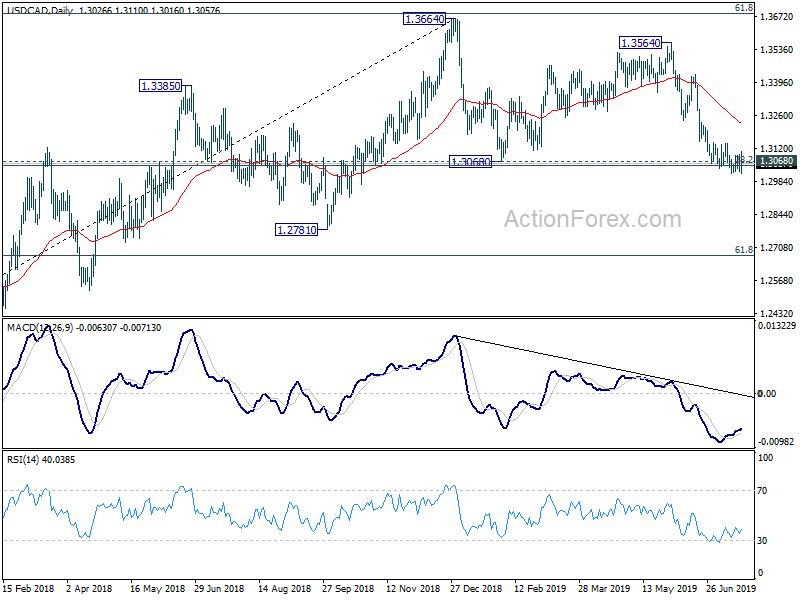
In the bigger picture, the case of bearish reversal continues to build up. Decisive break of 1.3068 cluster support (38.2% retracement of 1.2061 to 1.3664 at 1.3052) will confirm completion of up trend from 1.2061 (2017 low). Further fall should be seen to 61.8% retracement at 1.2673 next. On the upside, sustained break of 61.8% retracement of 1.4689 (2016 high) to 1.2061 at 1.3685, is needed to confirm resumption of up trend from 1.2061 (2017 low). Otherwise, risk will stay on the downside.
In the longer term picture, outlook remains unchanged that price actions from 1.4689 (2016 high) are forming a corrective pattern. Rejection by 1.3793 resistance would raise the chance of lengthier extension, with risk of dropping through 1.2061 low before completion.