Sample Category Title
USD/CHF Daily Outlook
Daily Pivots: (S1) 0.9800; (P) 0.9824; (R1) 0.9841; More...
With 0.9908 minor resistance intact, further decline is expected in USD?CHF for retesting 0.9695 low first. Break will resume whole decline from 1.0237. On the upside, break of 0.9908 resistance will likely resume the rebound from 0.9695, through 0.9951, to 1.0014 resistance.
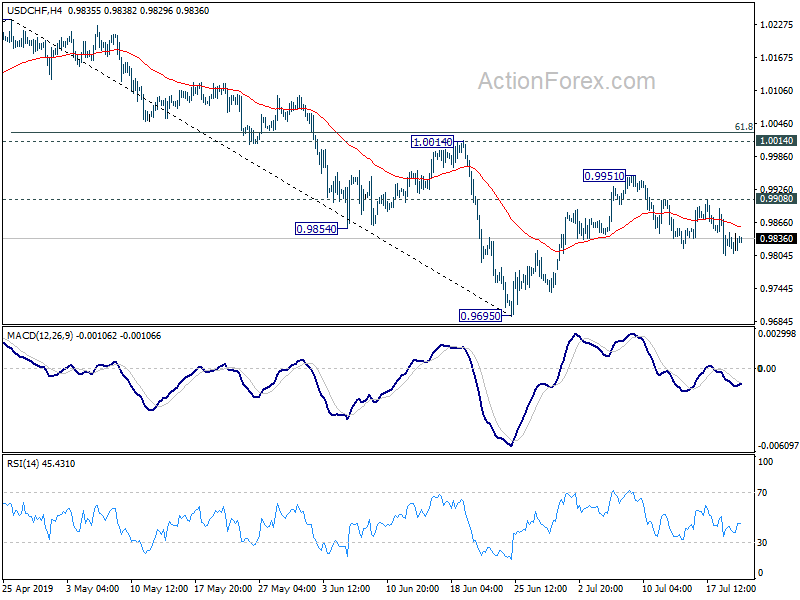
In the bigger picture, up trend from 0.9186 (2018 low) should have completed at 1.0237 already. Deeper decline would be seen to 61.8% retracement of 0.9186 to 1.0237 at 0.9587 and below. For now, USD/CHF is seen as in long term range pattern between 0.9186 and 1.0342. Hence, we'd pay attention to bottoming signal below 0.9587. However, sustained break of 1.0014 will revive medium term bullishness and turn focus back to 1.0237 high.
EUR/USD Daily Outlook
Daily Pivots: (S1) 1.1189; (P) 1.1235; (R1) 1.1268; More...
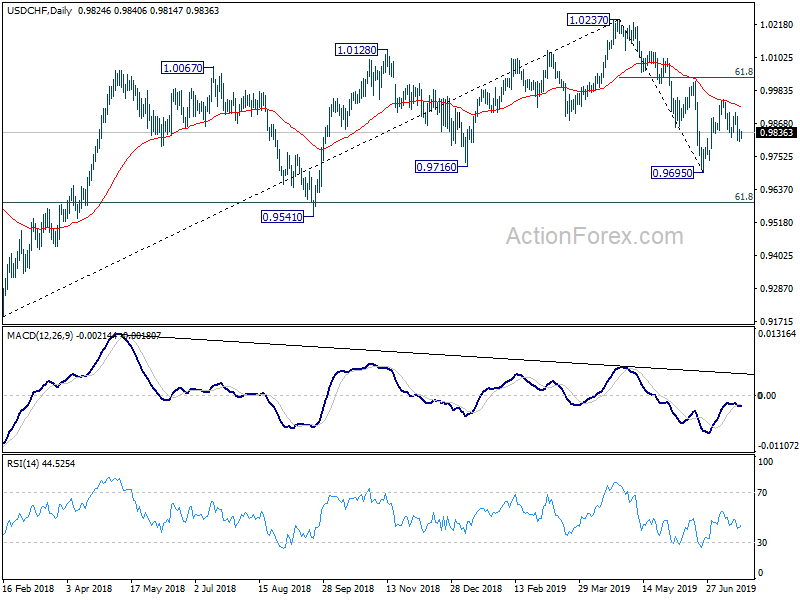
EUR/USD is staying in range of 1.1193/1285 and intraday bias remains neutral for now. On the downside, break of 1.1193 will resume the fall from 1.1412 to retest 1.1107 low. On the upside, above 1.1285 resistance will turn bias back to the upside for 1.1412 resistance.

In the bigger picture, on the one hand, 1.1107 is seen as a medium term bottom on bullish convergence condition in weekly MACD. On the other hand, rejection by 55 week EMA retains medium term bearishness. Outlook stays neutral for now. On the downside, break of 1.1107 will resume the down trend from 1.2555 (2018 high) to 78.6% retracement of 1.0339 to 1.2555 at 1.0813. Meanwhile, break of 1.1412 will resume the rebound to 38.2% retracement of 1.2555 to 1.1107 at 1.1660.
EUR/USD Challenges Key 1.12 Support For Fifth Attempt
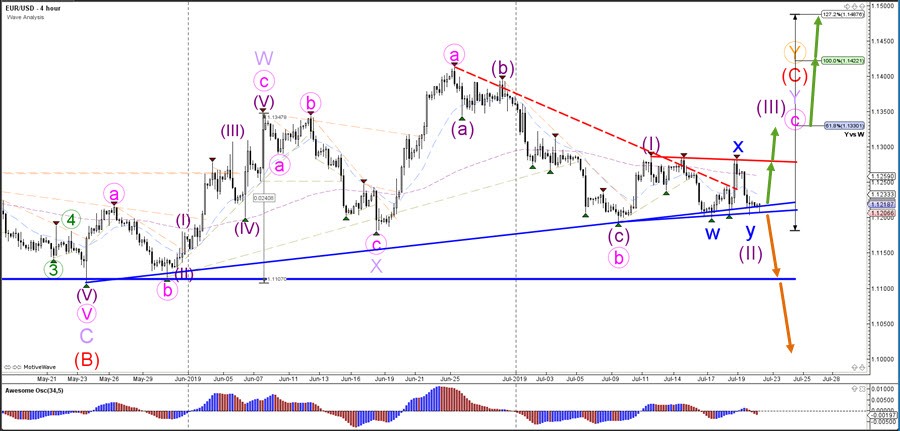
In my view, the EUR/USD still has a better chance of making a bullish bounce at the 1.12 support zone (blue lines). The current wave outlook favor the end of the wave 2 (purple) after a WXY correction (blue). A bullish rally could make a wave 3 (purple) more likely but the real confirmation occurs if price is able to break above the resistance trend line (red). A break below the support lines invalidates the current wave pattern and indicates a potential downtrend towards 1.11 and 1.10.
The EUR/USD seems to be building a small bullish bounce after hitting the support trend line (blue) which could be a first wave 1-2 (blue) of a new direction. The current sideways movement could be explained by a lengthy WXY (blue) correction. A bullish breakout above the resistance trend line (red) could see price move up higher towards the Fibonacci targets of wave 3 vs 1.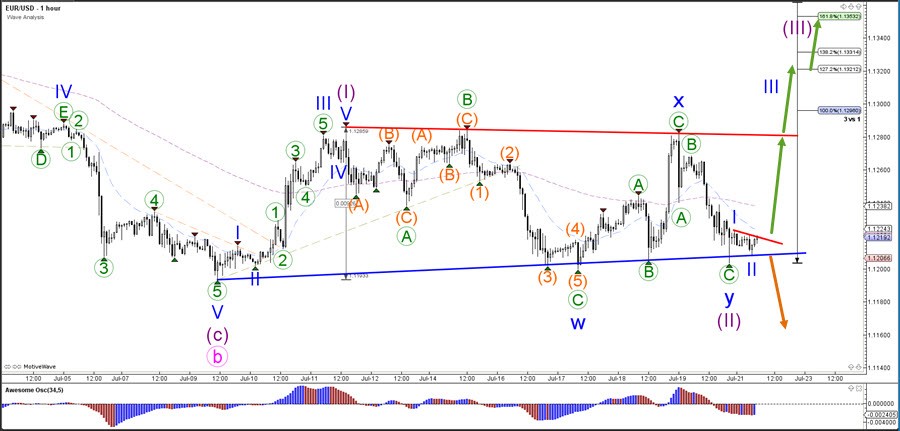
Euro-Zone’s Producer Price Index Rose Less-Than-Expected In June
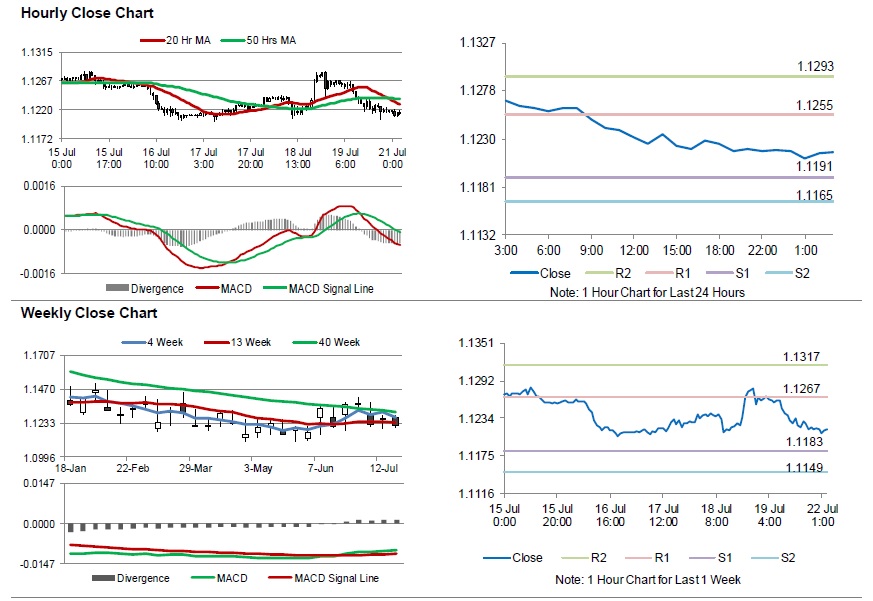
For the 24 hours to 23:00 GMT, the EUR declined 0.32% against the USD and closed at 1.1219 on Friday.
On the data front, Euro-zone's producer price index advanced 1.2% on an annual basis in June, undershooting market expectations for a gain of 1.5%. The index had recorded a climb of 1.9% in the previous month.
In the US, data showed that the flash Reuters/Michigan consumer sentiment index rose to a level of 98.4 in July, less than market anticipations for an increase to a level of 98.8. The index had recorded a level of 98.2 in the preceding month.
In the Asian session, at GMT0300, the pair is trading at 1.1216, with the EUR trading a tad lower against the USD from Friday's close.
The pair is expected to find support at 1.1191, and a fall through could take it to the next support level of 1.1165. The pair is expected to find its first resistance at 1.1255, and a rise through could take it to the next resistance level of 1.1293.
Amid lack of macroeconomic releases in the Euro-zone today, traders would closely monitor the US Chicago Fed National Activity Index for June, slated to release later in the day.
The currency pair is trading below its 20 Hr and 50 Hr moving averages.
UK’s Public Sector Net Borrowing Jumped In June
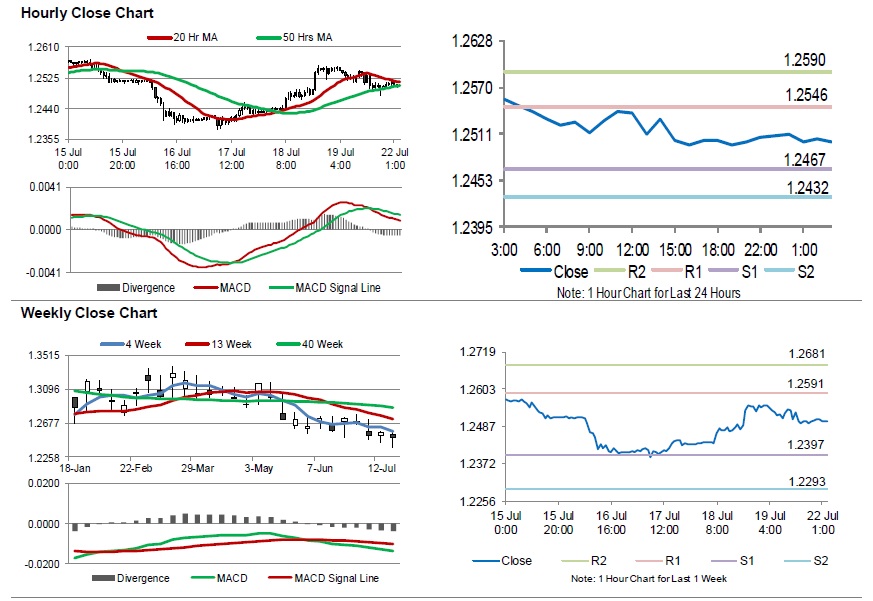
For the 24 hours to 23:00 GMT, the GBP declined 0.26% against the USD and closed at 1.2502 on Friday.
Data indicated that UK's public sector net borrowing rose sharply to £7.2 billion in June, hitting its highest level since June 2015 and compared to a revised level of £4.5 billion.
In the Asian session, at GMT0300, the pair is trading at 1.2502, with the GBP trading flat against the USD from Friday's close.
The pair is expected to find support at 1.2467, and a fall through could take it to the next support level of 1.2432. The pair is expected to find its first resistance at 1.2546, and a rise through could take it to the next resistance level of 1.2590.
In absence of key economic releases in UK today, investor sentiment would be determined by global macroeconomic events.
The currency pair is trading below its 20 Hr moving average and showing convergence with its 50 Hr moving average.
Japanese Yen Rxtends Its Losses In The Morning Session
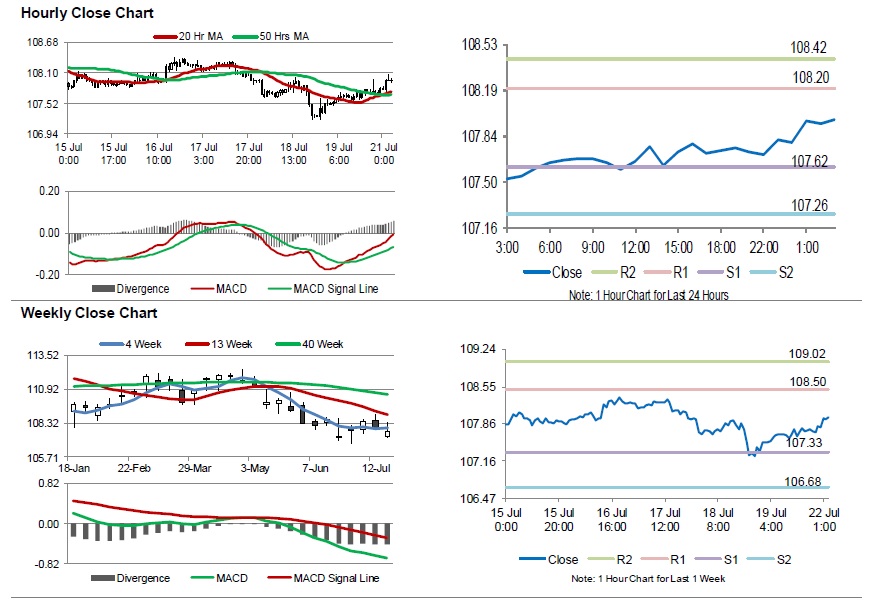
For the 24 hours to 23:00 GMT, the USD rose 0.28% against the JPY and closed at 107.72 on Friday.
In the Asian session, at GMT0300, the pair is trading at 107.97, with the USD trading 0.23% higher against the JPY from Friday’s close.
The pair is expected to find support at 107.62, and a fall through could take it to the next support level of 107.26. The pair is expected to find its first resistance at 108.20, and a rise through could take it to the next resistance level of 108.42.
The currency pair is trading above its 20 Hr and 50 Hr moving averages.
Swiss Franc Reverses Its Gains In The Asian Session
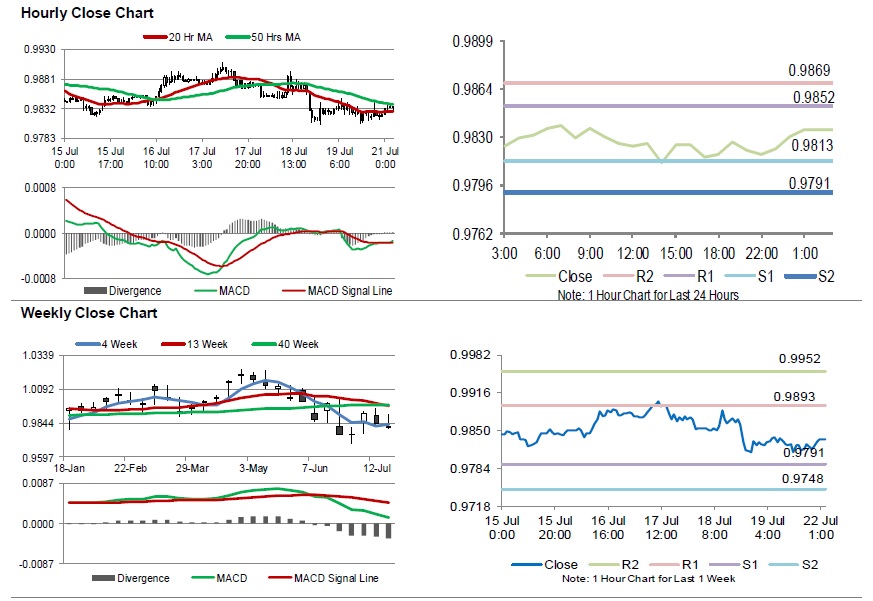
For the 24 hours to 23:00 GMT, the USD declined 0.10% against the CHF and closed at 0.9821 on Friday.
In the Asian session, at GMT0300, the pair is trading at 0.9835, with the USD trading 0.14% higher against the CHF from Friday’s close.
The pair is expected to find support at 0.9813, and a fall through could take it to the next support level of 0.9791. The pair is expected to find its first resistance at 0.9852, and a rise through could take it to the next resistance level of 0.9869.
Trading trend in the Swiss Franc today, is expected to be determined by Switzerland’s M3 money supply for June, scheduled to release in a while.
The currency pair is trading above its 20 Hr moving average and showing convergence with its 50 Hr moving average.
GBP/USD Daily Outlook
Daily Pivots: (S1) 1.2467; (P) 1.2512; (R1) 1.2548; More....
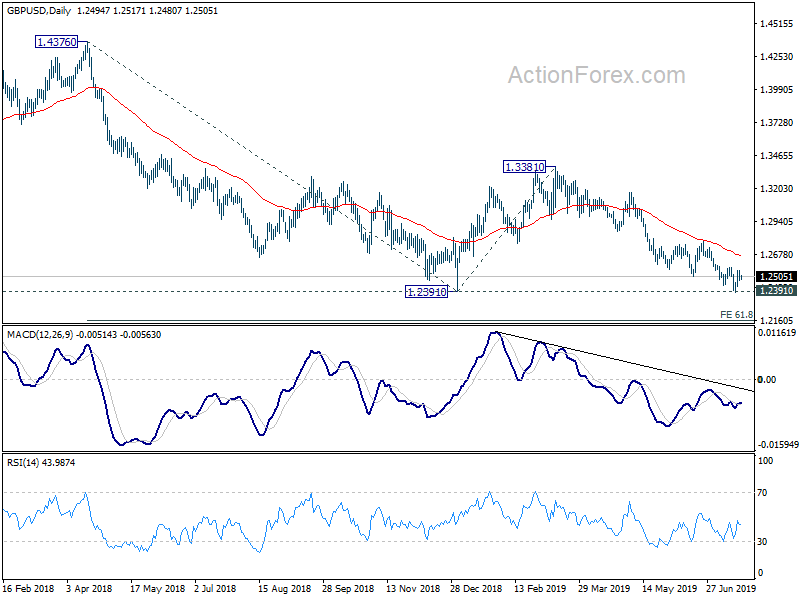
Intraday bias in GBP/USD remains neutral for the moment. Further fall is in favor as long as 1.2579 resistance holds. Sustained break of 1.2391 will resume larger down trend for 61.8% projection of 1.4376 to 1.2391 from 1.3381 at 1.2154 next. Though, break of 1.2579 will indicate short term bottoming and bring stronger rebound back to 1.2783 resistance. In this case, consolidation from 1.2391 would extend with another rise, towards 1.3381 resistance, before completion.
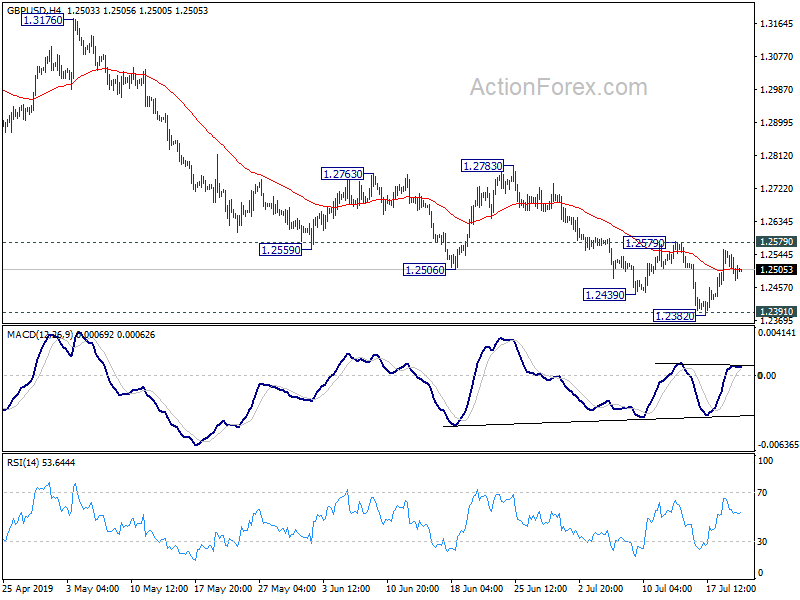
In the bigger picture, down trend from 1.4376 (2018 high) is still in progress. Break of 1.2391 would target a test on 1.1946 long term bottom (2016 low). For now, we don't expect a firm break there yet. Hence, focus will be on bottoming signal as it approaches 1.1946. In any case, medium term outlook will stay bearish as long as 1.3381 resistance holds, in case of strong rebound.
Sterling in Focus in a Light Day, ECB and US GDP ahead
Asian markets are trading generally lower today as another weak starts. Though, weakness in stocks is relatively limited. Expectations on Fed and ECB easing remain generally firm. It looks like a matter of when and how much easing only. In the currency markets, Yen is trading mildly lower, followed by Swiss Franc. New Zealand Dollar is currently the strongest, but Dollar and Sterling are not too far away. The economic calendar is very light today but heavy weight events lie ahead.
Technically, Sterling will be a major focus in the early part of the week, leading up to the announcement of the next UK Conservative leader. GBP/USD has been drawing support from 1.2391 and recovered. A break of 1.2579 minor resistance would indicate short term bullish reversal for stronger rebound ahead. EUR/GBP is also pressing 0.8954 minor support. Firm break there would also indicate short term bearish reversal for deeper decline.
In Asia, currently, Nikkei is down -0.35%. Hong Kong HSI is down -0.75%. China Shanghai SSE is down -0.75%. Singapore Strait Times is down -0.61%. Japan 10-year JGB yield is up 0.0016 at -0.134.
ECB, UK and US GDP ahead
ECB rate decision will be a major focus for the week. Despite recent dovish rhetorics, the central is expected to stand pat first, and set the stage for a September move instead, when new economic forecasts are published. The question is on what ECB would do, an interest cut only, or resuming quantitative easing? Also from Eurozone, PMIs and German Ifo business climate will be watched.
UK politics will also take center stage too. Ballot for UK Conservative Party leader will close today. Results will be announced on Tuesday. Boris Johnson is widely expected to win the race and become the next Prime Minister. The change in UK government then would shape the path to Brexit on October 31.
It's a week of blackout for Fed speakers. Main focus will be on durables goods orders, goods trade balance and most important Q2 GDP in the US. Markets are still pricing in full chance of rate cut on July 31. We'll see, after recent solid data, if another upside surprise in Q2 GDP could prompt a rethink.
Here are some highlights for the week:
- Monday: Bundesbank monthly report; Canada wholesale sales.
- Tuesday: UK CBI industrial order expectations; US house price index, existing home sales.
- Wednesday: New Zealand trade balance; Australia PMIs; Japan PMI manufacturing; Eurozone PMI manufacturing, M3 money supply; UK BBA mortgage approvals; US PMIs, new home sales.
- Thursday: Japan corporate service price index; German Ifo business climate; UK CBI realized sales; ECB rate decision; US durable goods orders, goods trade balance, wholesale inventories, unemployment claims.
- Friday: Tokyo CPI; German import prices; US GDP.
GBP/USD Daily Outlook
Daily Pivots: (S1) 1.2467; (P) 1.2512; (R1) 1.2548; More....
Intraday bias in GBP/USD remains neutral for the moment. Further fall is in favor as long as 1.2579 resistance holds. Sustained break of 1.2391 will resume larger down trend for 61.8% projection of 1.4376 to 1.2391 from 1.3381 at 1.2154 next. Though, break of 1.2579 will indicate short term bottoming and bring stronger rebound back to 1.2783 resistance. In this case, consolidation from 1.2391 would extend with another rise, towards 1.3381 resistance, before completion.
In the bigger picture, down trend from 1.4376 (2018 high) is still in progress. Break of 1.2391 would target a test on 1.1946 long term bottom (2016 low). For now, we don't expect a firm break there yet. Hence, focus will be on bottoming signal as it approaches 1.1946. In any case, medium term outlook will stay bearish as long as 1.3381 resistance holds, in case of strong rebound.
Economic Indicators Update
| GMT | Ccy | Events | Actual | Forecast | Previous | Revised |
|---|---|---|---|---|---|---|
| 12:30 | CAD | Wholesale Trade Sales M/M May | 0.50% | 1.70% |
Canada’s Retail Sales Unexpectedly Eased In May
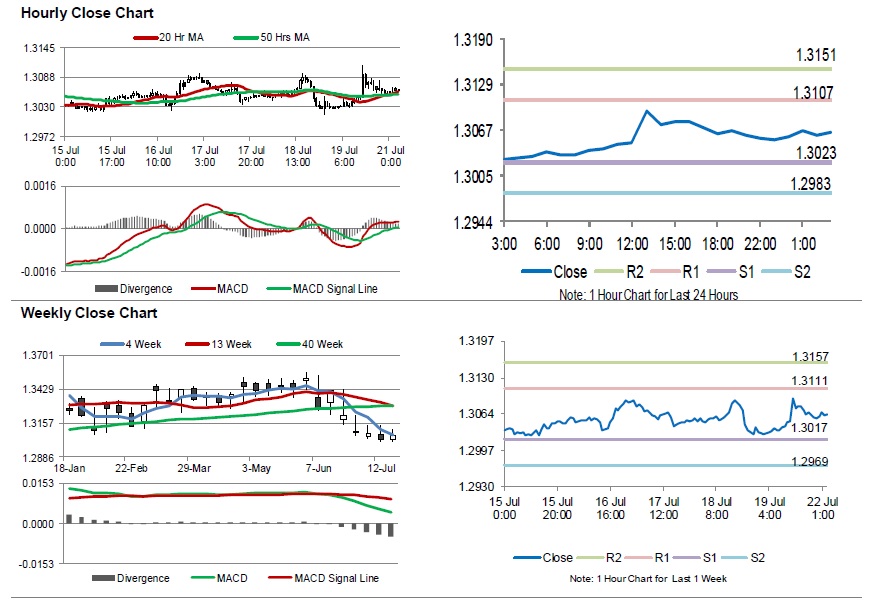
For the 24 hours to 23:00 GMT, the USD rose 0.16% against the CAD and closed at 1.3061 on Friday.
In economic news, Canada's retail sales unexpectedly eased 0.1% on a monthly basis in May, as bad weather conditions affected sales and defying market expectations for a climb of 0.3%. In the prior month, retail sales had recorded a revised rise of 0.2%.
In the Asian session, at GMT0300, the pair is trading at 1.3064, with the USD trading slightly higher against the CAD from Friday's close.
The pair is expected to find support at 1.3023, and a fall through could take it to the next support level of 1.2983. The pair is expected to find its first resistance at 1.3107, and a rise through could take it to the next resistance level of 1.3151.
Amid lack of economic releases in Canada today, traders would focus on global macroeconomic events for further direction.
The currency pair is showing convergence with its 20 Hr moving average and trading above its 50 Hr moving average.