Sample Category Title
USD/CHF Daily Outlook
Daily Pivots: (S1) 0.7876; (P) 0.7910; (R1) 0.7947; More….
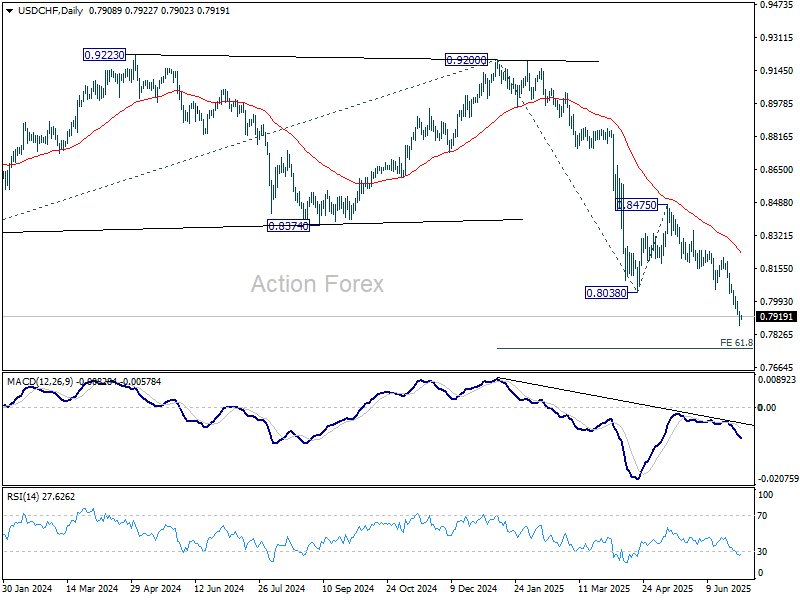
Intraday bias in USD/CHF remains on the downside for 61.8% projection of 0.9200 to 0.8038 from 0.8475 at 0.7757. Firm break there will pave the way to 100% projection at 0.7313 next. On the upside, above 0.7959 minor resistance will turn intraday bias neutral first. But recovery should be limited by 0.8054 support turned resistance to bring another fall.
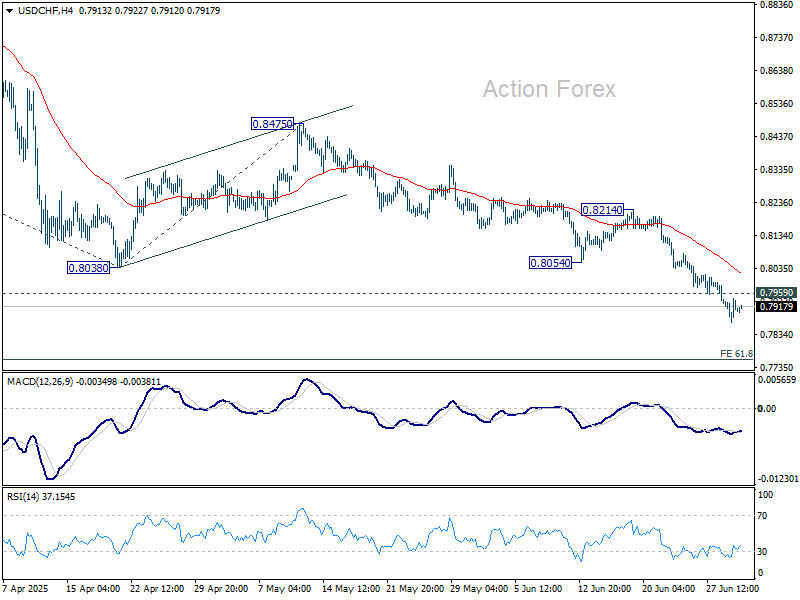
In the bigger picture, long term down trend from 1.0342 (2017 high) is still in progress. Next target is 100% projection of 1.0146 (2022 high) to 0.8332 from 0.9200 at 0.7382. In any case, outlook will stay bearish as long as 0.8475 resistance holds.
USD/CAD Daily Outlook
Daily Pivots: (S1) 1.3603; (P) 1.3635; (R1) 1.3679; More...
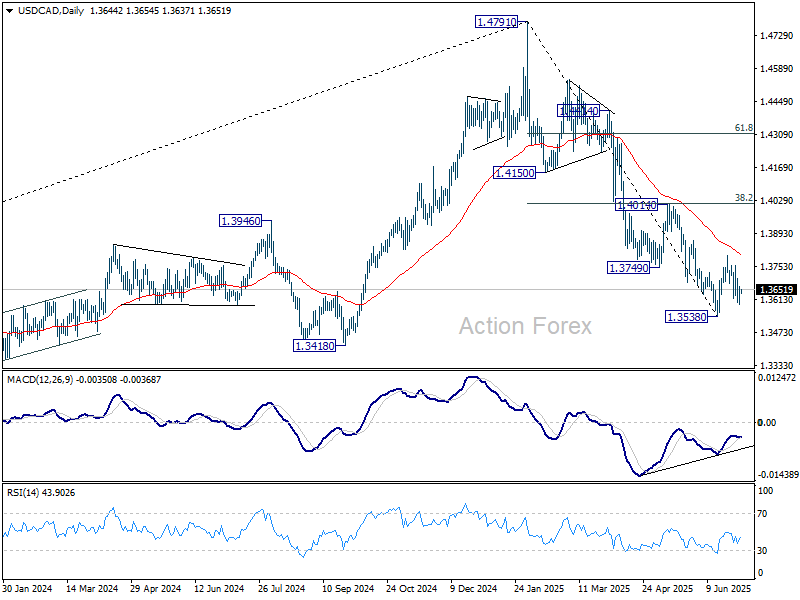
Intraday bias in USD/CAD stays mildly on the downside for retesting 1.3538 low. Firm break there will resume larger decline from 1.4791. For now, risk will stay on the downside as long as 1.3797 resistance holds, in case of recovery.
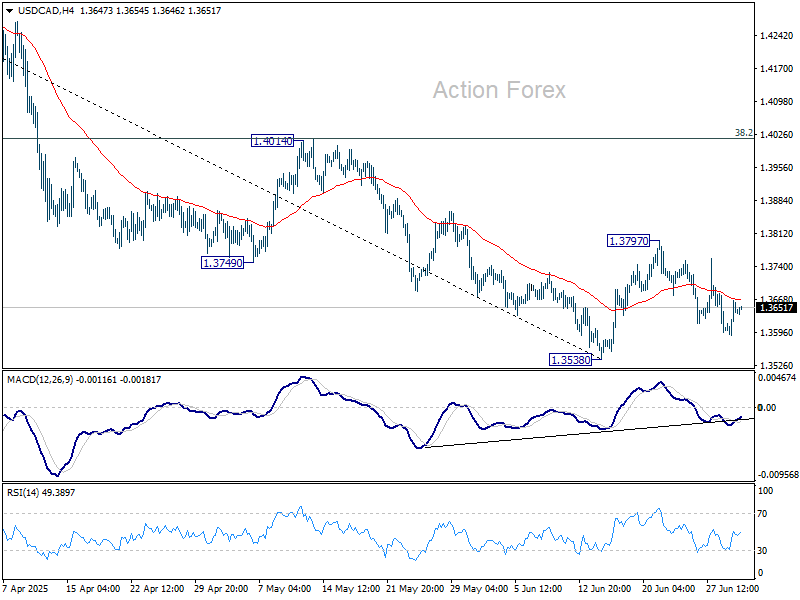
In the bigger picture, price actions from 1.4791 medium term top could either be a correction to rise from 1.2005 (2021 low), or trend reversal. In either case, further decline is expected as long as 1.4014 resistance holds. Next target is 61.8% retracement of 1.2005 (2021 low) to 1.4791 at 1.3069.
AUD/USD Daily Report
Daily Pivots: (S1) 0.6561; (P) 0.6576; (R1) 0.6597; More...
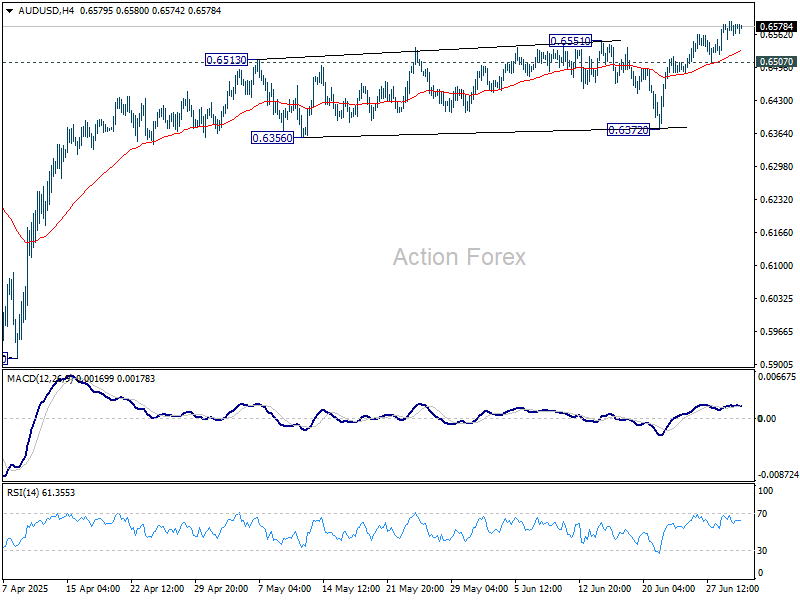
Intraday bias in AUD/USD stays on the upside for the moment. Current rise from 0.5913 should target 0.6713 fibonacci level. On the downside, below 0.6507 will turn intraday bias neutral again. But outlook will remain bullish as long as 0.6372 support holds, in case of retreat.
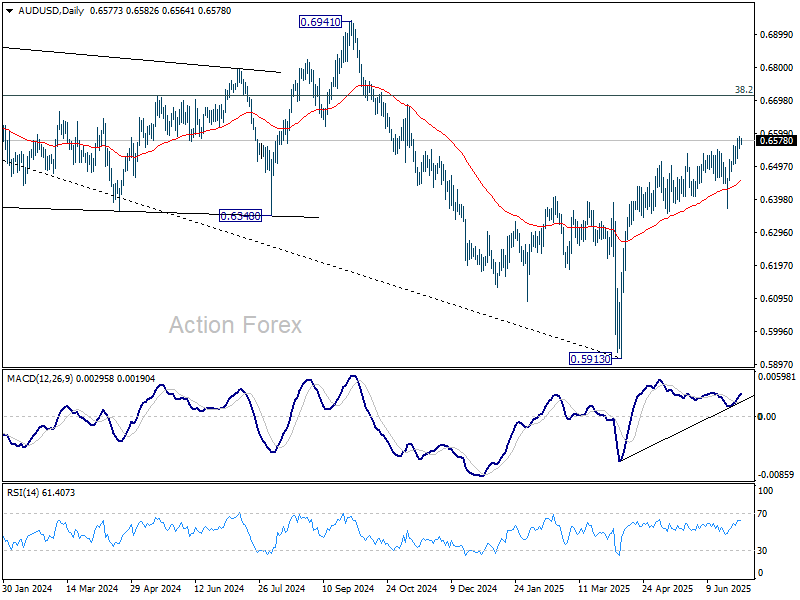
In the bigger picture, there is no clear sign that down trend from 0.8006 (2021 high) has completed. Rebound from 0.5913 is seen as a corrective move. While stronger rally cannot be ruled out, outlook will remain bearish as long as 38.2% retracement of 0.8006 to 0.5913 at 0.6713 holds. Nevertheless, considering bullish convergence condition in W MACD, even in case of another fall through 0.5913, downside should be contained above 0.5506 (2020 low).
Dollar Under Pressure as Political, Policy, and Euro Strength Risks Converge
The calm in today’s Asian forex session belies a volatile backdrop forming beneath the surface. Dollar remains pinned near at bottom of the performance board this week, despite a shallow bounce. Investors are keeping their powder dry ahead of several key catalysts: Thursday's non-farm payrolls report, the looming July 9 tariff truce deadline, and a pivotal House vote on US President Donald Trump’s USD 3.3 trillion tax-and-spending bill. Volatility looks set to rise as these themes come to a head.
So far this week, Swiss Franc is the best-performing major currency, followed by Yen and Euro, suggesting defensive positioning remains intact. Sterling and Loonie trail the field after Dollar, while Aussie and Kiwi sit in middle positions.
The US Senate narrowly passed Trump’s legislation overnight—thanks to a tie-breaking vote from Vice President JD Vance. The measure now faces another battle in the House before July 4, where Republicans hold only a slim majority. Passage would intensify deficit concerns already weighing on Dollar.
Fed Chair Jerome Powell’s remarks at the ECB Forum yesterday were deliberately noncommittal, reiterating that all decisions depend on incoming data. With inflation still running above target and tariff uncertainty unresolved, most FOMC members have signaled reluctance to cut rates in July. Unless labor market weakness becomes more evident, the bar for near-term easing remains high. That puts even more focus on this week’s jobs data as the primary swing factor for Fed policy expectations and Dollar direction.
On the European front, ECB officials have taken the unusual step of pinpointing Euro levels. Vice President Luis de Guindos said that EUR/USD levels above 1.20 could become problematic for inflation. Latvian Governor Kazaks flagged the combined impact of tariffs and a stronger exchange rate as a drag on exports. This shift signals a degree of discomfort with Euro’s 9% rise against Dollar since early April.
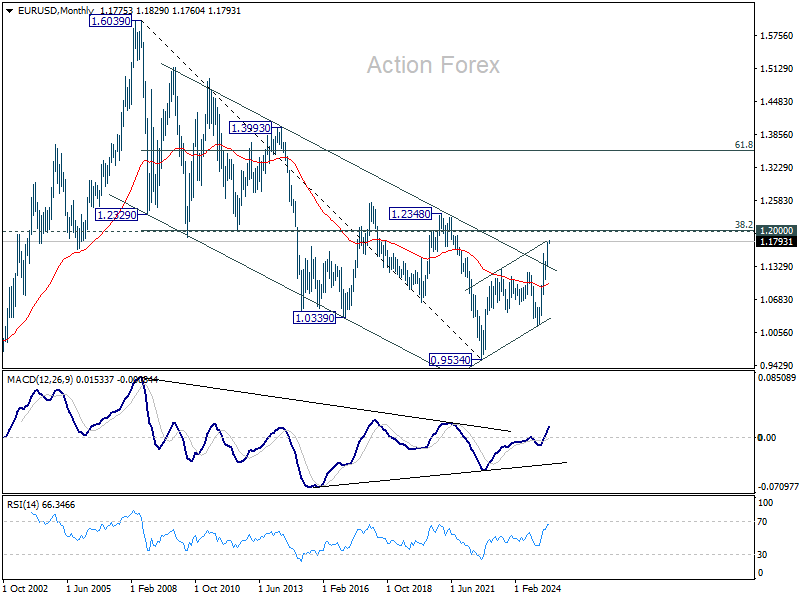
EUR/USD is currently trading around 1.18, still below the informal ECB red line. For now, the pair still has room to run, but traders may begin to tread more carefully as it approaches the 1.2 zone. Technically, that also coincides with a long term fibonacci level, 38.2% retracement of 1.6039 (2008 high) to 0.9534 (2022 low) at 1.2019. EUR/USD's reaction to this level is crucial in determining whether it's just in a medium term corrective pattern from 0.9534. Or it's actually reversing the down trend that lasted more than a decade and a half.
In Asia, at the time of writing, Nikkei is down -0.33%. Hong Kong HSI is up 0.74%. China Shanghai SSE is up 0.05%. Singapore Strait Times is up 0.46%. Japan 10-year JGB yield is up 0.04 at 1.432. Overnight, DOW rose 0.91%. S&P 500 fell -0.11%. NASDAQ fell -0.82%. 10-year yield rose 0.021 to 4.251.
Looking ahead, Eurozone unemployment rate is the only feature in European session. Later in the day, US ADP employment will offer a prelude to tomorrow's non-farm payrolls.
Aussie retail sales underwhelm with 0.2% mom growth in May
Australia’s retail sales rose just 0.2% mom in May, falling short of expectations for a 0.3% rise. The modest increase was largely due to a rebound in clothing purchases, while spending on food fell and household goods remained flat.
Robert Ewing, ABS head of business statistics, noted that aside from the lift in clothing, retail spending was generally "restrained".
He also noted that this dataset is nearing its conclusion, with July’s release set to be the last edition of Retail Trade. Going forward, the Monthly Household Spending Indicator (MHSI), which leverages administrative data, will replace it as a more comprehensive tool for tracking household consumption trends.
AUD/USD Daily Report
Daily Pivots: (S1) 0.6561; (P) 0.6576; (R1) 0.6597; More...
Intraday bias in AUD/USD stays on the upside for the moment. Current rise from 0.5913 should target 0.6713 fibonacci level. On the downside, below 0.6507 will turn intraday bias neutral again. But outlook will remain bullish as long as 0.6372 support holds, in case of retreat.
In the bigger picture, there is no clear sign that down trend from 0.8006 (2021 high) has completed. Rebound from 0.5913 is seen as a corrective move. While stronger rally cannot be ruled out, outlook will remain bearish as long as 38.2% retracement of 0.8006 to 0.5913 at 0.6713 holds. Nevertheless, considering bullish convergence condition in W MACD, even in case of another fall through 0.5913, downside should be contained above 0.5506 (2020 low).
Elliott Wave Outlook: Gold (XAUUSD) Signals Bullish Trend Resumption
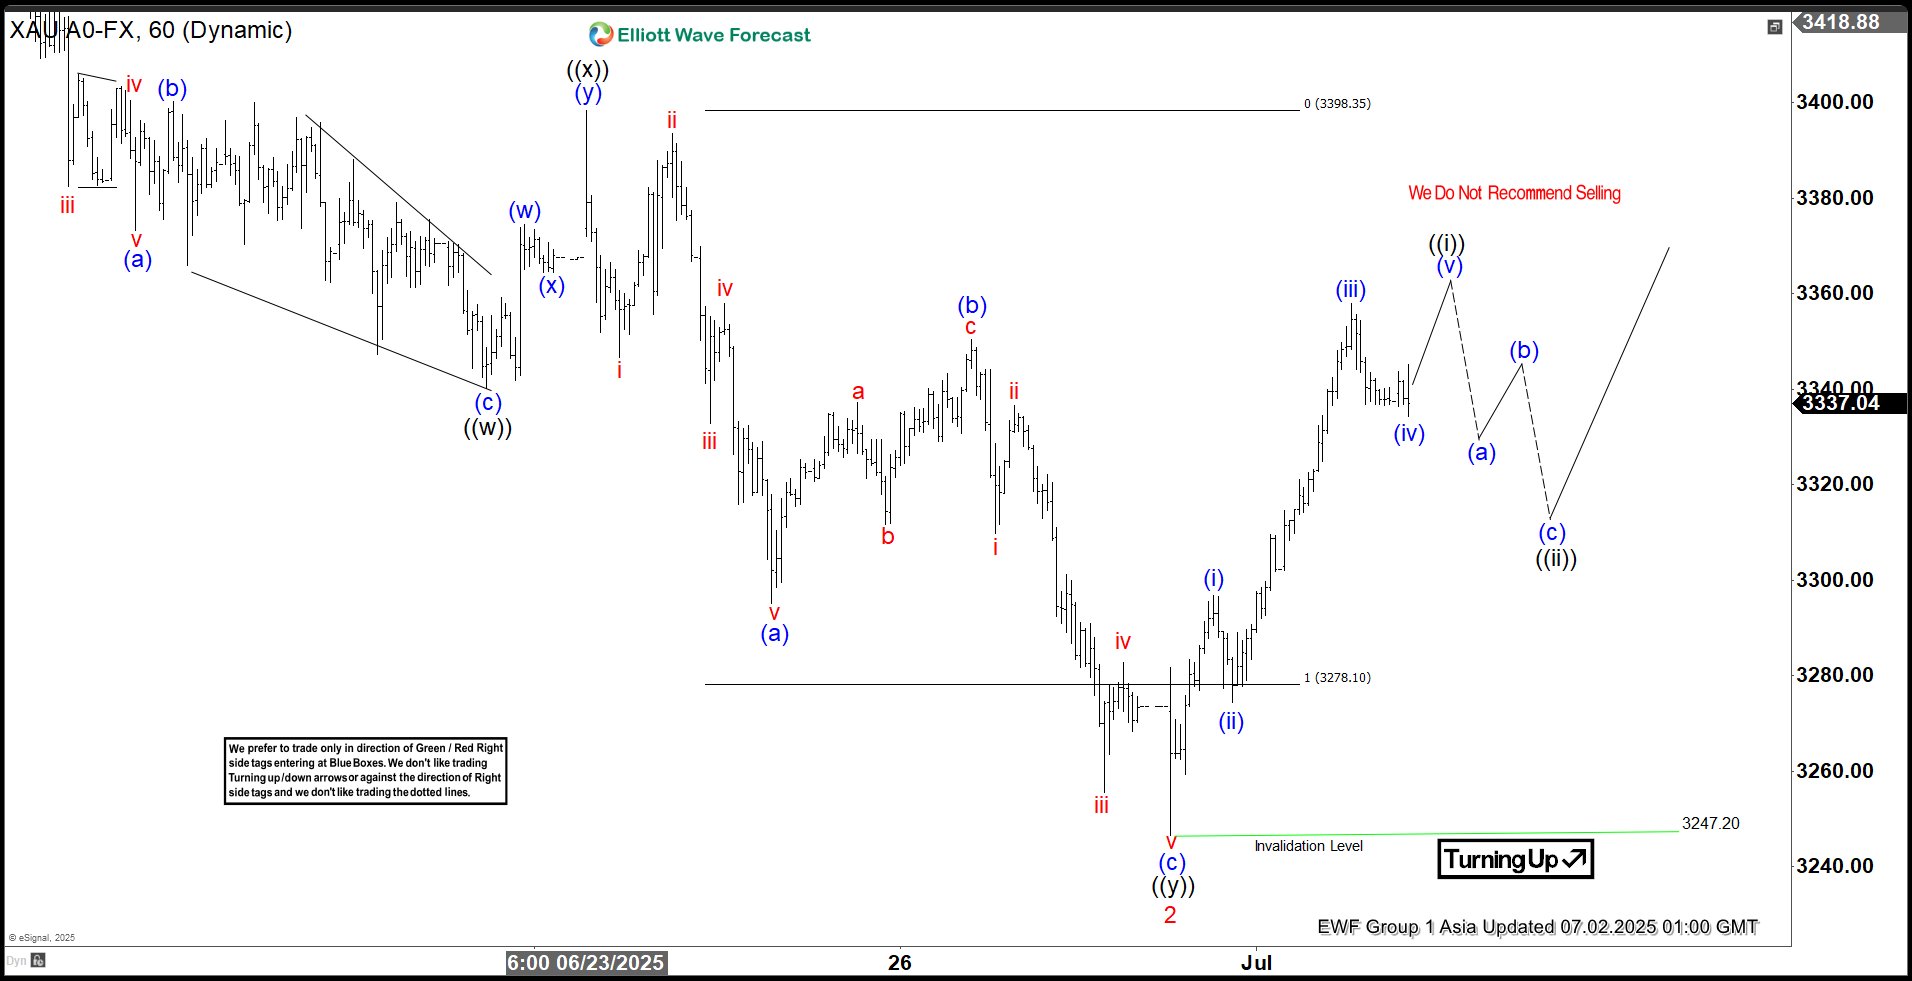
Gold (XAUUSD) has exhibited a robust rally since its low on May 15, 2025. The metal formed a five-swing motive sequence that culminated in wave 1 at 3452.50 on June 16, 2025. This five-swing structure, characteristic of an impulsive Elliott Wave pattern, signals potential for further upside. The subsequent pullback in wave 2 appears to have completed at 3246.15, as illustrated in the accompanying 1-hour chart. The internal structure of wave 2 unfolded as a double-three Elliott Wave corrective pattern. Specifically, from the wave 1 peak, wave ((w)) declined to 3340.18. A corrective rally in wave ((x)) followed to 3398.35. The final leg, wave ((y)), concluded at 3246.15, marking the completion of wave 2 in the higher-degree structure.
Gold has since resumed its upward trajectory in wave 3. However, to confirm the bullish outlook and eliminate the possibility of a double correction, the price must decisively break above the wave 1 high at 3452.50. From the wave 2 low, wave (i) advanced to 3296.85. A shallow pullback in wave (ii) followed to 3274.41. Wave (iii) then propelled the metal to 3358.02. Based on the current structure, gold is expected to rally further in wave (v) to complete wave ((i)). Subsequently, a corrective pullback in wave ((ii)), likely unfolding in a 3, 7, or 11-swing structure, is anticipated from the June 30 low before the metal resumes its upward trend. In the near term, as long as the pivot low at 3246.15 remains intact, gold is poised to extend higher, supported by the impulsive momentum of the ongoing wave 3.
Gold 60-Minute Elliott Wave Technical Chart
Gold (XAUUSD) Elliott Wave Technical Video
https://www.youtube.com/watch?v=BouN3edyruM
Ethereum Defends Key Support — But Breakout Faces Major Obstacles
Key Highlights
- Ethereum is facing heavy resistance near the $2,550 and $2,650 levels.
- ETH is still above a key bullish trend line with support at $2,300 on the daily chart.
- Bitcoin price failed to extend gains above the $108,800 resistance.
- XRP rallied toward the $2.35 resistance before trimming some gains.
Ethereum Technical Analysis
Ethereum failed to settle above $2,800 and corrected gains. ETH declined below the $2,720 and $2,500 support levels before the bulls emerged.
Looking at the daily chart, the price dived toward the $2,120 support and the 50% Fib retracement level of the upward move from the $1,379 swing low to the $2,876 high. The bulls also defended the 100-day simple moving average (red).
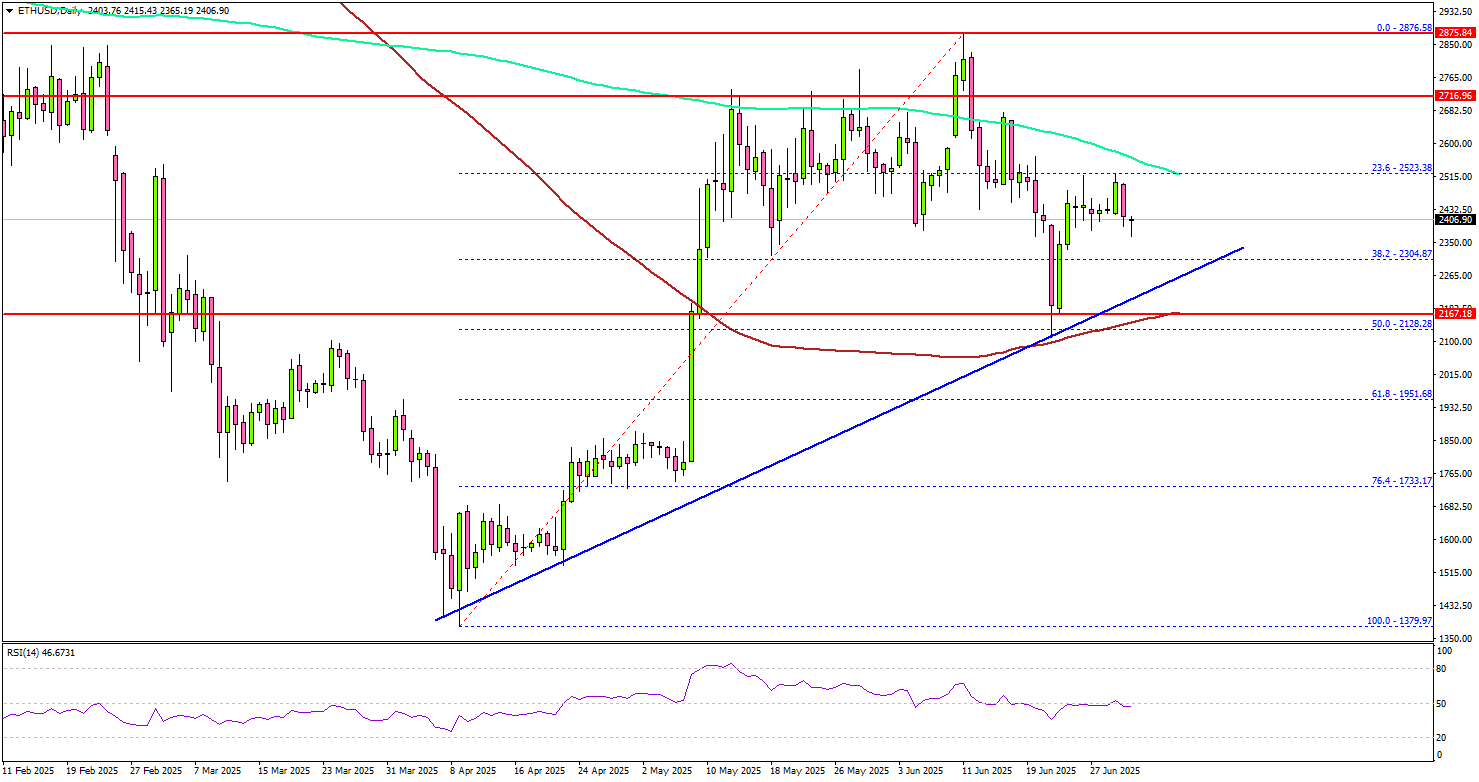
Besides, ETH is above a key bullish trend line with support at $2,300 on the same chart. On the upside, the price is facing hurdles near the 200-day simple moving average (green) and $2,550.
The next major resistance is near the $2,650 level. A daily close above the $2,650 resistance zone could start another steady increase. In the stated case, the price may perhaps rise toward the $2,880 level. The next stop for the bulls may perhaps be $3,000.
On the downside, Ethereum might find support near the $2,300 level and the trend line. The next major support is $2,120, below which the price could slide toward $2,000. Any more losses might call for a move toward the $1,740 level or the 76.4% Fib retracement level of the upward move from the $1,379 swing low to the $2,876 high.
Looking at Bitcoin, there was a steady increase above the $105,000 level but the bulls struggled to keep the price above the $108,500 level.
Economic Releases
- ECB's President Lagarde speech.
- US ADP Employment Change for June 2025 - Forecast 95K, versus 37K previous.
Aussie retail sales underwhelm with 0.2% mom growth in May
Australia’s retail sales rose just 0.2% mom in May, falling short of expectations for a 0.3% rise. The modest increase was largely due to a rebound in clothing purchases, while spending on food fell and household goods remained flat.
Robert Ewing, ABS head of business statistics, noted that aside from the lift in clothing, retail spending was generally "restrained".
He also noted that this dataset is nearing its conclusion, with July’s release set to be the last edition of Retail Trade. Going forward, the Monthly Household Spending Indicator (MHSI), which leverages administrative data, will replace it as a more comprehensive tool for tracking household consumption trends.

Dow Leads US Indices on Strong Manufacturing PMI Beat
The Dow is outperforming all major U.S. indices, fueled by a stronger-than-expected U.S. Manufacturing PMI report in today's session. The data, released at 10:00 ET, came in at 52.9 versus the forecasted 52, signaling not just expansion, but some form of resilience in the sector.
S&P Global’s Chief Business Economist commented:
“June saw a welcome return to growth for U.S. manufacturing production after three months of decline, with higher workloads driven by rising orders from domestic and export customers. Reviving demand has also encouraged factories to hire additional staff at a rate not seen since September 2022.”
This uptick in manufacturing momentum suggests that the feared economic damage from tariffs may have been overstated, though price pressures remain very real.
The latest JOLTS report, which showed continued labor market strength, added to the bullish tone. As a result, market sentiment improved, with the Healthcare and Consumer Defensive sectors leading gains, while names like NVIDIA and Tesla continue to feel pressure from ongoing political scrutiny.
As cyclical sectors outshine tech, the Dow Jones has taken the lead among U.S. indices, currently up 1% on the session.
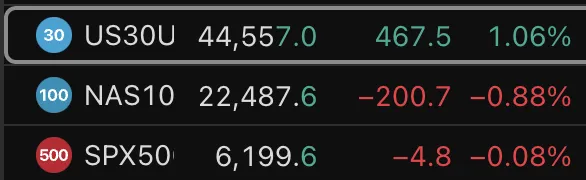
US Indices CFD performance, July 1, 2025 – Source: TradingView
Dow Jones Daily Chart
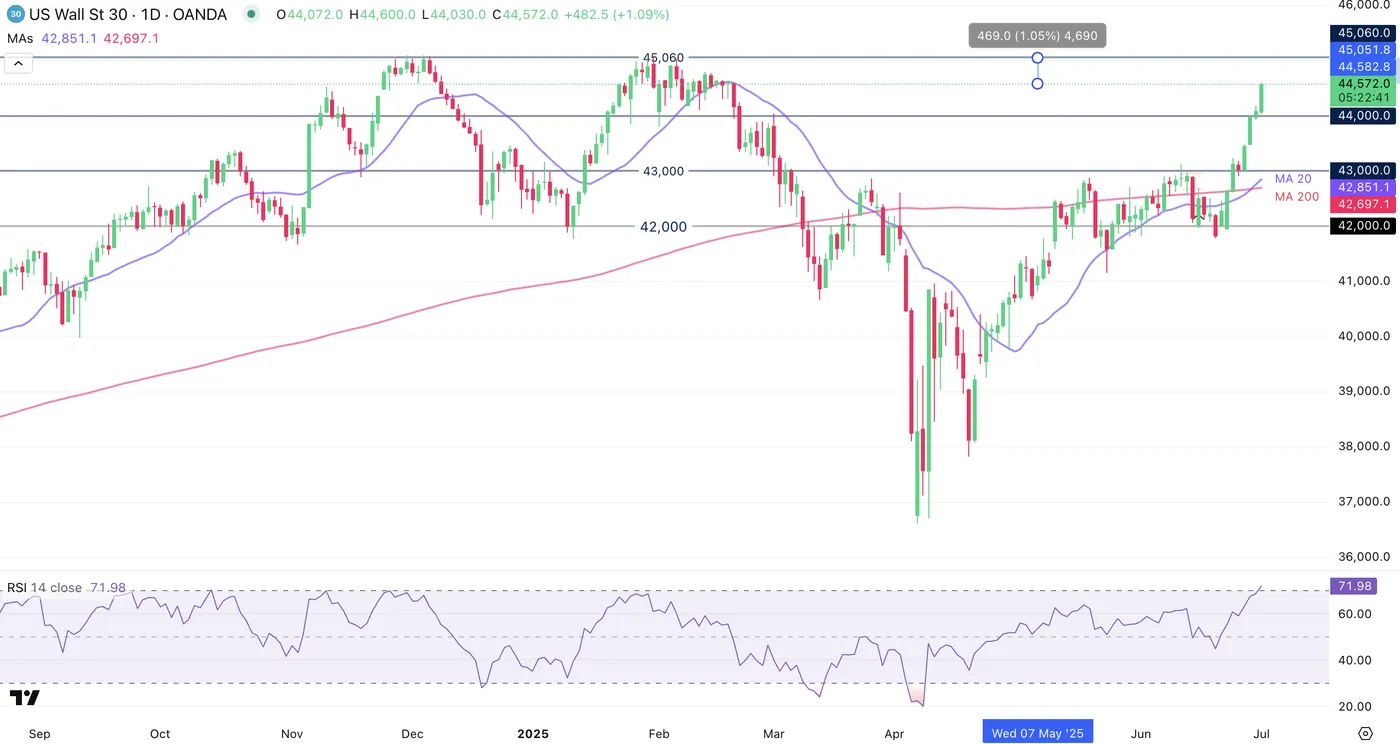
Dow Jones Daily Chart, July 1, 2025 – Source: TradingView
The Dow Jones is the only major US index to not have surpassed its all-time highs, and current data and flows are supporting the advent of new ATH in the US 30.
The Dow is on its 7th consecutive bullish candle, powering through the 44,000 level and heading towards 45,000 which may just happen as long as the mood keeps turning more positive.
As a reminder, the All-time highs on the US 30 CFD is at 45,060, close to 1% away from current trading.
The Daily MA 20 is just crossing above the 200 MA, another sign of strength for bulls that are taking control of equity markets again – RSI is in overbought territory however, but won't change much until buyers actually start slowing down.
Dow Jones 1H Chart
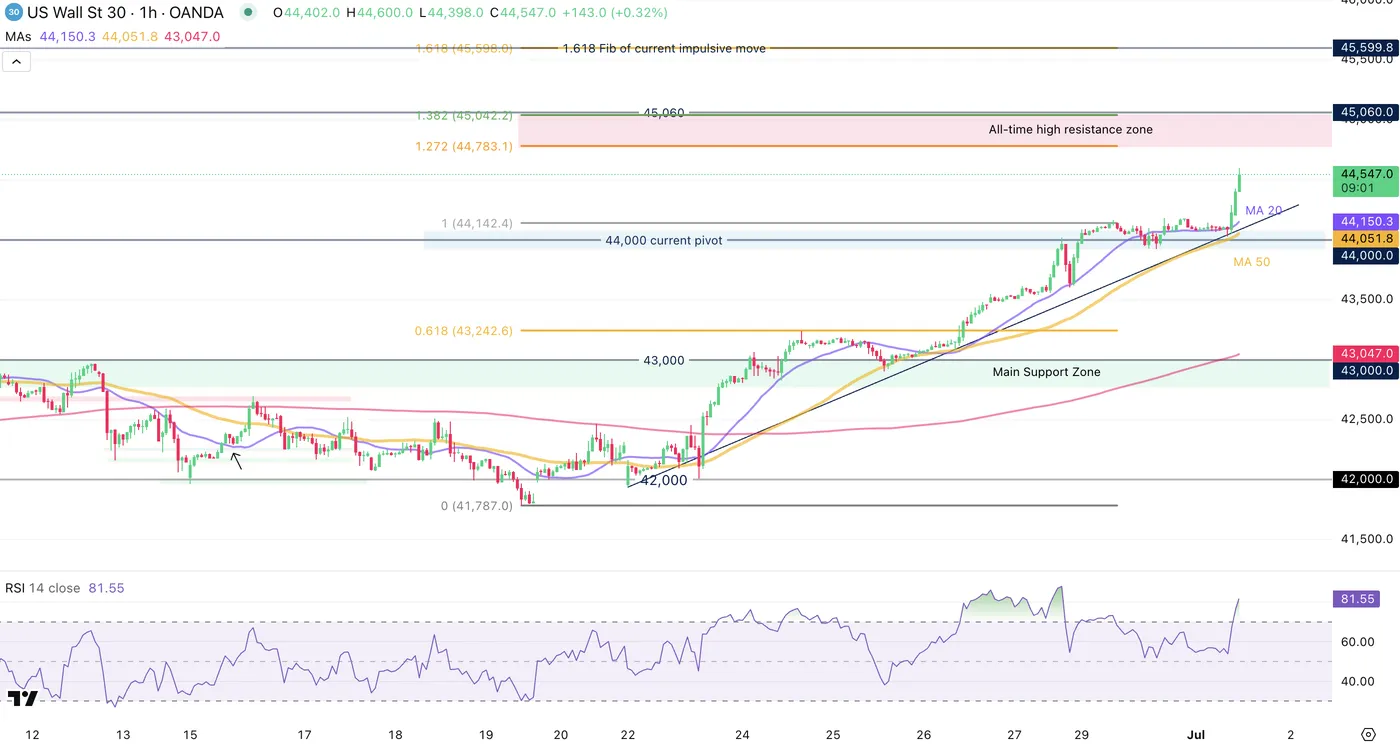
Dow Jones 1H Chart, July 1, 2025 – Source: TradingView
The uptrend is intact particularly with strong momentum – RSI retracts only to the neutral zone before heading higher on impulsive bull moves, a sign of a stable trend, further supported by upward sloping Moving averages.
1H Charts are currently showing overbought and signs of momentum somehow slowing, however as long as there is no clear correction in prices, the continuing the uptrend stays the most probable path.
Some levels to look for in current trading for the index:
Resistance Zones
- 44,600 Daily Highs to surpass
- 44,900 to 45,060 ATH Resistance Zone
- 45,600 potential resistance from Fibonacci Extensions
Support Zones
- 44,000 current pivot (+/- 100 points)
- 43,500 psychological level
- 43,000 Main Support Zone in confluence with 1H MA 200
Safe Trades!
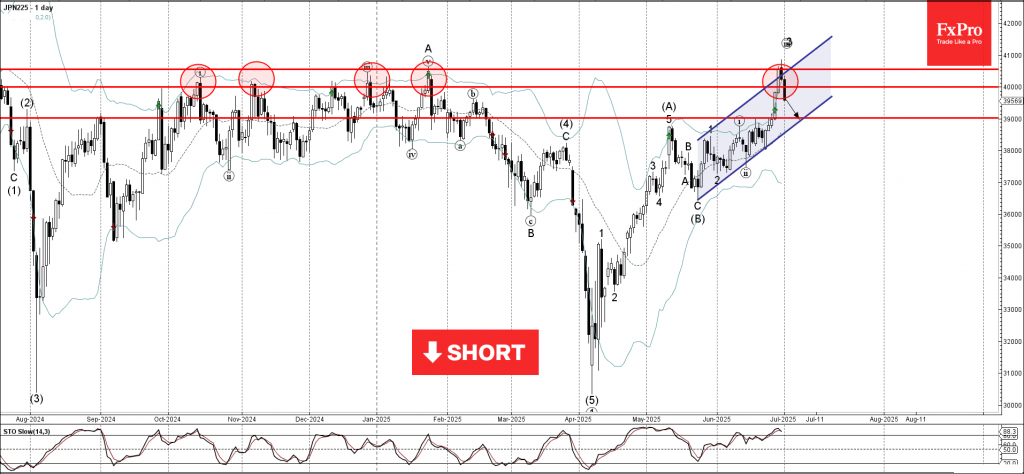
Nikkei 225 Wave Analysis
Nikkei 225: ⬇️ Sell
- Nikkei 225 reversed from resistance zone
- Likely to fall to support level 39000.00
Nikkei 225 index recently reversed down with the Evening Star from the resistance zone between the resistance levels 40000.00 and 40550.00 (former multi month high from January).
This resistance zone was strengthened by the upper daily Bollinger Band and by the resistance trendline of the daily up channel from May.
Given the strength of the aforementioned resistance zone and the overbought daily Stochastic, Nikkei 225 index can be expected to fall to the next support level 39000.00.
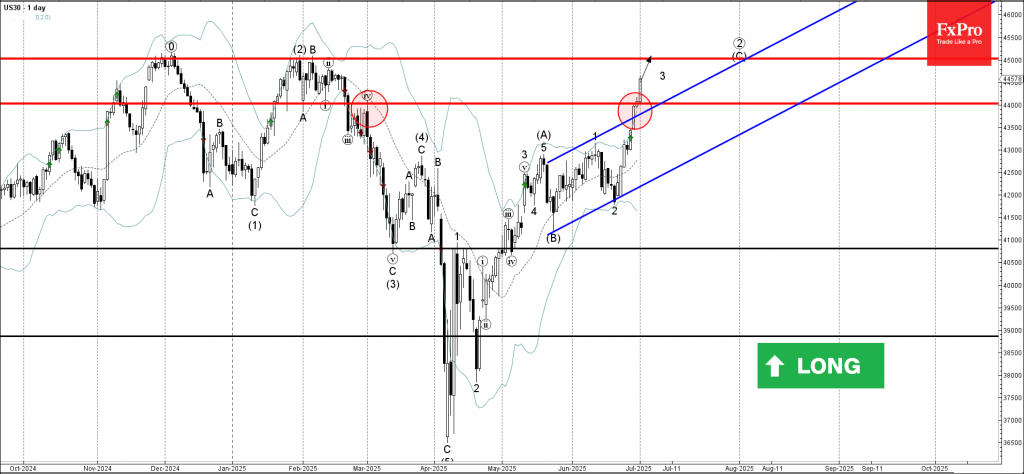
Dow Jones Wave Analysis
Dow Jones: ⬆️ Buy
- Dow Jones broke the resistance zone
- Likely to rise to resistance level 45000.00
Dow Jones index recently broke the resistance zone located at the intersection of the resistance level 44000.00 (former top of wave iv from March) and the resistance trendline of the daily up channel from May.
The breakout of this resistance zone accelerated the active impulse wave (3) – which is part of the multi-month upward ABC correction 2 from April.
Dow Jones index can be expected to rise to the next resistance level 45000.00 (target price for the completion of the active impulse wave (C)).