Sample Category Title
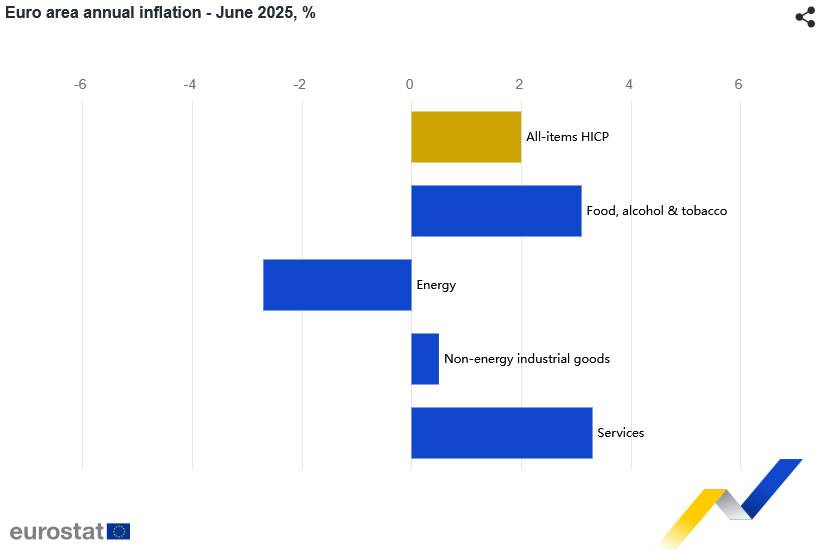
Eurozone CPI rises to 2%, core steady at 2.3% in June
Eurozone headline CPI rose from 1.9% yoy to 2.0% yoy, in line with expectations. Core inflation (ex energy, food, alcohol & tobacco) held steady at 2.3% yoy.
The largest inflationary driver came from the services sector, where prices rose 3.3% annually, up from 3.2% in May. Food, alcohol, and tobacco also contributed, albeit slightly less than before, with prices up 3.1% compared to 3.2% the previous month.
Non-energy industrial goods inflation softened to 0.5% from 0.6%, while energy prices continued to fall, though at a slower pace, down -2.7% compared to May’s -3.6%.
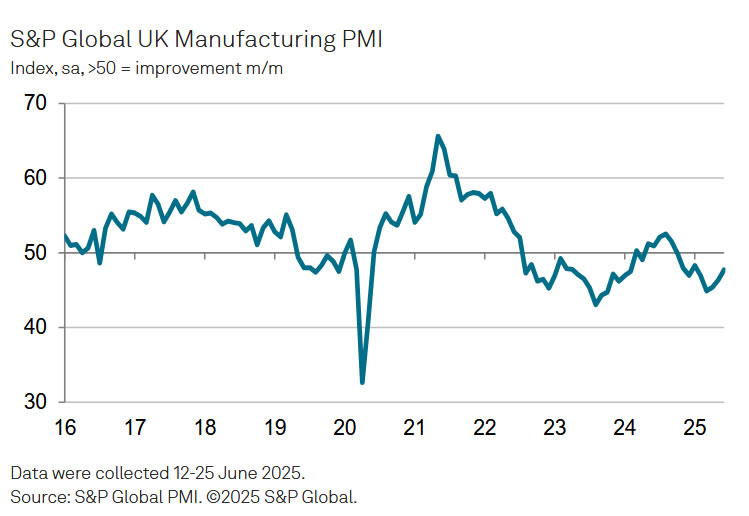
UK PMI manufacturing finalized at 47.7, improving outlook still fragile
The UK manufacturing sector showed tentative "signs of stabilization" in June, with PMI Manufacturing index finalized at 47.7, its highest in five months.
While the reading remains in contractionary territory, the pace of decline in production, new orders, and employment all slowed. Business optimism improved to a four-month high, and the orders-to-inventory ratio — a key forward-looking indicator — surged to its strongest level since August 2024, raising hopes of a potential rebound in output.
Rob Dobson, Director at S&P Global Market Intelligence, noted that inflationary pressures are also easing, with both input costs and selling prices rising at slower rates. However, he warned that any recovery remains vulnerable to multiple external risks. These include ongoing geopolitical tensions, global demand weakness, tariff-related uncertainties, and domestic political shifts.
ECB officials at Sintra keep slight dovish bias as easing cycle nears end
At the ECB’s annual forum in Sintra, policymakers reinforced that it's is nearing the end of its easing cycle, even though further rate cut cannot be ruled out.
Chief Economist Philip Lane emphasized that the “last cycle” of battling post-pandemic inflation is over, having brought price growth down from 10% to near the 2% target. Still, he clarified that being “done” with the previous cycle does not rule out additional moves if circumstances change, particularly as the eurozone faces lingering uncertainty from global trade tensions and weak growth.
Belgian central bank chief Pierre Wunsch echoed the sentiment, saying the “job is mostly done” on inflation but that risks are now tilted to the downside. Wunsch added that "“if we have to move more it probably will be to the downside, a further cut."
Latvian central banker Martins Kazaks added that any future moves would likely be small and designed as fine-tuning or “insurance cuts.” He cited Euro’s recent appreciation as a potential drag on inflation and exports, reinforcing the case for a cautious bias toward easing.
Vice President Luis de Guindos said that while the current EUR/USD exchange rate—hovering near 1.17—is not concerning, a rapid move beyond 1.20 would begin to pose challenges for inflation and competitiveness. "But 1.20 is perfectly acceptable."
Lithuania’s Gediminas Šimkus also leaned dovish, stating that any next move would “be down,” though he remained cautious about timing. He said September might be too early to decide. Simkus added: "I believe a move, if any, is more likely towards the end of the year."
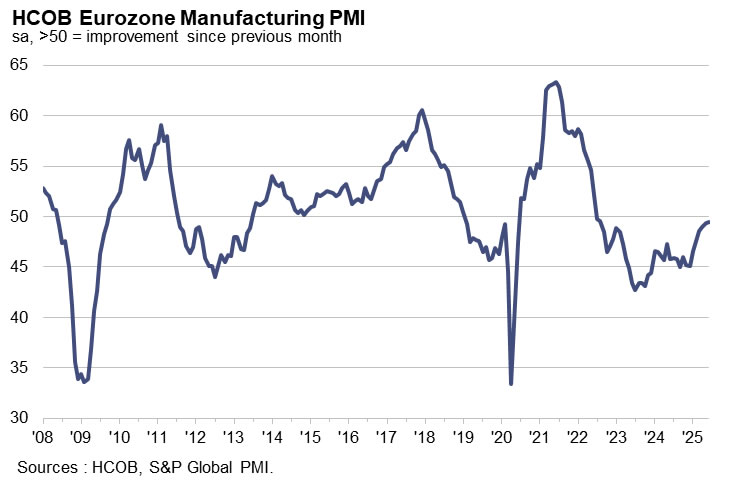
Eurozone PMI manufacturing finalized at 49.5, divergences persist
Eurozone Manufacturing PMI was finalized at 49.5 in June, up slightly from 49.4 in May and marking the highest level in nearly three years. The data reflects gradual stabilization across the bloc’s industrial base, with output expanding for the fourth straight month and new orders showing signs of bottoming out. However, the headline figure remains below the 50-mark, signaling the sector is still technically in contraction.
Among individual economies, Ireland (53.7), Greece (53.1), Spain (51.4), and the Netherlands (51.2) led the pack with readings in expansion territory. In contrast, France (48.1), Italy (48.4), and Austria (47.0) continued to weigh on the region, posting multi-month lows. Germany, the bloc’s industrial engine, came in at 49.0—its best level in 34 months, but still shy of expansion.
Hamburg Commercial Bank’s Cyrus de la Rubia noted that longer delivery times and a stabilization in order books are early signs of a pickup in demand, despite ongoing macro risks from tariffs, the Middle East, and Ukraine. He added that if Germany returns to growth—helped by fiscal support from the new coalition—France, Italy, and Austria could follow, given their strong trade ties.
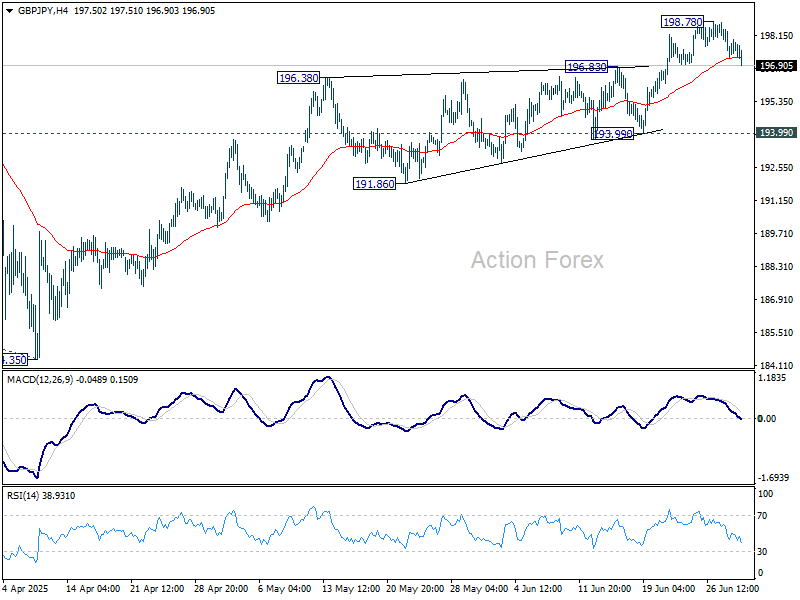
GBP/JPY Daily Outlook
Daily Pivots: (S1) 197.20; (P) 197.84; (R1) 198.46; More...
Intraday bias in GBP/JPY remains neutral, and some more consolidations would be seen first. Near term outlook will stay bullish as long as 193.99 support holds. Above 198.78 will resume the rise from 184.35 to 199.79 resistance. Break there will target 100% projection of 180.00 to 199.79 from 184.35 at 204.14.
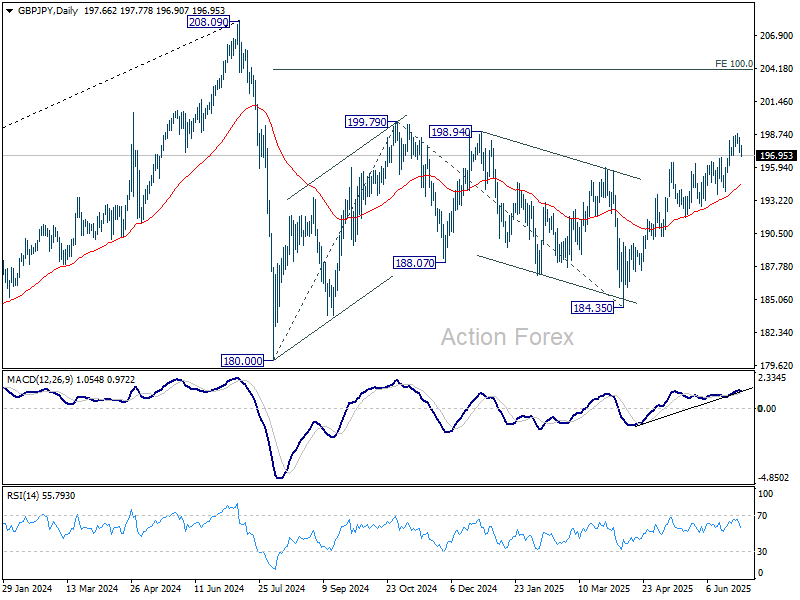
In the bigger picture, price actions from 208.09 are seen as a correction to rally from 123.94 (2020 low). Strong support should be seen from 38.2% retracement of 123.94 to 208.09 at 175.94 to contain downside. However, sustained break of 175.94 will bring deeper fall even still as a correction.
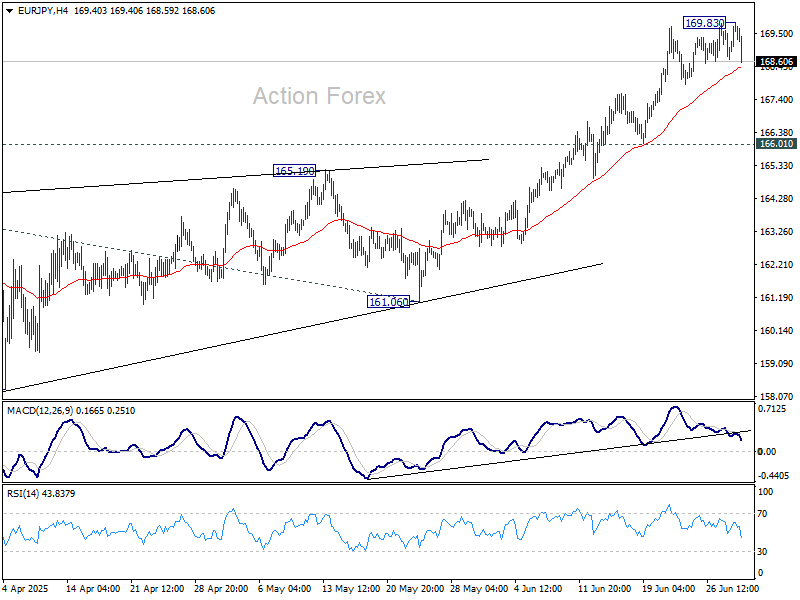
EUR/JPY Daily Outlook
Daily Pivots: (S1) 169.02; (P) 169.44; (R1) 170.19; More...
Intraday bias in EUR/JPY remains neutral first, and more consolidations could be seen. Downside should be contained well above 166.01 support to bring another rally. Above 169.83 will resume the rise from 154.77 to 100% projection of 154.77 to 164.16 from 161.06 at 170.45. Break there will target 138.2% projection at 174.03.
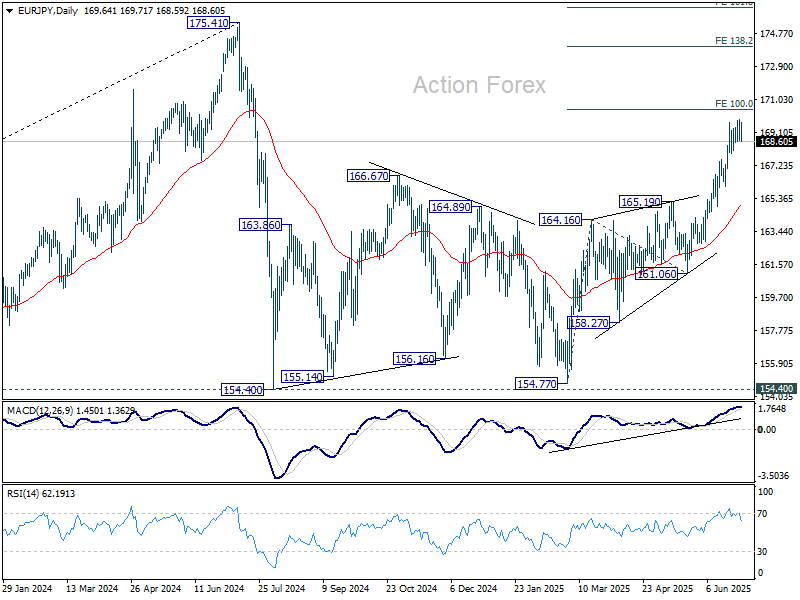
In the bigger picture, price actions from 175.41 are seen as correction to up trend from 114.42 (2020 low). Strong support should be seen from 38.2% retracement of 114.42 to 175.41 at 152.11 to contain downside. However, sustained break of 152.11 will bring deeper fall even still as a correction.
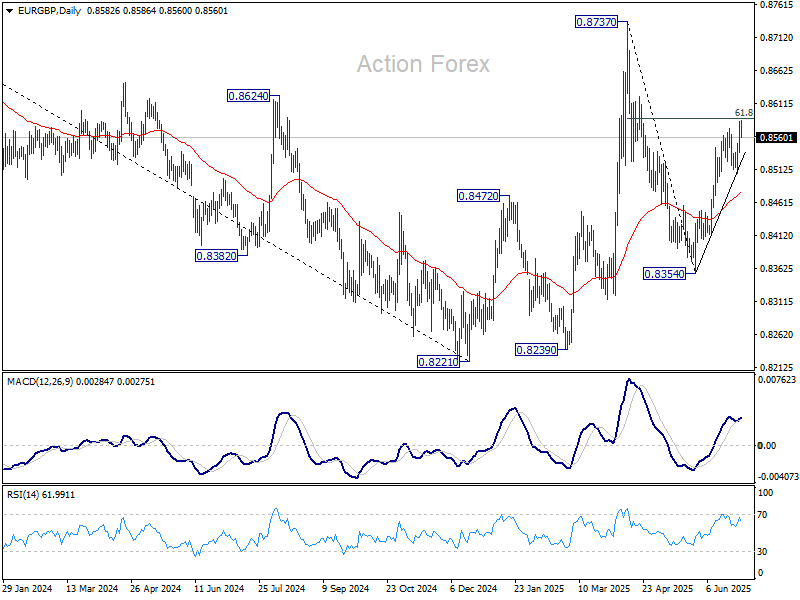
EUR/GBP Daily Outlook
Daily Pivots: (S1) 0.8553; (P) 0.8570; (R1) 0.8600; More...
Intraday bias in EUR/GBP is back on the upside with breach of 0.8573 temporary top. Sustained trading above 61.8% retracement of 0.8737 to 0.8354 at 0.8591 will extend the rally from 0.8354 to 0.8737 high. However, firm break of 0.8506 support will suggest rejection by 0.8591, and turn bias back to the downside instead.
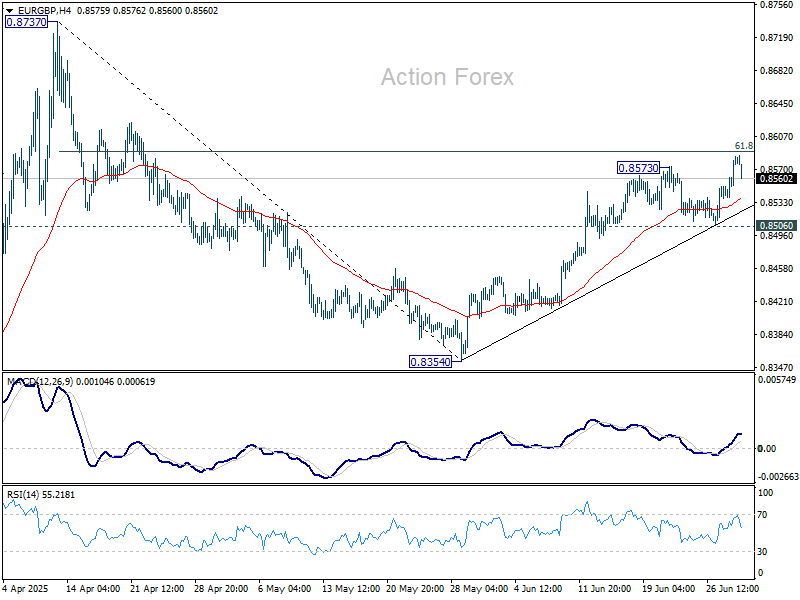
In the bigger picture, price actions from 0.8221 medium term bottom are seen as forming a corrective pattern to the down trend from 0.9267 (2022 high). Nevertheless, there is no clear momentum to break through 0.8201 key support (2022 low) yet. Hence, range trading is expected between 0.8221/8737 for now.
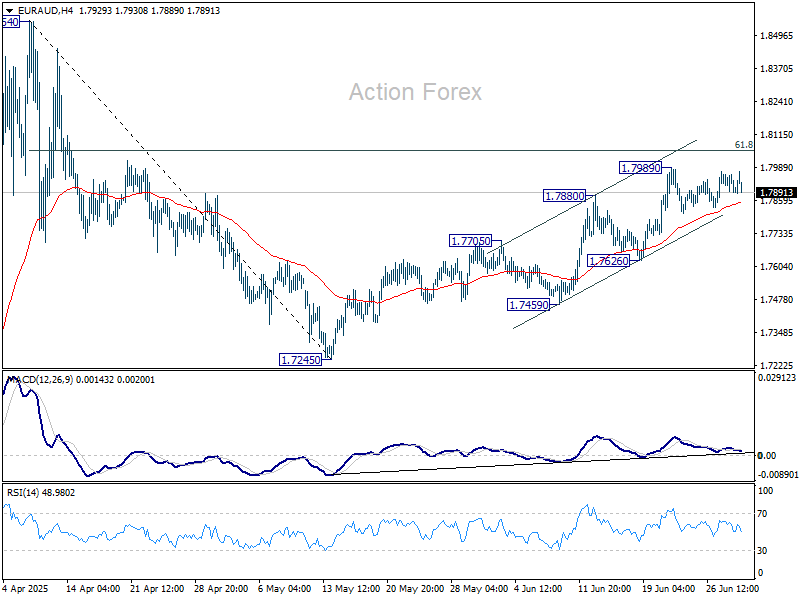
EUR/AUD Daily Outlook
Daily Pivots: (S1) 1.7881; (P) 1.7923; (R1) 1.7952; More...
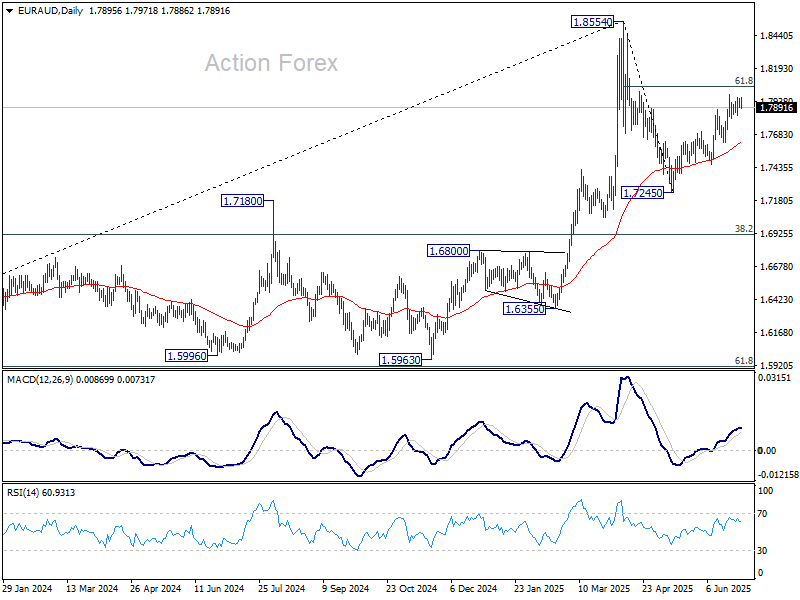
EUR/AUD is staying in consolidation below 1.7989 and intraday bias stays neutral. Further rally is expected as long as 1.7626 support holds. Above 1.7989 will target 61.8% retracement of 1.8554 to 1.7245 at 1.8054. Sustained break there will pave the way to 1.8554.
In the bigger picture, price actions from 1.8554 medium term are seen as a corrective pattern. While deeper pullback might be seen, downside should be contained by 38.2% retracement of 1.4281 (2022 low) to 1.8554 at 1.6922 to bring rebound. Up trend from 1.4281 is expected to resume at a later stage.
EUR/CHF Daily Outlook
Daily Pivots: (S1) 0.9330; (P) 0.9353; (R1) 0.9371; More....
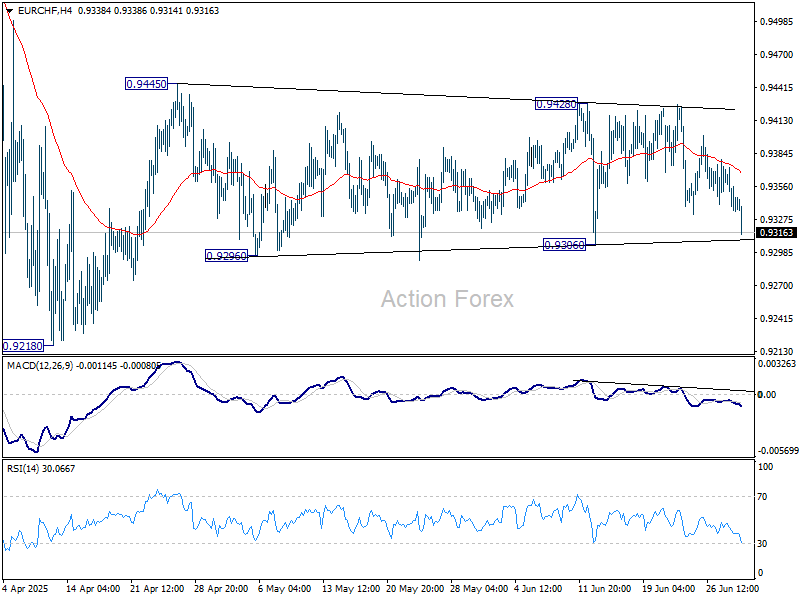
EUR/CHF is still staying in range of 0.9306/9428 and intraday bias stays neutral. Further rally is mildly in favor as long as 0.9306 support holds. On the upside, break of 0.9428/45 resistance zone will resume the rebound from 0.9218. On the downside, break of 0.9306 will bring retest of 0.9218 low instead.
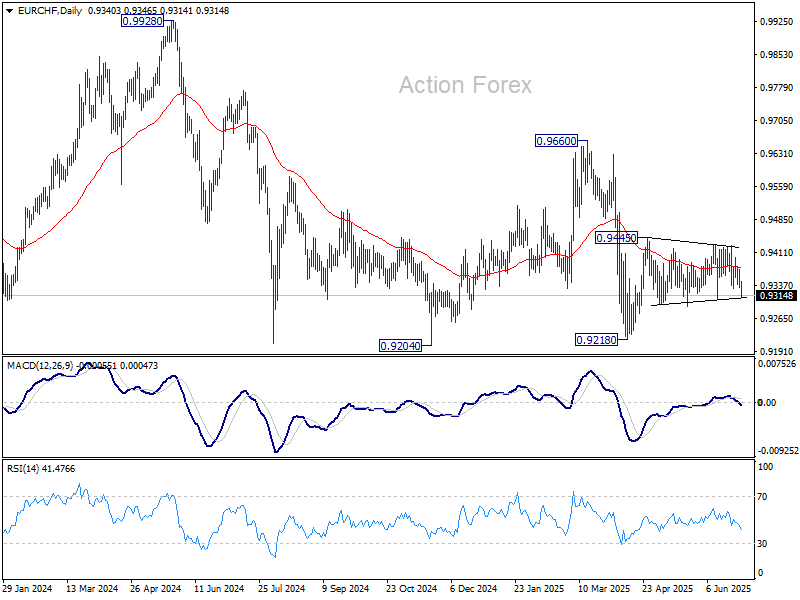
In the bigger picture, while downside momentum has been diminishing as seen in W MACD, there is no sign of bottoming yet. EUR/CHF is still staying below 55 W EMA and well inside long term falling channel. Outlook will stay bearish as long as 0.9660 resistance holds. Break of 0.9204 (2024 low) will confirm resumption of down trend from 1.2004 (2018 high).
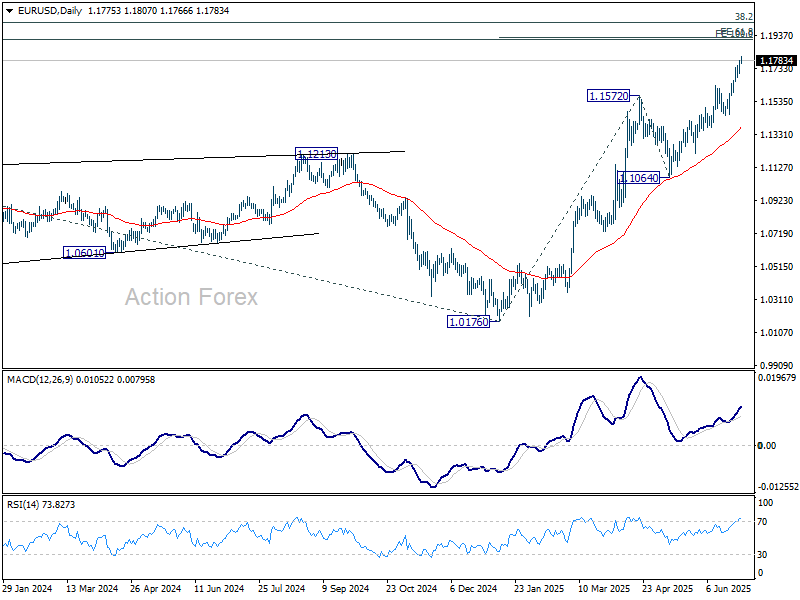
EUR/USD Daily Outlook
Daily Pivots: (S1) 1.1735; (P) 1.1761; (R1) 1.1815; More...
EUR/USD's rally continues today and intraday bias stays on the upside. Current rise should target 61.8% projection of 1.0176 to 1.1572 from 1.1064 at 1.1927. On the downside, below 1.1679 minor support will turn intraday bias neutral and bring consolidations. But downside should be contained above 1.1452 support to bring another rally.
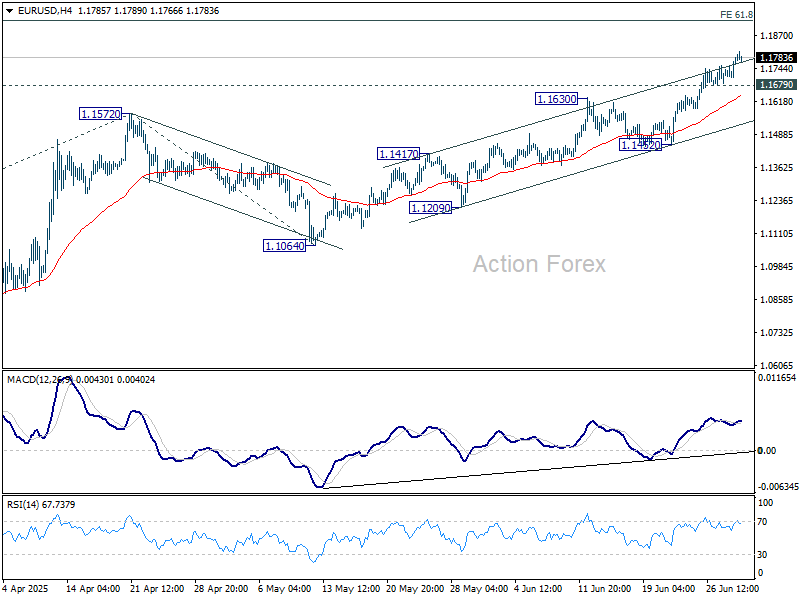
In the bigger picture, rise from 0.9534 long term bottom could be correcting the multi-decade downtrend or the start of a long term up trend. In either case, further rise should be seen to 100% projection of 0.9534 to 1.1274 from 1.0176 at 1.1916. This will now remain the favored case as long as 1.1604 support holds.