Sample Category Title
Market Wrap for the North American Session
Month-end flows notably influenced the session, leading to another instance of US Dollar underperformance. Equity markets, while ending the month on a positive note, experienced significant volatility into the close, as major participants leveraged the typically higher liquidity around monthly settlement prices for portfolio rebalancing.
Global indices are now closing above their early 2025 highs, completing what has been a volatile yet ultimately successful month of June.
Commodities observed a mixed performance today. Oil and other energy products saw declines, while Gold staged a notable rally throughout the session, closing just above the key $3,300 mark.
The broader macroeconomic landscape remained relatively calm. However, renewed tensions have emerged in Iran, and we will provide further analysis should the situation escalate.
Daily Cross-Asset performance
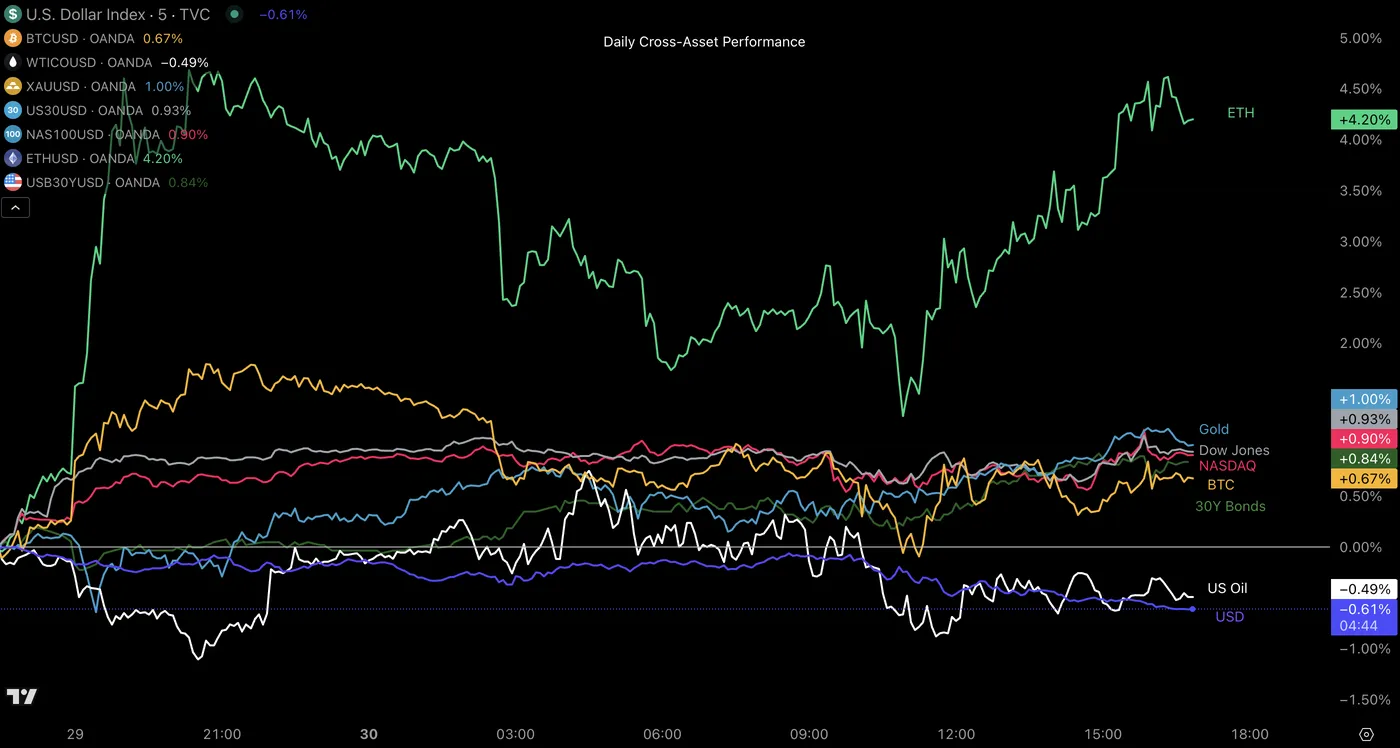
Cross-Asset Daily Performance, June 30, 2025 – Source: TradingView
Ethereum is the standout performer on the session – Monitor the performance of the second biggest crypto in July as digital assets tend to perform well in the month starting tomorrow.
A picture of today's performance for major currencies
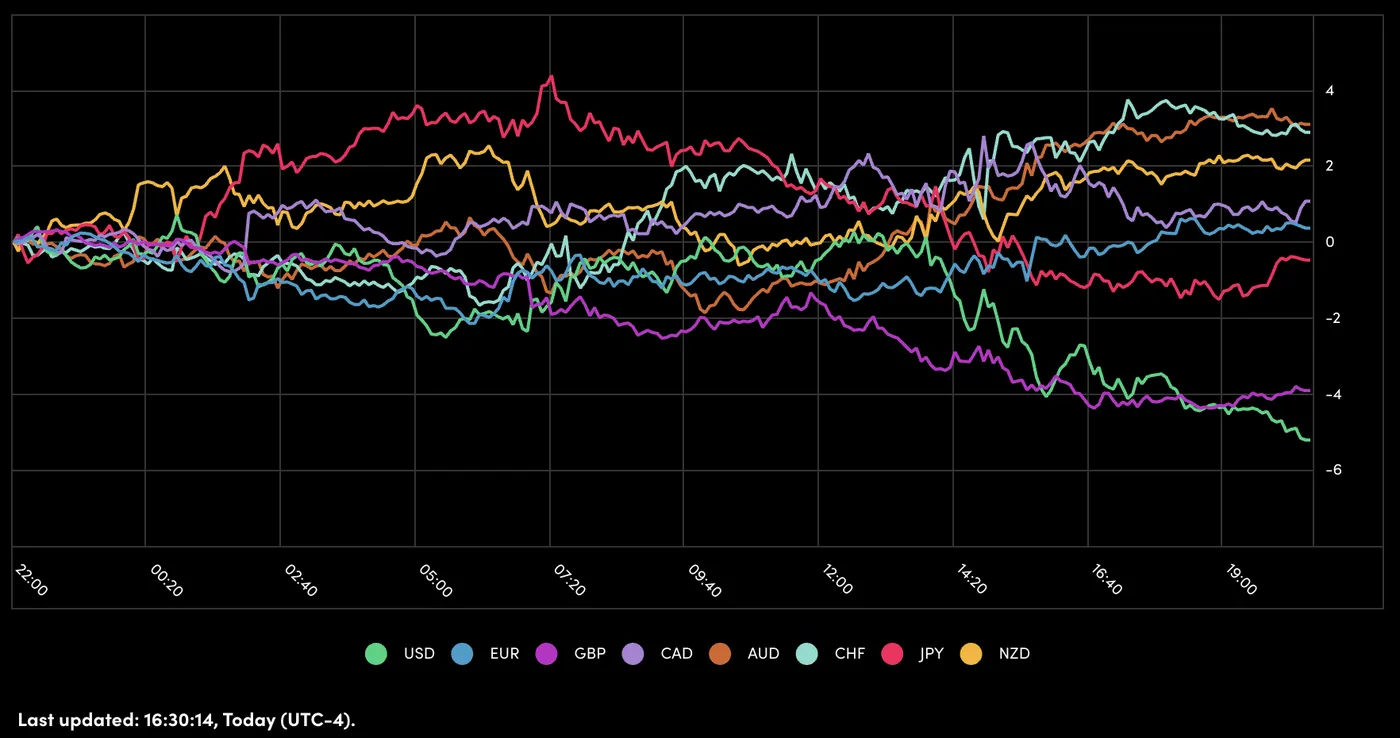
Currency Performance, June 30 – Source: OANDA Labs
The story repeats again in today's month-end flows – The US Dollar lagged again and Pacific currencies (NZD and AUD) are on top of majors.
Tomorrow's asset performance will be essential to monitor in order to see what markets are cooking for the upcoming month.
A look at Economic Data releasing in tonight and tomorrow's session
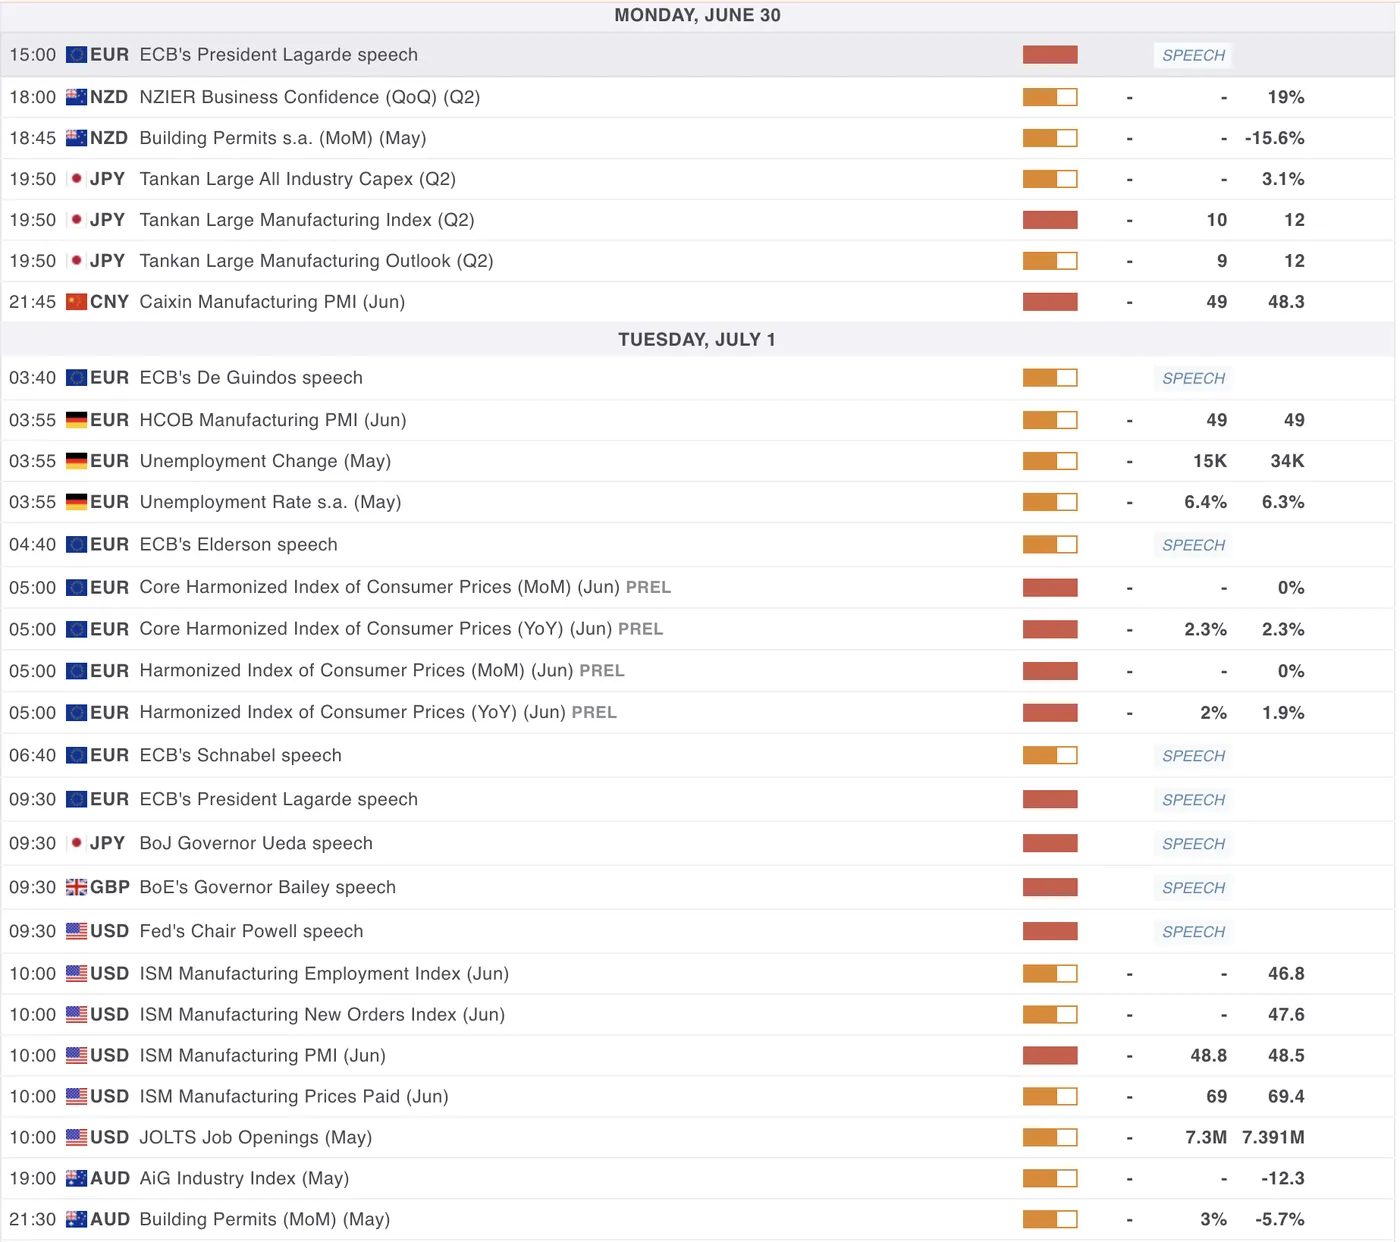
For all Market moving events, check the MarketPulse Economic Calendar
The overnight/tomorrow session will see more economic data releases, mostly with the US PMIs giving more clarity on the current economic picture for the US.
The ISM Manufacturing PMI is releasing tomorrow at 10:00 A.M. ET, expected at 48.8. The less market moving Chicago PMI came at a fairly big downward surprise with 40.3 vs 43 expected, markets may be preparing for some surprise in tomorrow's release.
Elsewhere, markets are awaiting for the Caixin PMI release from China tonight 21:45 (exp 49), which could be market moving particularly for APAC Currencies and Equity markets around the globe that have been performing quite dominantly in the past month.
For Euro traders, get ready for the Eurozone Inflation data release at 5:00 in the overnight session – We will have more clarity if the ECB has more work to do on their Monetary Policy or if the pause gets confirmed further.
Safe Trades!
Fed’s Bostic: Tariff effects may linger into 2026
Atlanta Fed President Raphael Bostic, speaking to CNBC, noted that “things are changing constantly,” complicating traditional forecasting methods. His comments come as markets monitor progress on President Trump’s new fiscal package, which passed a key Senate hurdle over the weekend.
From an inflation standpoint, Bostic said the Fed is watching how businesses and households adjust expectations and behaviors in response to current conditions. He saw “clear signs” that companies are planning to raise prices but cautioned that the scope and timing of those increases remain unclear.
Bostic also highlighted that many businesses now expect to delay tariff strategy decisions until 2026, suggesting the inflationary impact “could be a much more extended period than I think many expect."
Sunset Market Commentary
Markets
The European opening session of the week developed quiet and orderly. Trading settings which are unlikely to be repeated later this week given the avalanche of eco data and events approaching. The ECB published its first strategic review since 2021 (see news & views) as an appetizer in the build-up to the annual gathering in the Portuguese town of Sintra. It didn’t contain any groundbreaking views though. “Adapting to change: macroeconomic shifts and policy responses” is this year’s topic at the European Jackson Hole equivalent with ECB President Lagarde kicking off after European close with an introductory speech. A panel discussion with Lagarde, Fed Chair Powell, BoE Governor Bailey, BoJ governor Ueda (and BoK governor Rhee) is the forum’s headliner tomorrow afternoon. German harmonized inflation numbers showed price pressure unexpectedly slowing to 0.1% M/M and 2% Y/Y in June, making it a mixed national bag of numbers so far with upward surprises in Spain (0.6% M/M & 2.2% Y/Y) and France (0.4% M/M & 0.8% Y/Y) on Friday and in-line Italian data (0.2% M/M & 1.7% Y/Y) this morning. It makes for a likely dull, but welcome from a central bank point of view, outcome for tomorrow’s aggregate number (0.3% M/% & 2% Y/Y expected for headline; 2.3% Y/Y for core). Markets neglected the data with (EMU) inflation playing second fiddle as it hovers near the 2% price target will policy now well positioned to face an uncertain outlook. German yields trade up to 1.5 bps lower in a gentle steepening move. US Treasury yields slide 2 bps across the curve as focus turns to US Congress where Senators started a marathon of votes to finetune their version of President Trump’s Big Beautiful Bill after narrowly securing victory in a first procedural vote (51-49) on Saturday. A final Senate vote could come late today or early tomorrow. If it passes, the bill would then move back to the House. Despite today’s muted action in the Treasury market, we’d err on the side of new underperformance at the (very) long end of the curve later this week. The front end will be more interested in this week’s eco data (ISM’s and labour market update) and seems eager to exploit any sign of potential weakness. The combination of both won’t bode well for the dollar which remains stuck near multi-year lows (DXY 97.30; EUR/USD 1.1716; GBP/USD 1.3687).
News & Views
Polish inflation in June rose by 0.1% m/m to be up 4.1% on a yearly basis. The numbers printed broadly in line with expectations. Some details from Statistics Poland showed amongst others food and non-alcoholic beverage prices rising 0.1% m/m while energy prices (including electricity and gas) eased by 0.3% m/m. Transport fuels tumbled 1.3% in a monthly perspective. The June print means headline CPI is above the central bank’s upper bound of the 2.5% +/- 1 ppt tolerance range for a year now. Core inflation is due for release July 17 but has been trending lower in recent months to 3.3% in April, allowing the central bank (National Bank of Poland) to resume easing in May (-50 bps to 5.25%). The NBP made clear it would tread cautiously though. We expect one 25 bps move in Q3 followed by a cumulative 50 bps in cuts in the final quarter of this year (to 4.5%). Polish swap yields left the intraday lows after today’s release but remain up to 2.5 bps down for the day. The zloty trades stoic around EUR/PLN 4.24.
The ECB in its updated strategy reaffirmed its commitment to a symmetric 2% inflation target over the medium term. However, it now places greater emphasis on responding forcefully or persistently in case of sustained deviations in either direction. This is a departure of the 2020-2021 statement, which focused more on avoiding (too) low inflation. The ECB acknowledges that geopolitical and economic fragmentation, increasing use of AI, demographic change and the threat to environmental sustainability makes the inflation environment more uncertain and potentially more volatile. To account for this, the ECB will use scenario and sensitivity analyses in addition to the baseline. The central bank in pursuing its inflation goal keeps all monetary policy tools currently available in the toolkit, including negative rates, asset purchases and forward guidance. Their use, however, will be subject to a proportionality assessment to ensure flexibility and agility.
EUR/USD Mid-Day Outlook
Daily Pivots: (S1) 1.1682; (P) 1.1718; (R1) 1.1755; More...
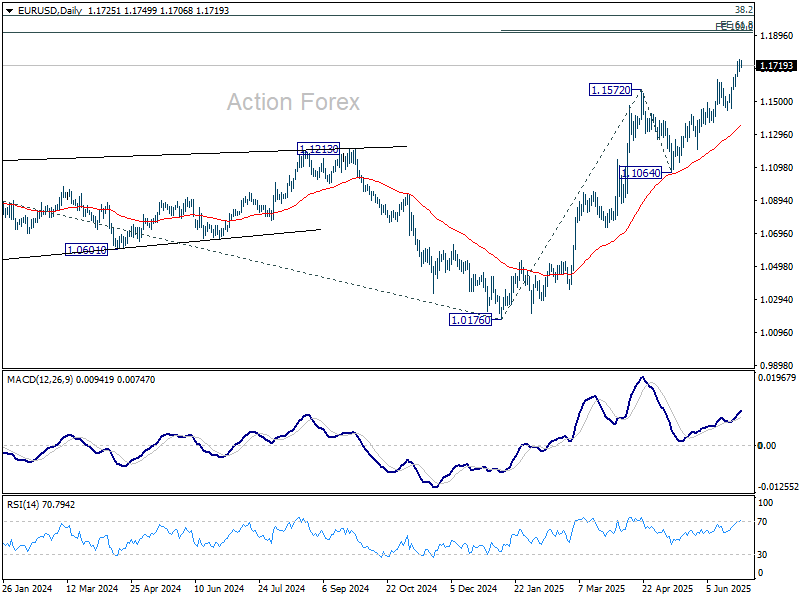
EUR/USD is losing some upside momentum as seen in 4H MACD, but there is no clear sign of topping yet. Intraday bias stays mildly on the upside. Current rally should target 61.8% projection of 1.0176 to 1.1572 from 1.1064 at 1.1927. On the downside, below 1.1679 minor support will turn intraday bias neutral and bring consolidations. But downside should be contained above 1.1452 support to bring another rally.
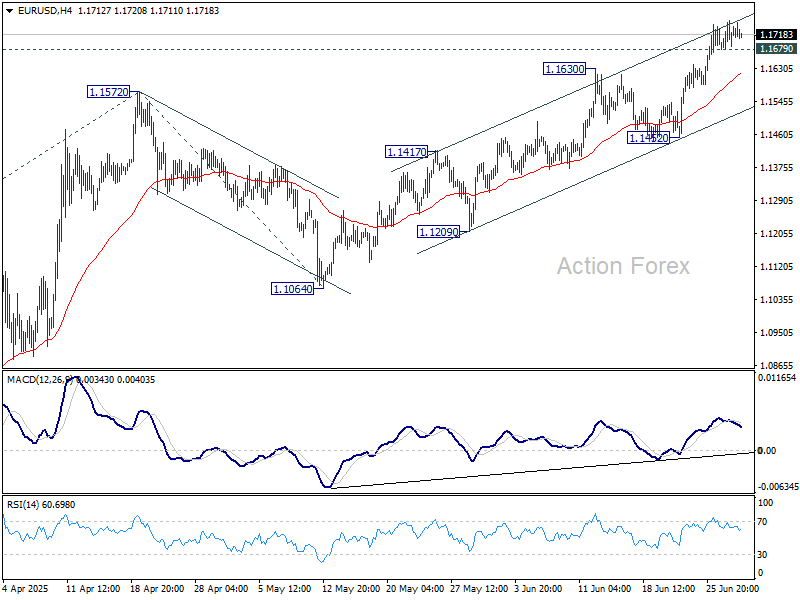
In the bigger picture, rise from 0.9534 long term bottom could be correcting the multi-decade downtrend or the start of a long term up trend. In either case, further rise should be seen to 100% projection of 0.9534 to 1.1274 from 1.0176 at 1.1916. This will now remain the favored case as long as 1.1604 support holds.
GBP/USD Mid-Day Outlook
Daily Pivots: (S1) 1.3684; (P) 1.3719; (R1) 1.3754; More...
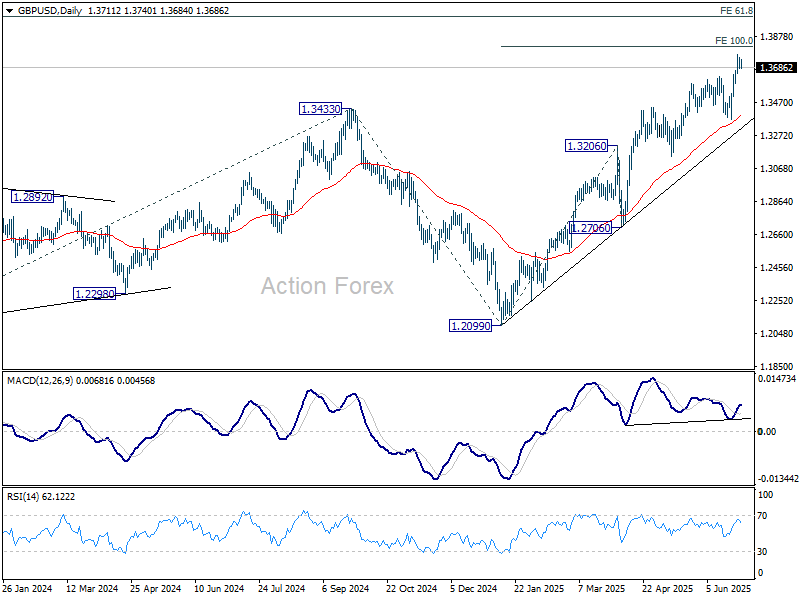
GBP/USD is staying in consolidations below 1.3770 temporary top and intraday bias remains neutral at this point. Downside of retreat should be contained above 1.3369 support to bring another rally. Above 1.3770 will target 100% projection of 1.2099 to 1.3206 from 1.3138 at 1.3813.
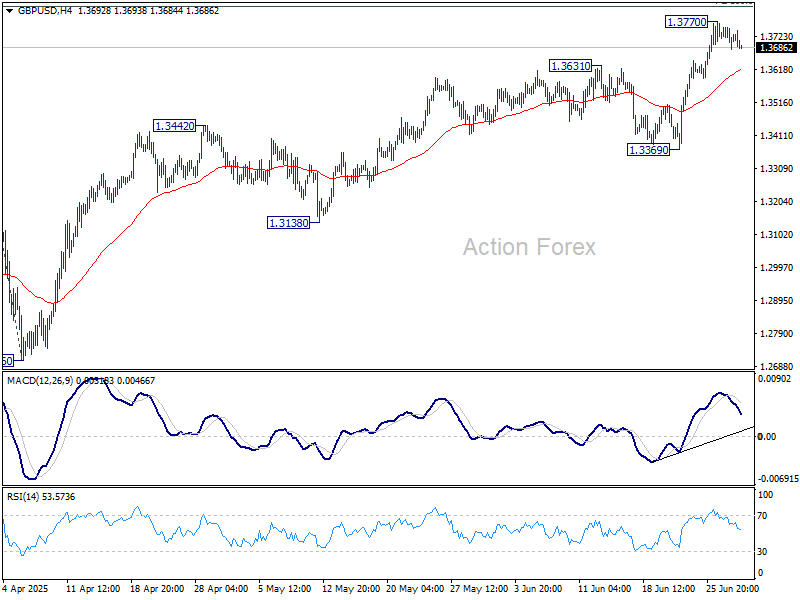
In the bigger picture, up trend from 1.3051 (2022 low) is in progress. Next medium term target is 61.8% projection of 1.0351 to 1.3433 from 1.2099 at 1.4004. Outlook will now stay bullish as long as 55 W EMA (now at 1.2960) holds, even in case of deep pullback.
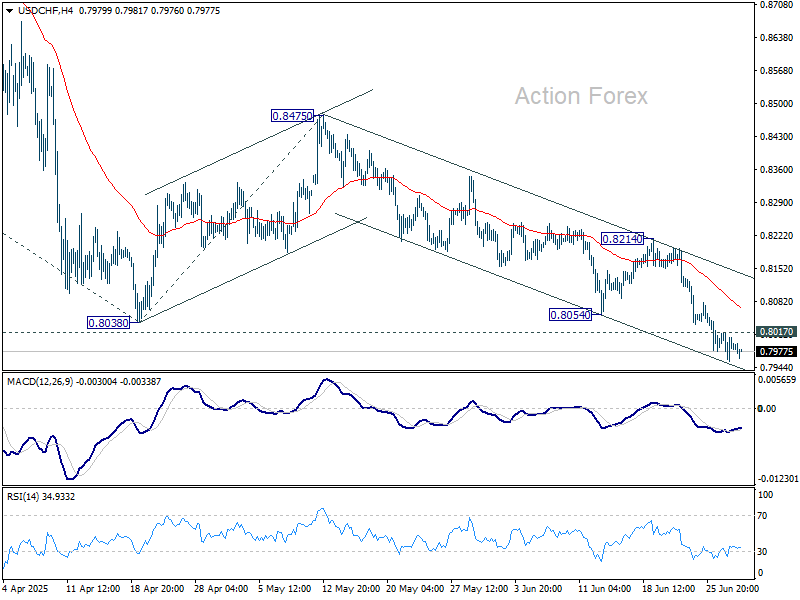
USD/CHF Mid-Day Outlook
Daily Pivots: (S1) 0.7959; (P) 0.7988; (R1) 0.8019; More….
While USD/CHF is losing some downside momentum as seen in 4H MACD, there is no clear sign of bottoming yet. Intraday bias stays mildly on the downside. Current down trend should target 61.8% projection of 0.9200 to 0.8038 from 0.8475 at 0.7757 next. On the upside, above 0.8017 minor resistance will turn intraday bias neutral and bring consolidations. But recovery should be limited below 0.8214 resistance to bring another fall.
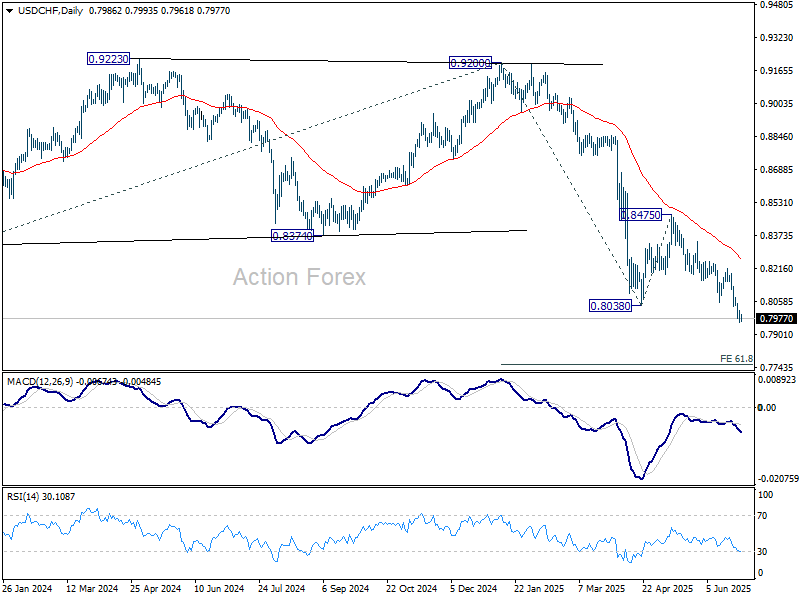
In the bigger picture, long term down trend from 1.0342 (2017 high) is still in progress. Next target is 100% projection of 1.0146 (2022 high) to 0.8332 from 0.9200 at 0.7382. In any case, outlook will stay bearish as long as 0.8475 resistance holds.
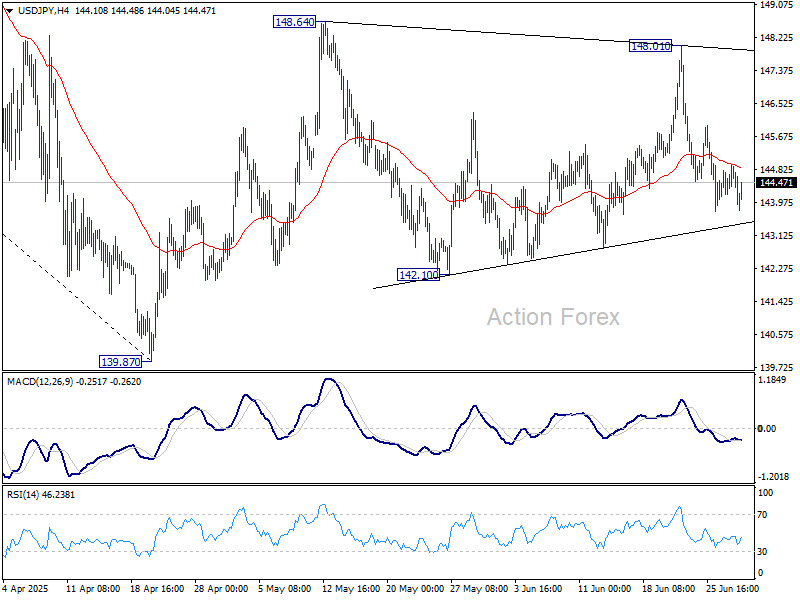
USD/JPY Mid-Day Outlook
Daily Pivots: (S1) 144.24; (P) 144.59; (R1) 145.01; More...
Intraday bias in USD/JPY stays neutral range trading continues inside 142.10/148.01. On the upside, firm break of 148.01 resistance will resume the rise from 139.87 to 61.8% retracement of 158.86 to 139.87 at 151.22. However, break of 142.10 will bring deeper fall back to retest 139.87 low.
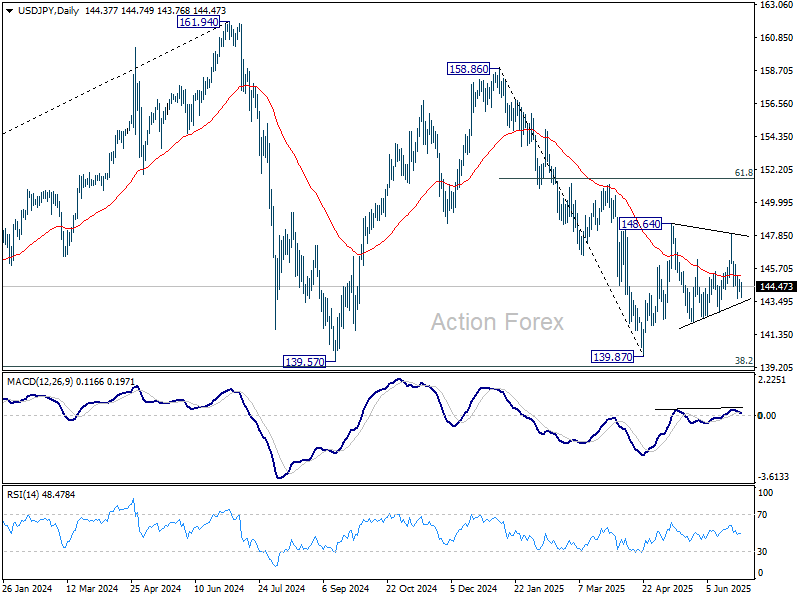
In the bigger picture, price actions from 161.94 are seen as a corrective pattern to rise from 102.58 (2021 low), with fall from 158.86 as the third leg. Strong support should be seen from 38.2% retracement of 102.58 to 161.94 at 139.26 to bring rebound. However, sustained break of 139.26 would open up deeper medium term decline to 61.8% retracement at 125.25.
Quiet Market With Trade Tensions Simmering, Japan’s Tankan in Focus
Forex trading remains subdued and directionless, with most major pairs and crosses holding within Friday’s ranges. Traders appear to be in wait-and-see mode ahead of a packed US data schedule. The spotlight turns first to Tuesday’s ISM Manufacturing report, then to Thursday’s ISM Services and the highly anticipated non-farm payrolls. Until then, price action might continued to stay constrained within recent ranges.
On the trade front, Japan’s negotiator Ryosei Akazawa returned from his seventh round of talks in Washington without securing a clear path forward. US President Trump said he may move ahead with a 25% tariff on Japanese autos, even as Tokyo had requested a review of the measure. Akazawa said he remains committed to reaching an agreement while safeguarding Japan’s economic interests.
Yen leads performance today so far, but weak momentum suggests it's vulnerable to reverse. Swiss Franc and Kiwi also trade firmer. Sterling lags at the bottom, with Dollar and Aussie also soft. Euro and Canadian Dollar are trading in the middle of the board.
Focus will soon shift to the BoJ’s quarterly Tankan survey, due in the Asian session. The report will offer the first full snapshot of business sentiment following the latest round of US trade measures. Economists expect a modest deterioration in confidence among both manufacturing and service firms, with particular concern about weakening export demand.
Expectations for another BoJ rate hike this year have already faded in recent weeks. A weak Tankan report would reinforce this dovish repricing, especially as trade headwinds mount.
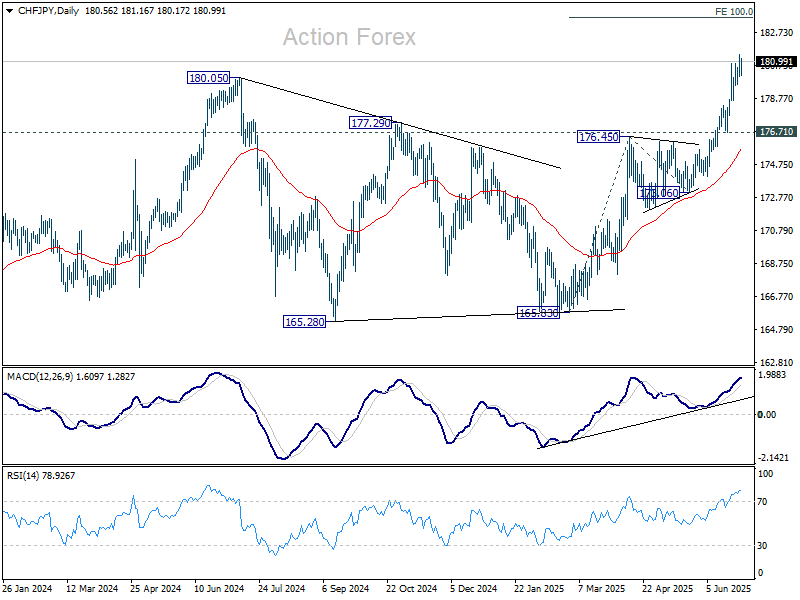
Technically, CHF/JPY's break of 180.05 resistance last week confirmed long term up trend resumption. Further rally should be seen to 100% projection of 165.83 to 176.45 from 173.06 at 183.68 next. Outlook will continue to stay bullish as long as 176.71 support holds, in case of retreat.
In Europe, at the time of writing, FTSE is down -0.19%. DAX is down -0.19%. CAC is up 0.05%. UK 10-year yield is down -0.019 at 4.487. Germany 10-year yield is down -0.01 at 2.582. Earlier in Asia, Nikkei rose 0.84%. Hong Kong HSI fell -0.87%. China Shanghai SSE rose 0.59%. Singapore Strait Times fell -0.05%. Japan 10-year JGB yield closed flat at 1.436.
Swiss KOF barometer Falls to 96.1, manufacturing outlook worsens
Switzerland’s KOF Economic Barometer dropped to 96.1 in June from 98.6, missing expectations of 99.3 and marking a renewed deterioration in growth momentum.
The decline reflects broad-based weakness across most underlying components, according to KOF, with the manufacturing sector highlighted as being “considerably under pressure.”
While the overall tone was negative, there was a slight offset from improved foreign demand indicators.
Japan’s industrial production rises 0.5% mom in May, far below expectation
Japan’s May industrial output came in far below expectations, rising just 0.5% mom versus the anticipated 3.4% mom growth. Though production improved in key sectors such as machinery and autos, five categories—led by non-auto transport equipment—recorded declines.
Shipments rose 2.2% mom, while inventories fell -1.9% mom, offering some positive signals, but not enough to shift the ministry’s cautious tone.
METI maintained its assessment that output “fluctuates indecisively”. A poll of manufacturers showed expectations for a muted 0.3% mom rise in June and a -0.7% mom drop in July.
China’s PMI manufacturing rises to 49.7, small firms lag
China’s official NBS PMI Manufacturing rose slightly to 49.7 in June, up from 49.5 and matching expectations. While still in contraction for a third straight month, the improvement in production (51.0) and new orders (50.2) suggests some stabilization in activity. Large manufacturers led the gains, with their PMI rising to 51.2, but conditions for small enterprises deteriorated sharply, with a 2-point drop to 47.3.
The Non-Manufacturing PMI also inched up to 50.5 from 50.3, supported by a rebound in construction activity. The construction business activity index rose to 52.8, while services slipped marginally to 50.1. Composite PMI rose to 50.7 from 50.4, reinforcing the picture of a subdued recovery.
NZ ANZ business confidence jumps to 46.3, but growth headwinds persist
Business confidence in New Zealand improved notably in June, with the ANZ headline index rising from 36.6 to 46.3 and firms’ Own Activity Outlook climbing from 34.8 to 40.9. Inflation expectations held steady at 2.71%.
ANZ warned that the underlying environment remains difficult, citing ongoing cost pressures, tight margins, and a global backdrop that continues to “impeding risk-taking”. The bank highlighted that while the 0.8% qoq Q1 growth was solid, the outlook for Q2 appears “not looking nearly so positive. Despite stronger sentiment, actual business conditions and demand may remain under pressure in the months ahead.
ANZ continues to forecast more rate cuts from the RBNZ than the central bank currently projects, arguing that the recovery will likely fall short of policymakers’ expectations. Still, it acknowledged that the RBNZ appears inclined to move slowly, balancing inflation risks with a softening economic backdrop.
USD/JPY Mid-Day Outlook
Daily Pivots: (S1) 144.24; (P) 144.59; (R1) 145.01; More...
Intraday bias in USD/JPY stays neutral range trading continues inside 142.10/148.01. On the upside, firm break of 148.01 resistance will resume the rise from 139.87 to 61.8% retracement of 158.86 to 139.87 at 151.22. However, break of 142.10 will bring deeper fall back to retest 139.87 low.
In the bigger picture, price actions from 161.94 are seen as a corrective pattern to rise from 102.58 (2021 low), with fall from 158.86 as the third leg. Strong support should be seen from 38.2% retracement of 102.58 to 161.94 at 139.26 to bring rebound. However, sustained break of 139.26 would open up deeper medium term decline to 61.8% retracement at 125.25.
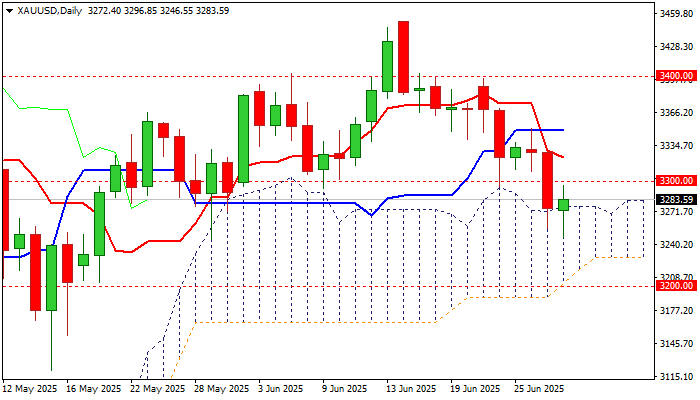
Gold Bounces from One-Month Low But Recovery Still Hold Below Initial Barriers
Gold bounced from one-month low ($3247) on Monday, lifted by weaker dollar and partial profit-taking from 5% drop in past two weeks.
The yellow metal showed limited positive reaction on recent war between Israel and Iran but fell two full figures on announcement of ceasefire and signals of US-China trade deal, which contributed to strong drop in safe-haven demand.
Bears faced strong headwinds from thick daily Ichimoku cloud (cloud top lays at $3276) and has repeatedly contained dips (today / Friday) highlighting the significance of support.
However, recovery still lacks strength to clear first significant barriers at $3300 zone (14-d momentum is in negative territory / MA’s still in full bearish setup) that keeps the downside vulnerable.
Near-term action may hold in more quiet mode as markets await releases of key US labor reports (JOLTS / ADP / NFP) this week, which are expected to provide a fresh update about the situation in US labor sector and subsequently contribute to Fed’s rate decisions.
The latest positive signals from US-China trade deal may ease pressure, although tariffs are likely to remain the main obstacle, as the US central bank sees increased risk of fresh rise in consumer prices if Trump’s administration implements tariffs.
Bullish scenario – initial positive signal on clear break of $3300 zone, which will need verification on lift above $3325 (Fibo 38.2% of $3452/$3246 descend) and open way for possible stronger recovery.
Bearish scenario – the downside is expected to remain at risk if recovery repeatedly fails to clear $3300 zone, with repeated penetration of daily cloud and violation of recent low ($3247, also Fibo 61.8% of $3120/$3452) to risk deeper drop towards $3200 (psychological / Fibo 76.4%).
Res: 3300; 3325; 3350; 3373.
Sup: 3247; 3222; 3200; 3168.