
Sample Category Title
Canada Reverses Digital Tax to Save U.S. Trade Talks; Loonie Recovers Modestly
The forex market opened the week with low volatility and mixed Asian equities, but politically driven developments are keeping some G10 currencies in motion. Dollar is the weakest performer so far, with the Canadian Dollar also under pressure despite rebounding from weekend lows. Yen leads amid safe-haven inflows, while Kiwi and Aussie post modest gains.
Ottawa moved to de-escalate tensions with Washington by announcing a reversal of its digital services tax, originally set to take effect this week. The retroactive levy on American tech firms had prompted a sharp rebuke from US President Donald Trump, who vowed to halt all trade discussions with Canada. Reversing the tax was described by Canadian leadership as a strategic step to preserve the July 21 negotiation timeline and prevent retaliatory tariffs.
Canadian Prime Minister Mark Carney and Finance Minister Champagne framed the decision as a way to unlock progress on a new economic and security partnership. Markets welcomed the move, and the Loonie erased some of its losses, though sentiment remains fragile given the broader uncertainty heading into July’s tariff deadlines.
Meanwhile, the UK confirmed its partial trade agreement with the US has now come into force. British car exports will now face a reduced 10% tariff quota, and duties on aircraft parts have been removed. While the deal marks progress, the issue of steel and aluminum tariffs remains unresolved. UK officials reiterated their intent to push for 0% tariffs on core steel products under the agreed framework.
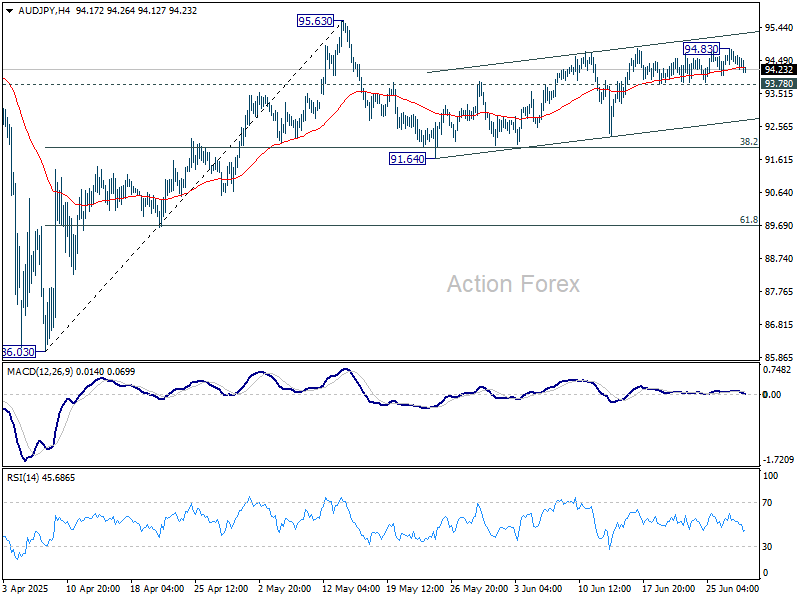
Technically, AUD/JPY's choppy recovery from 91.64 might be close to completion, with further lot of momentum as seen in 4H MACD. Firm break of 93.78 support will suggest that corrective pattern from 95.63 short term top has started. Deeper fall should the be seen back to 94.64 support next.
In Asia, at the time of writing, Nikkei is up 0.79%. Hong Kong HSI is down -0.38%. China Shanghai SSE is up 0.38%. Singapore Strait Times is up 0.03%. Japan 10-year JGB yield is flat at 1.437.
Japan’s industrial production rises 0.5% mom in May, far below expectation
Japan’s May industrial output came in far below expectations, rising just 0.5% mom versus the anticipated 3.4% mom growth. Though production improved in key sectors such as machinery and autos, five categories—led by non-auto transport equipment—recorded declines.
Shipments rose 2.2% mom, while inventories fell -1.9% mom, offering some positive signals, but not enough to shift the ministry’s cautious tone.
METI maintained its assessment that output “fluctuates indecisively”. A poll of manufacturers showed expectations for a muted 0.3% mom rise in June and a -0.7% mom drop in July.
China’s PMI manufacturing rises to 49.7, small firms lag
China’s official NBS PMI Manufacturing rose slightly to 49.7 in June, up from 49.5 and matching expectations. While still in contraction for a third straight month, the improvement in production (51.0) and new orders (50.2) suggests some stabilization in activity. Large manufacturers led the gains, with their PMI rising to 51.2, but conditions for small enterprises deteriorated sharply, with a 2-point drop to 47.3.
The Non-Manufacturing PMI also inched up to 50.5 from 50.3, supported by a rebound in construction activity. The construction business activity index rose to 52.8, while services slipped marginally to 50.1. Composite PMI rose to 50.7 from 50.4, reinforcing the picture of a subdued recovery.
NZ ANZ business confidence jumps to 46.3, but growth headwinds persist
Business confidence in New Zealand improved notably in June, with the ANZ headline index rising from 36.6 to 46.3 and firms’ Own Activity Outlook climbing from 34.8 to 40.9. Inflation expectations held steady at 2.71%.
ANZ warned that the underlying environment remains difficult, citing ongoing cost pressures, tight margins, and a global backdrop that continues to “impeding risk-taking”. The bank highlighted that while the 0.8% qoq Q1 growth was solid, the outlook for Q2 appears “not looking nearly so positive. Despite stronger sentiment, actual business conditions and demand may remain under pressure in the months ahead.
ANZ continues to forecast more rate cuts from the RBNZ than the central bank currently projects, arguing that the recovery will likely fall short of policymakers’ expectations. Still, it acknowledged that the RBNZ appears inclined to move slowly, balancing inflation risks with a softening economic backdrop.
US NFP and ISM, Eurozone CPI and ECB accounts watched this week
Markets will focus heavily on June’s US Non-Farm Payrolls report this week, which comes amid growing signs that Fed is willing to wait before resuming policy easing. Recent comments from Chair Jerome Powell and most other Fed officials suggest they still see the labor market as resilient, even as private-sector hiring has slowed. With tariffs set to lift inflation in the near term, policymakers appear content to wait while they assess how these effects filter into prices and activity.
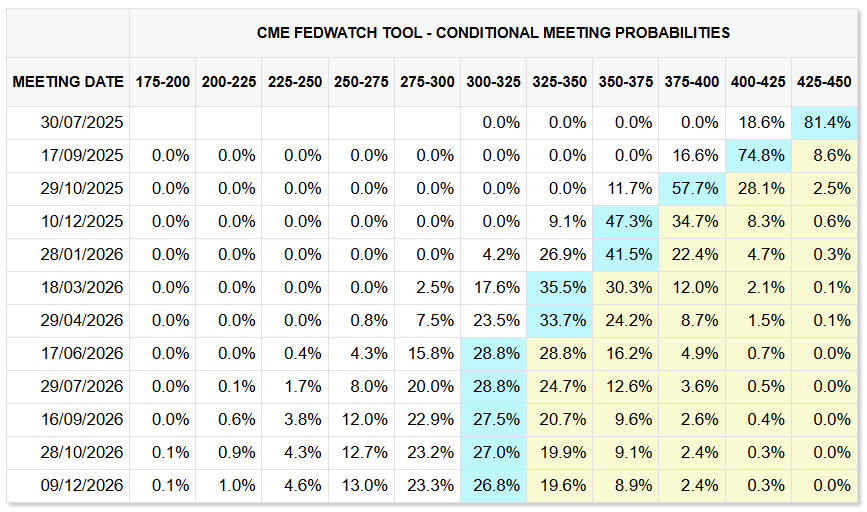
Unless the NFP data is shockingly weak, it's unlikely to shift the consensus that July is too soon for another rate cut. September remains the earliest realistic window. That said, any meaningful downside surprise would firm up expectations for a September move and potentially encourage traders to lean more aggressively into bets for a third cut this year. For now, futures price in a 56% chance of a triple-easing path.
Beyond payrolls, traders will dissect the ISM Manufacturing and Services PMIs for guidance on activity, labor and inflation pressures. The prices and employment sub-indices carry particular weight in the current environment.
In the Eurozone, investors will focus on the June flash CPI and ECB meeting accounts. The central question is whether ECB has already concluded its current easing cycle or still sees the need for one final adjustment. While market pricing reflects a bias for one more cut by September, the lack of consensus is evident. A recent Reuters poll found only 53% of economists expecting another move.
Markets will look to the meeting accounts for any signs that influential members like Chief Economist Philip Lane see further cut as necessary. A dovish tone could revive rate cut bets and weigh on the Euro, while confirmation that ECB views policy as broadly appropriate now could prompt repricing toward a hold.
Here are some highlights for the week:
- Monday: Japan industrial production; China NBS PMIs; Germany import prices, retail sales, CPI flash; UK Q1 GDP final; Swiss KOF economic barometer; US Chicago PMI.
- Tuesday: Japan Tankan survey, PMI manufacturing final, consumer confidence; China Caixin PMI manufacturing; Swiss retail sales, PMI manuacturing; Eurozone PMI manufacturing final, CPI flash; Germany unemployment; UK PMI manufacturing final; US ISM manufacturing.
- Wednesday: Japan monetary base; Australia retail sales; Eurozone unemployment rate; US ADP employment; Canada PMI manufacturing.
- Thursday: Australia goods trade balance; China Caixin PMI services; Swiss CPI; Eurozone PMI Services final, ECB meeting accouints; UK PMI Services final; Canada trade balance; US non-farm payrolls, jobless claims, trade balance, ISM services.
- Friday: Japan household spendig; Germany factory orders; France industrial production; Swiss unemployment rate; UK PMI construction; Eurozone PPI.
USD/CAD Daily Outlook
Daily Pivots: (S1) 1.3619; (P) 1.3689; (R1) 1.3750; More...
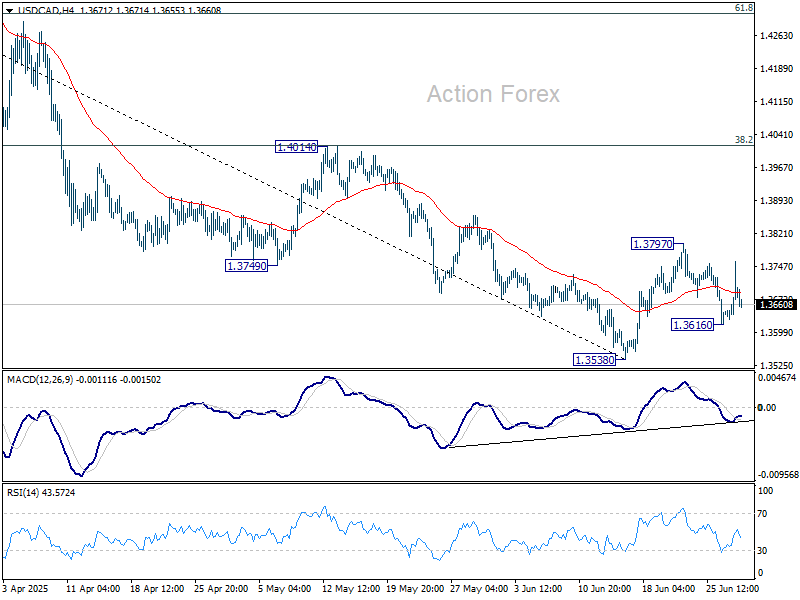
USD/CAD dips mildly today but stays in range of 1.3616/3797. Intraday bias remains neutral at this point. On the upside, break of 1.3797 will resume the rebound from 1.3538 short term bottom to 1.4014 cluster resistance (38.2% retracement of 1.4791 to 1.3538 at 1.4017). Nevertheless, below 1.3616 will bring retest of 1.3538 low.
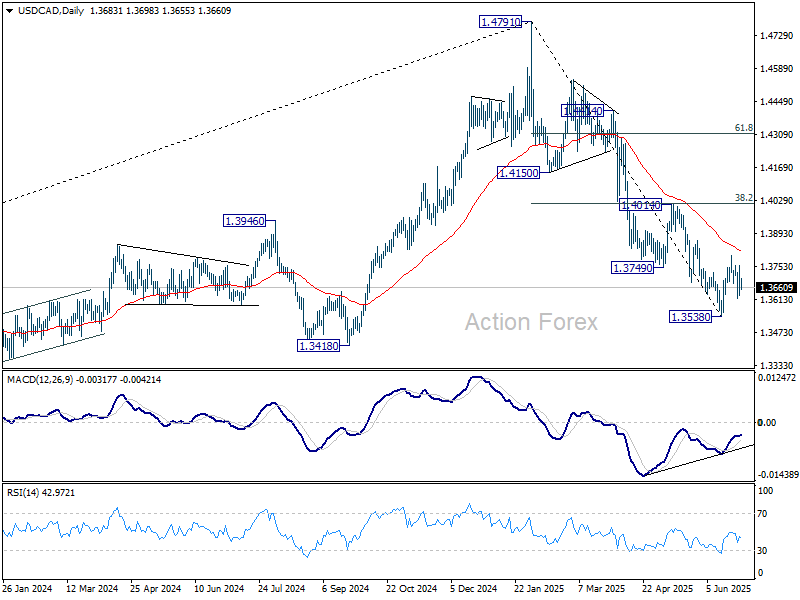
In the bigger picture, price actions from 1.4791 medium term top could either be a correction to rise from 1.2005 (2021 low), or trend reversal. In either case, further decline is expected as long as 1.4014 resistance holds. Next target is 61.8% retracement of 1.2005 (2021 low) to 1.4791 at 1.3069.
EUR/USD Pushes Upward — Bullish Momentum Supports Rally Extension
Key Highlights
- EUR/USD extended gains above the 1.1650 resistance.
- The pair is now consolidating below the 1.1750 resistance on the 4-hour chart.
- GBP/USD rallied above the 1.3650 and 1.3720 levels.
- USD/JPY might find bids near the 143.50 support zone.
EUR/USD Technical Analysis
The Euro started a steady increase above the 1.1650 level against the US Dollar. EUR/USD cleared many hurdles to enter a positive zone.
Looking at the 4-hour chart, the pair started an upward move by clearing a bullish flag pattern with resistance at 1.1565. It settled above the 1.1650 level, the 100 simple moving average (red, 4-hour), and the 200 simple moving average (green, 4-hour).
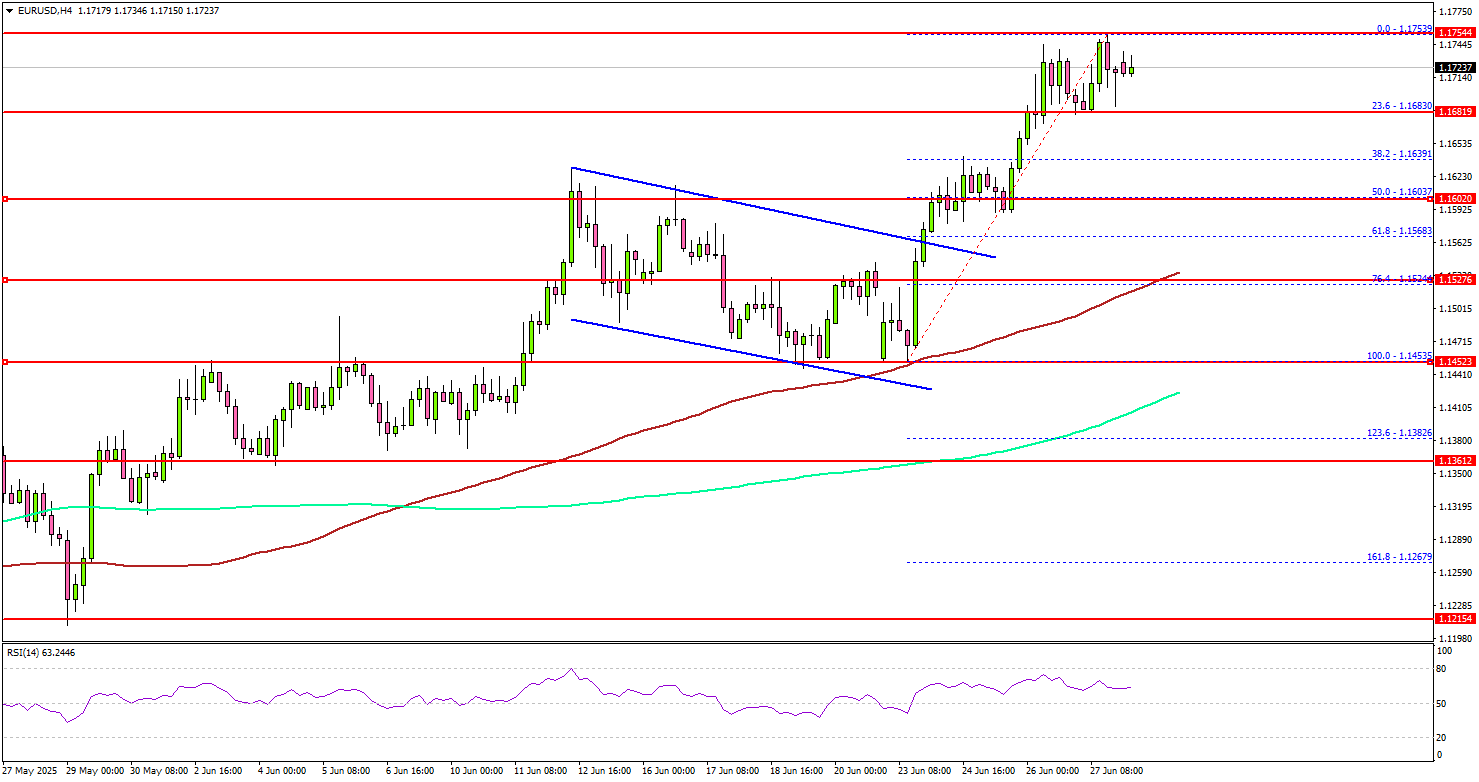
The pair even cleared the 1.1720 level and tested the 1.1750 zone. It is now consolidating gains. On the downside, immediate support is near the 1.1680 level. The next key support sits near 1.1640.
Any more losses could send the pair toward the 1.1600 support zone. If the bulls remain active above the stated support levels, there could be a fresh increase. On the upside, the pair could face resistance near the 1.1750 level.
The next key resistance sits near the 1.1780 level. The first major resistance sits at 1.1800. A close above the 1.1800 level could set the pace for another increase. In the stated case, the pair could even clear the 1.1880 resistance. The next major stop for the bulls could be near the 1.1950 resistance.
Looking at GBP/USD, the pair gained pace for an upside break above the 1.3650 and 1.3720 resistance levels. The next key hurdle sits at 1.3800.
Upcoming Economic Events:
- German Consumer Price Index for June 2025 (YoY) (Prelim) – Forecast +2.1%, versus +2.1% previous.
- German Consumer Price Index for June 2025 (MoM) (Prelim) s– Forecast +0.2%, versus +0.1% previous.
- ECB's President Lagarde speech.
China’s PMI manufacturing rises to 49.7, small firms lag
China’s official NBS PMI Manufacturing rose slightly to 49.7 in June, up from 49.5 and matching expectations. While still in contraction for a third straight month, the improvement in production (51.0) and new orders (50.2) suggests some stabilization in activity. Large manufacturers led the gains, with their PMI rising to 51.2, but conditions for small enterprises deteriorated sharply, with a 2-point drop to 47.3.
The Non-Manufacturing PMI also inched up to 50.5 from 50.3, supported by a rebound in construction activity. The construction business activity index rose to 52.8, while services slipped marginally to 50.1. Composite PMI rose to 50.7 from 50.4, reinforcing the picture of a subdued recovery.
NZ ANZ business confidence jumps to 46.3, but growth headwinds persist
Business confidence in New Zealand improved notably in June, with the ANZ headline index rising from 36.6 to 46.3 and firms' Own Activity Outlook climbing from 34.8 to 40.9. Inflation expectations held steady at 2.71%.
ANZ warned that the underlying environment remains difficult, citing ongoing cost pressures, tight margins, and a global backdrop that continues to "impeding risk-taking". The bank highlighted that while the 0.8% qoq Q1 growth was solid, the outlook for Q2 appears "not looking nearly so positive. Despite stronger sentiment, actual business conditions and demand may remain under pressure in the months ahead.
ANZ continues to forecast more rate cuts from the RBNZ than the central bank currently projects, arguing that the recovery will likely fall short of policymakers’ expectations. Still, it acknowledged that the RBNZ appears inclined to move slowly, balancing inflation risks with a softening economic backdrop.

Japan’s industrial production rises 0.5% mom in May, far below expectation
Japan’s May industrial output came in far below expectations, rising just 0.5% mom versus the anticipated 3.4% mom growth. Though production improved in key sectors such as machinery and autos, five categories—led by non-auto transport equipment—recorded declines.
Shipments rose 2.2% mom, while inventories fell -1.9% mom, offering some positive signals, but not enough to shift the ministry’s cautious tone.
METI maintained its assessment that output “fluctuates indecisively”. A poll of manufacturers showed expectations for a muted 0.3% mom rise in June and a -0.7% mom drop in July.
FTSE 100 Wave Analysis
FTSE 100: ⬆️ Buy
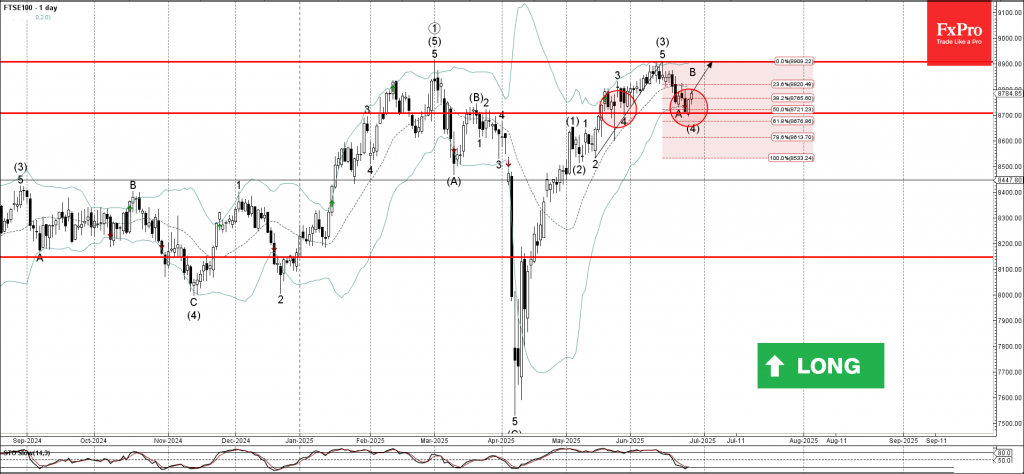
- FTSE 100 reversed from support level 8700.00
- Likely to rise to resistance level 8900.00
FTSE 100 index recently reversed up from the support level 8700.00 (which stopped wave 4 at the end of May, as can be seen from the daily FTSE 100 chart below) intersecting with the lower daily Bollinger Band and the 50% Fibonacci correction of the upward impulse from May.
The upward reversal from the support level 8700.00 stopped wave A of the active ABC correction (4) from the start of June.
Given the clear daily uptrend, FTSE 100 index can be expected to rise to the next resistance level 8900.00, which stopped the previous impulse wave (3).
Dow Jones Wave Analysis
Dow Jones: ⬆️ Buy
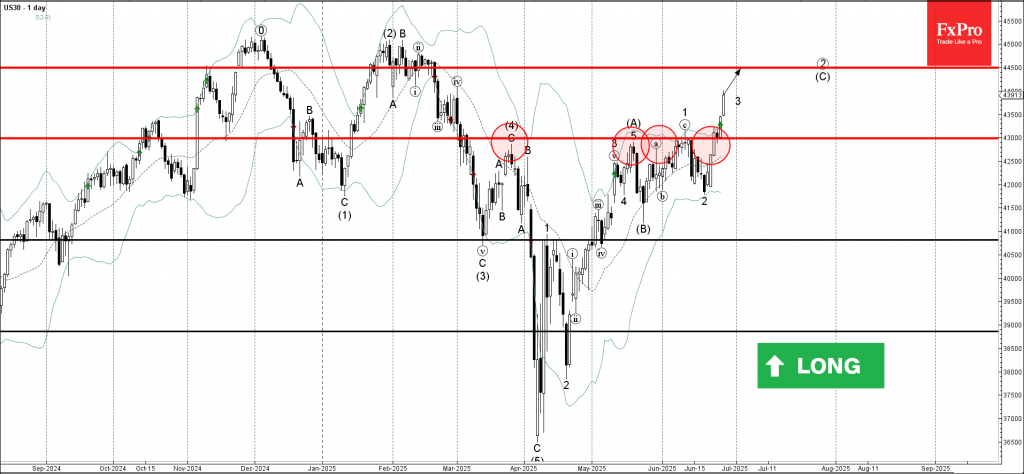
- Dow Jones broke pivotal resistance level 43000.00
- Likely to rise to resistance level 44500.00
Dow Jones index recently broke above the pivotal resistance level 43000.00 (which has been reversing the price from the end of March, as can be seen from the daily Dow Jones chart below).
The breakout of the resistance level 43000.00 accelerated the active impulse wave 3 of the intermediate impulse wave (C) from the end of May.
Dow Jones index can be expected to rise to the next resistance level 44500.00, which is the target price for the completion of the active impulse wave (C).
Dollar Index Hits Multi-Year Low and Broke Long Term Fibonacci Level
Dollar ended last week as the weakest major currency, with Dollar Index breaking to a fresh three-year low. Risk-on sentiment was a key driver: US equities surged following the Israel-Iran ceasefire, and S&P 500 and NASDAQ both posted record closes on Friday. Rising expectations of rate cuts from Fed later this year also contributed to Dollar’s selloff, as markets added bets on a September move.
More structurally, sentiment toward Dollar continued to souring as investors reassess its role as a global anchor of stability. Stagflation fears, concerns over fiscal sustainability, and volatility in US trade and policy have all raised red flags. This repositioning away from the dollar is not merely technical—it reflects a deeper shift in global reserve management and private capital flows.
After years of heavy USD allocation, investors are actively diversifying, with Euro-denominated and Swiss Franc assets among the key beneficiaries. If the tariff truce ends without compromise in early July, it could further accelerate this reallocation.
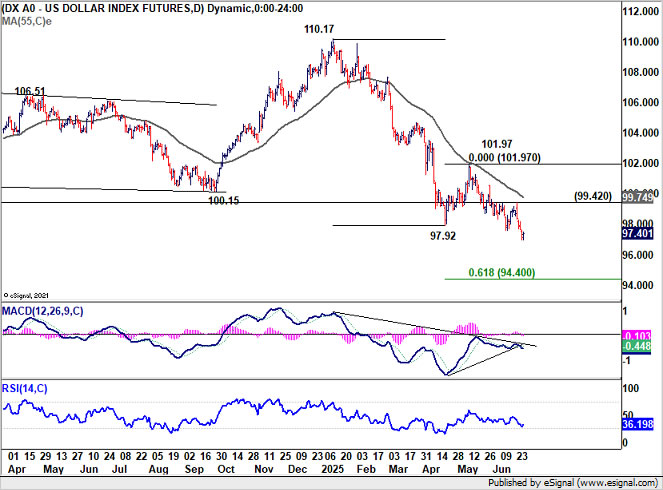
Dollar Index Breaks Long-Term Fibonacci Support
Technically, for the near term, further decline is expected in Dollar Index as long as 99.42 resistance holds. Next target is 61.8% projection of 110.17 to 97.92 from 101.97 at 94.40.
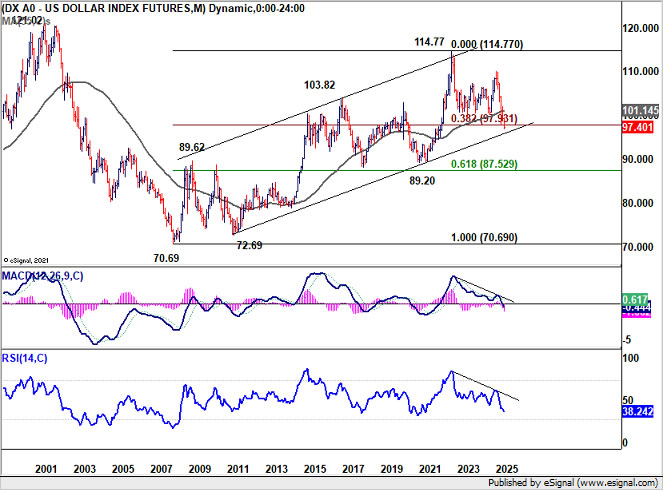
More importantly, as seen in the monthly chart, the close below 38.2% retracement of 70.69 (2008 low) to 114.77 (2022 high) at 97.93 is a bearish sign. Decisive break of long term channel support (now at 95.80) will suggest that whole up trend from 70.69 has already completed. Deeper medium term fall would be seen to 61.8% retracement at 87.52, even still as a corrective move.
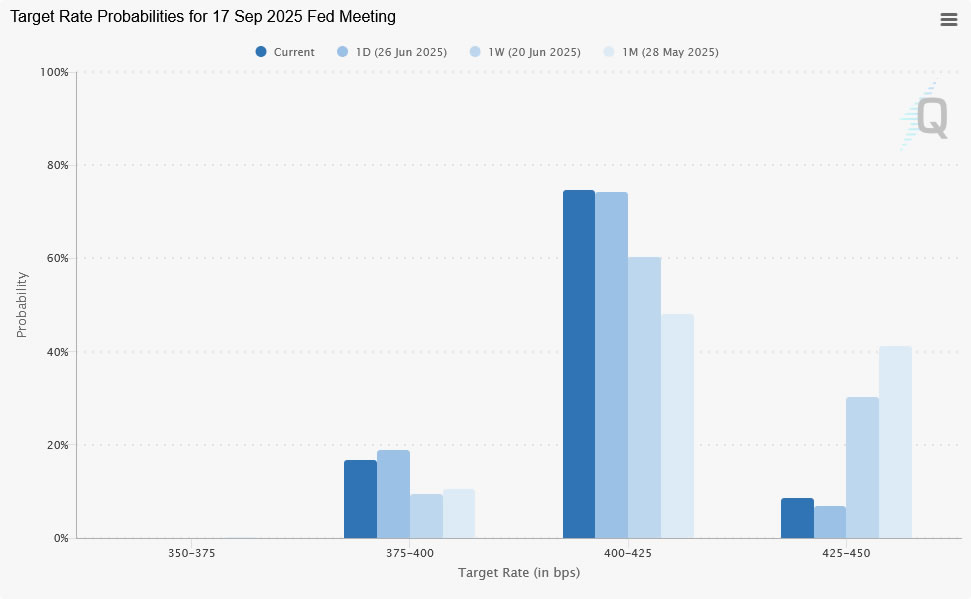
Fed Pushback Delays July Cut, but Markets Bank on September
With the Israel-Iran conflict de-escalated, markets refocused on the Fed. Despite warnings from multiple Fed speakers that July is too soon to cut, there is widespread acknowledgment that the easing cycle will resume later in the year—likely in September.
Fed Governor Michelle Bowman added her voice in favor of an earlier move, echoing fellow Governor Christopher Waller’s recent comments. Notably, both officials are rumored candidates for the next Fed Chair, lending political weight to their dovish stance.
Still, Chair Jerome Powell struck a more careful tone in his Congressional testimony, warning that there’s no modern precedent for the scale of Trump’s proposed tariffs. While a one-time price jump is possible, the risk of more persistent inflation cannot be dismissed. Most Fed officials, including Williams, Bostic, and Collins, stressed patience too.
Markets, however, was more focused on softening data. Personal consumption unexpectedly contracted in May, while core PCE inflation edged up just slightly to 2.7%—a result that added to growing confidence that Fed act again soon. As a result, odds of a September rate cut now exceed 90%, up from around 70% last week.
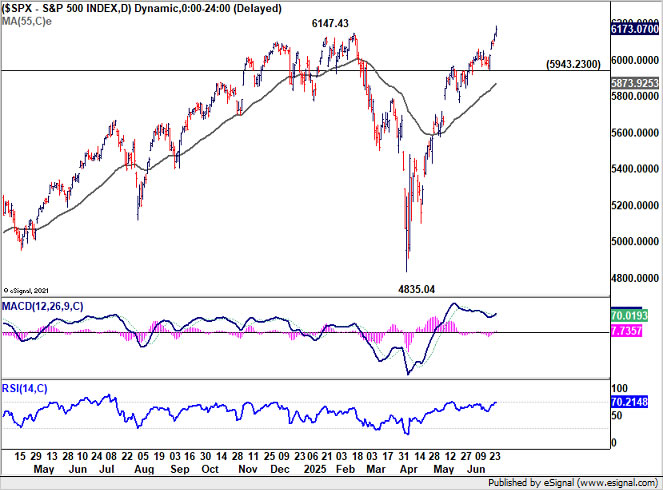
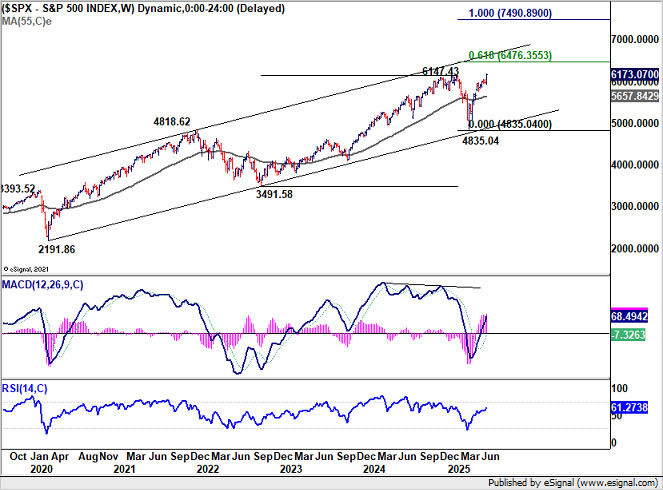
S&P 500 and NASDAQ rallied strongly to record levels, fueled by both easing bets and fading geopolitical risks. Technically, S&P 500's break of 6147.43 high with such ease is a surprise to us. Anyway, near term outlook will now stay bullish as long as 5943.23 support holds. Current up trend would target 61.8% projection of 3491.58 to 6147.43 from 4835.04 next.
Trade Tensions Resurface as Canada Hit Again by Tariff Threats
Attention is also shifting back to trade risks as the 90-day US tariff truce with major partners approaches its July 9 expiration. On Friday, President Trump abruptly announced the termination of all trade discussions with Canada in response to Ottawa’s digital services tax on US tech giants. Trump also pledged that a new tariff package targeting Canadian exports would be revealed within a week.
At the same time, Canada has insisted it will proceed with the tax despite furious response from the US. Finance Minister Champagne stressed that Parliament has passed the law and it will be enforced starting this Monday, applying retroactively to 2022.
For Canadian Dollar, the double blow of trade tensions and weak domestic data — with GDP contracting in both April and May — adds downside pressure. Loonie was the second-worst performer last week.
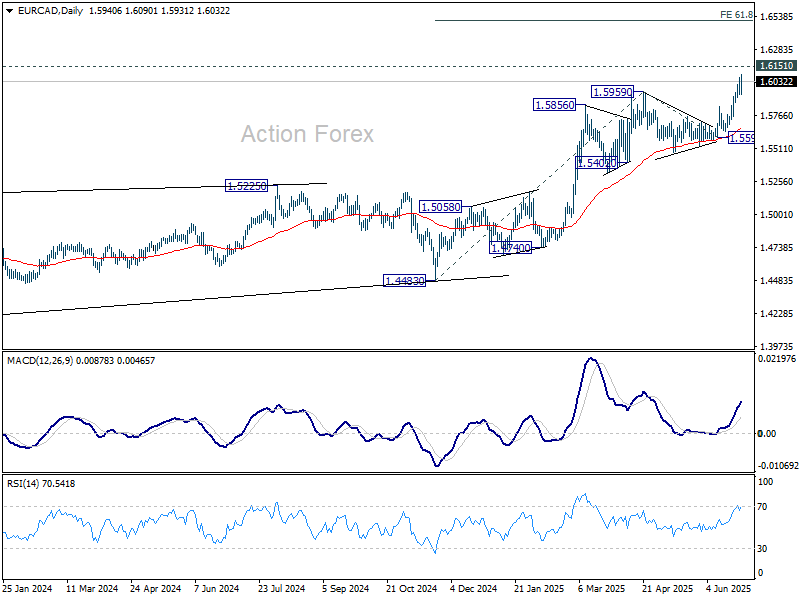
Technically, EUR/CAD's long term up trend resumed last week by breaking through 1.5959 resistance. Immediate focus is now on 1.6151 long term resistance (2018 higher). Decisive break there will pave the way to 61.8% projection of 1.4483 to 1.5959 from 1.5598 at 1.6510 next.
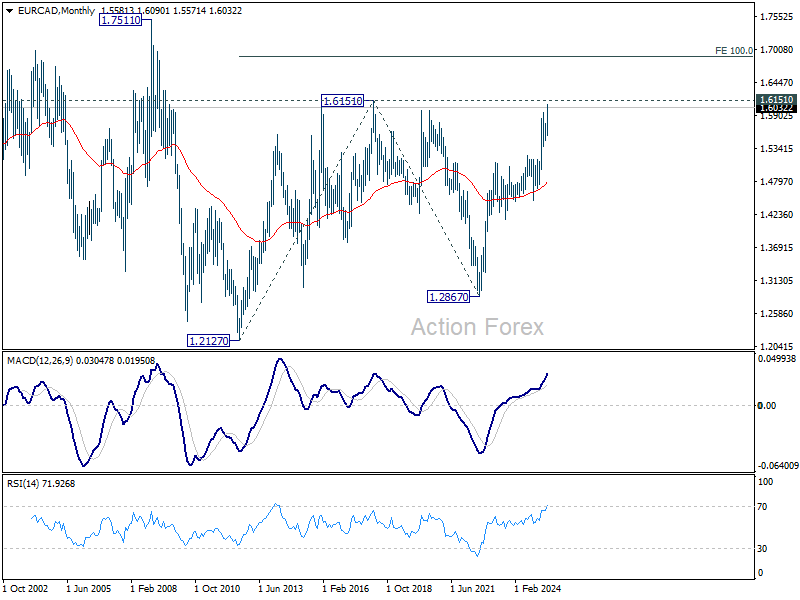
More importantly, that would also confirm resumption of whole up trend rise from 1.2127 (2021 low). Next medium term target would then be 100% projection of 1.2127 to 1.6151 from 1.2867 at 1.6891.
Euro Rally Broadens, but EUR/CHF Still Needs Breakout for Confirmation
Euro’s strength has broadened recently, driven by both narrowing policy differentials with the US and the continent’s historic fiscal pivot. Germany’s EUR 500B infrastructure fund, paired with broader NATO defense pledges, represent a structural shift. Besides, European NATO members committed last week to boosting defense spending to 5% of GDP by 2035, marking a generational investment wave.
And after all, it should be emphasized that Euro is probably the only viable liquidity alternative as investors "normalize" from their Dollar over-exposure accumulated in the past few years.
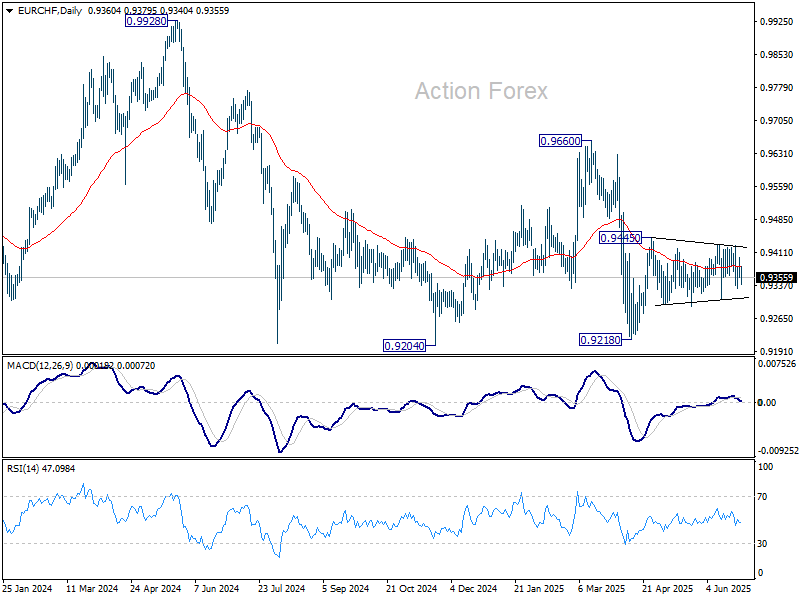
However, one pair that hasn’t confirmed Euro’s strength yet is EUR/CHF. The Franc remains resilient, despite Switzerland slipping into deflation and the SNB cutting rates to zero.
For Euro, EUR/CHF has to break through 0.9445 to resume the rise from 0.9218 to confirm that it's underlying buying is solid. Ideally, EUR/CHF should then break through 0.9660 key resistance to signal that a medium term up trend is underway.
EUR/USD Weekly Outlook
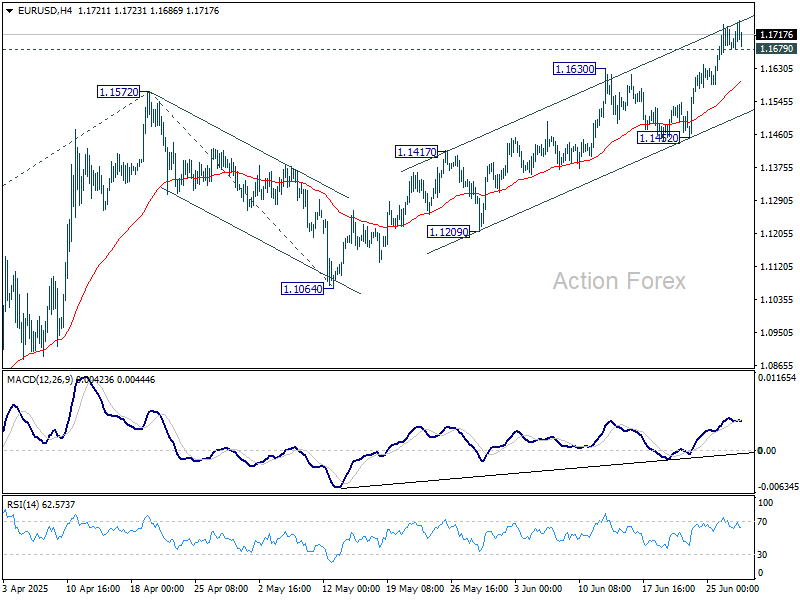
EUR/USD's up trend resumed last week and there is no clear sign of topping yet. Initial bias stays on the upside for 61.8% projection of 1.0176 to 1.1572 from 1.1064 at 1.1927. On the downside, below 1.1679 minor support will turn intraday bias neutral and bring consolidations. But downside should be contained above 1.1452 support to bring another rally.
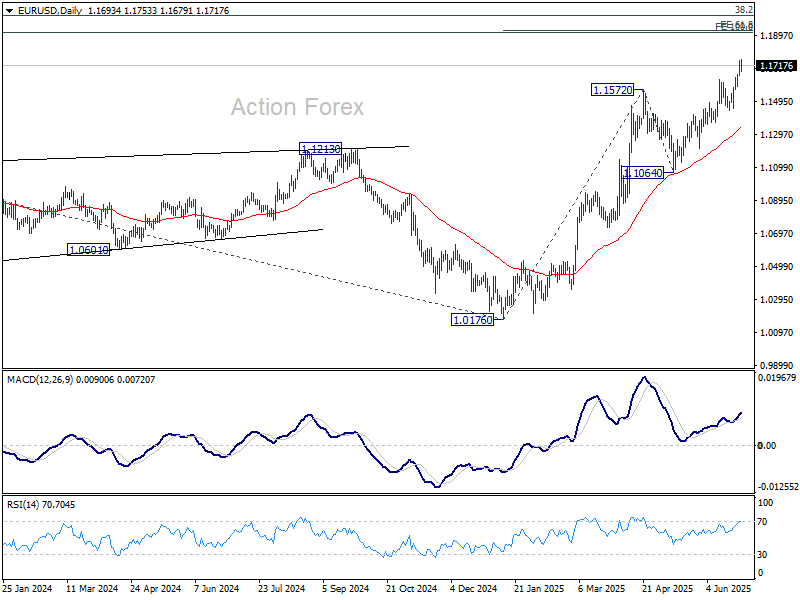
In the bigger picture, rise from 0.9534 long term bottom could be correcting the multi-decade downtrend or the start of a long term up trend. In either case, further rise should be seen to 100% projection of 0.9534 to 1.1274 from 1.0176 at 1.1916. This will now remain the favored case as long as 1.1604 support holds.
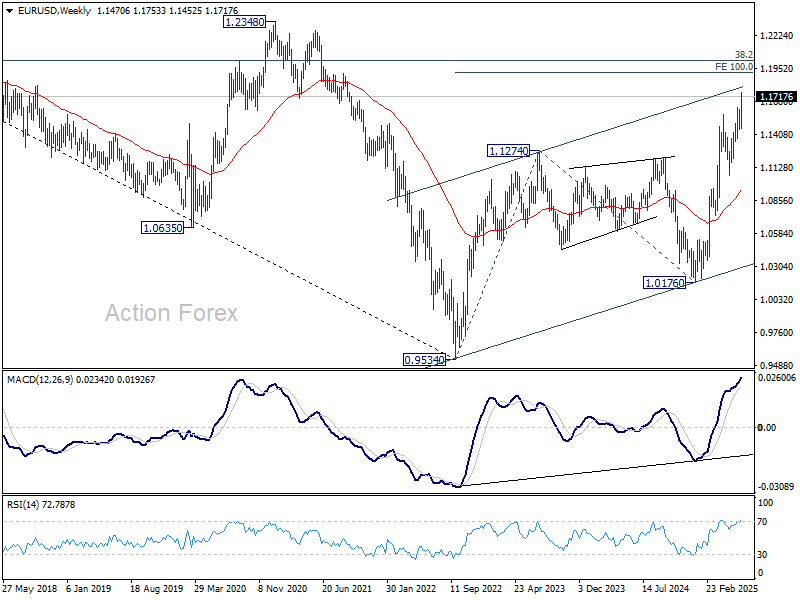
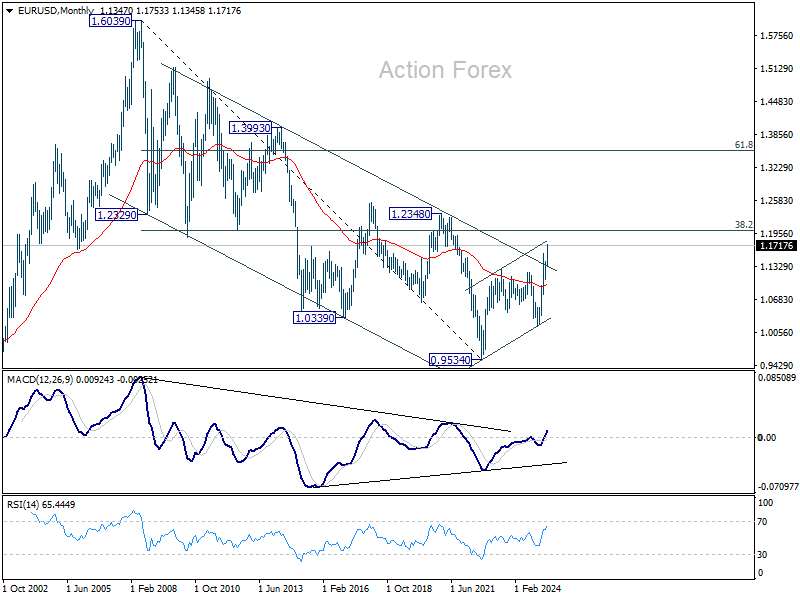
In the long term picture, a long term bottom was in place already at 0.9534, on bullish convergence condition in M MACD. Further rise should be seen to 38.2% retracement of 1.6039 to 0.9534 at 1.2019. Rejection by 1.2019 will keep the price actions from 0.9534 as a corrective pattern. But sustained break of 1.2019 will suggest long term bullish trend reversal, and target 61.8% retracement at 1.3554.
EUR/USD Weekly Outlook
EUR/USD's up trend resumed last week and there is no clear sign of topping yet. Initial bias stays on the upside for 61.8% projection of 1.0176 to 1.1572 from 1.1064 at 1.1927. On the downside, below 1.1679 minor support will turn intraday bias neutral and bring consolidations. But downside should be contained above 1.1452 support to bring another rally.
In the bigger picture, rise from 0.9534 long term bottom could be correcting the multi-decade downtrend or the start of a long term up trend. In either case, further rise should be seen to 100% projection of 0.9534 to 1.1274 from 1.0176 at 1.1916. This will now remain the favored case as long as 1.1604 support holds.
In the long term picture, a long term bottom was in place already at 0.9534, on bullish convergence condition in M MACD. Further rise should be seen to 38.2% retracement of 1.6039 to 0.9534 at 1.2019. Rejection by 1.2019 will keep the price actions from 0.9534 as a corrective pattern. But sustained break of 1.2019 will suggest long term bullish trend reversal, and target 61.8% retracement at 1.3554.