Sample Category Title
USD/JPY Weekly Outlook
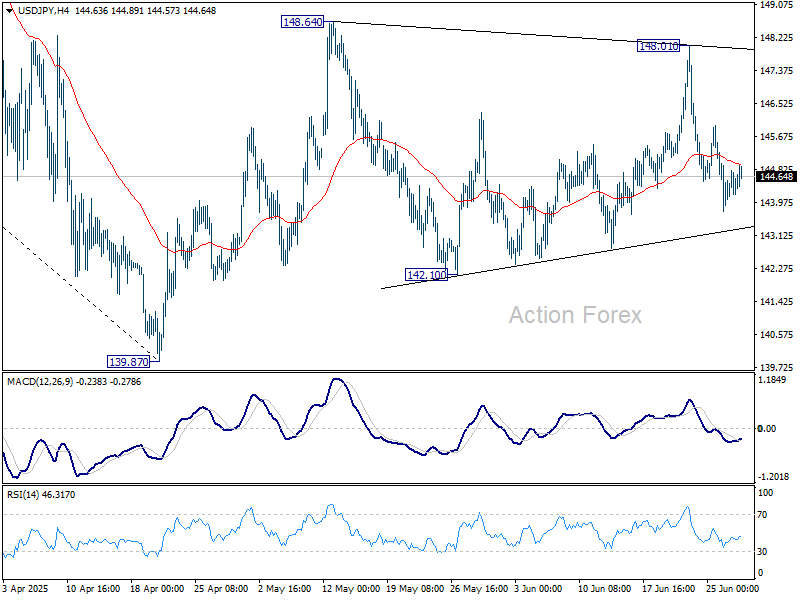
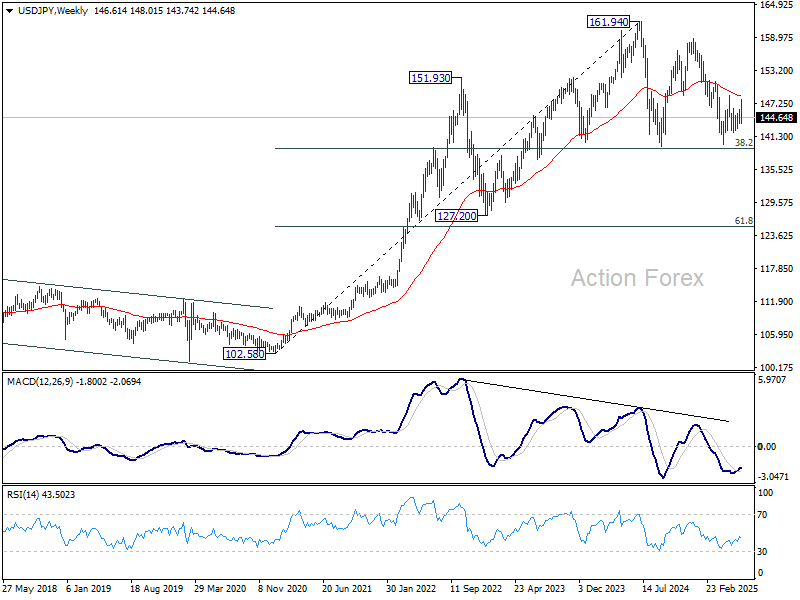
USD/JPY spiked higher to 148.01 last week but reversed sharply from there. After all, it's staying in range of 142.10/148.64. Initial bias remains neutral this week first. On the upside, firm break of 148.64 will resume the rise from 139.87 to 61.8% retracement of 158.86 to 139.87 at 151.22. However, break of 142.10 will bring deeper fall back to retest 139.87 low.
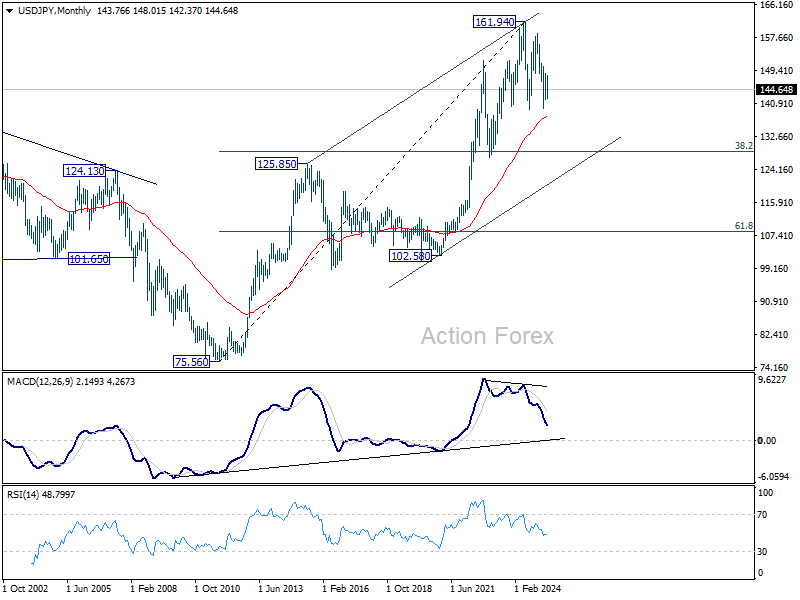
In the bigger picture, price actions from 161.94 are seen as a corrective pattern to rise from 102.58 (2021 low), with fall from 158.86 as the third leg. Strong support should be seen from 38.2% retracement of 102.58 to 161.94 at 139.26 to bring rebound. However, sustained break of 139.26 would open up deeper medium term decline to 61.8% retracement at 125.25.
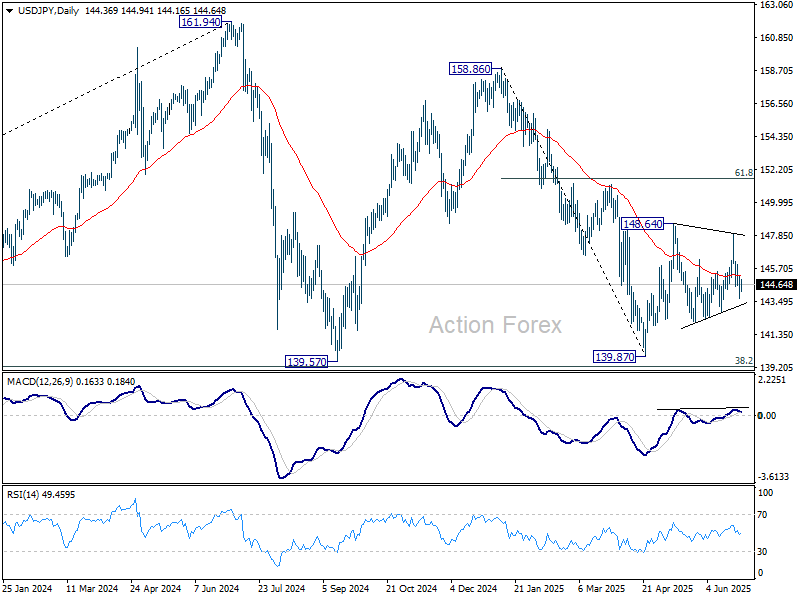
In the long term picture, it's still early to conclude that up trend from 75.56 (2011 low) has completed. A medium term corrective phase should have commenced, with risk of deep correction towards 55 M EMA (now at 137.72) and even below.
GBP/USD Weekly Outlook
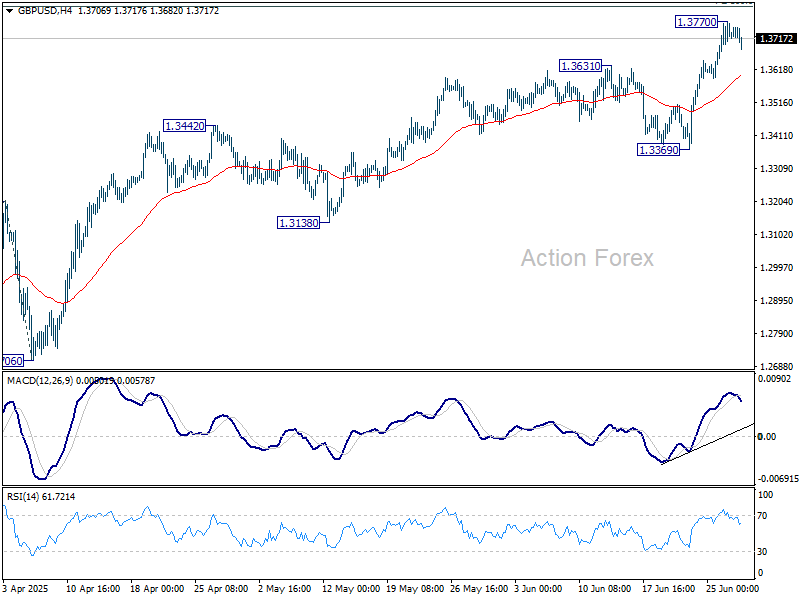
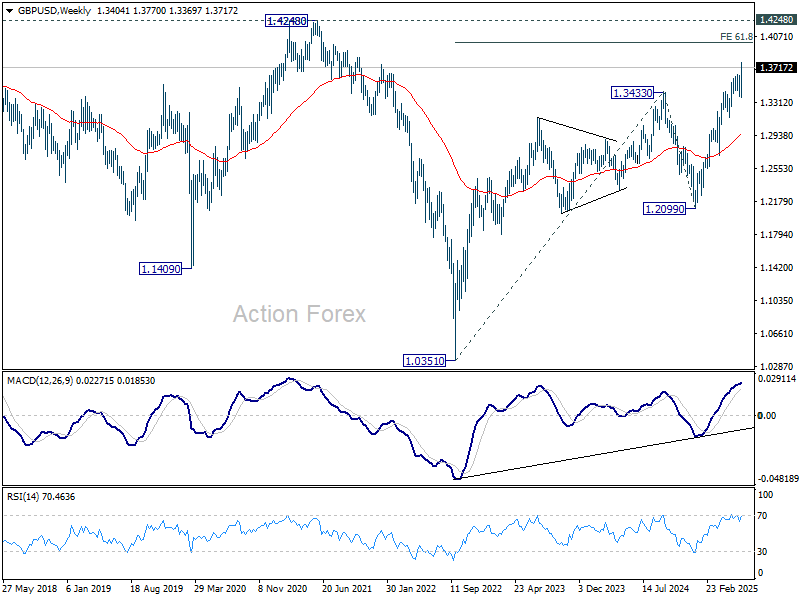
GBP/USD's up trend resumed last week and hit as high as 1.3770, but retreated since then. Initial bias is turned neutral this week for some consolidations. But downside should be contained above 1.3369 support to bring another rally. Above 1.3770 will target 100% projection of 1.2099 to 1.3206 from 1.3138 at 1.3813.
In the bigger picture, up trend from 1.3051 (2022 low) is in progress. Next medium term target is 61.8% projection of 1.0351 to 1.3433 from 1.2099 at 1.4004. Outlook will now stay bullish as long as 55 W EMA (now at 1.2960) holds, even in case of deep pullback.
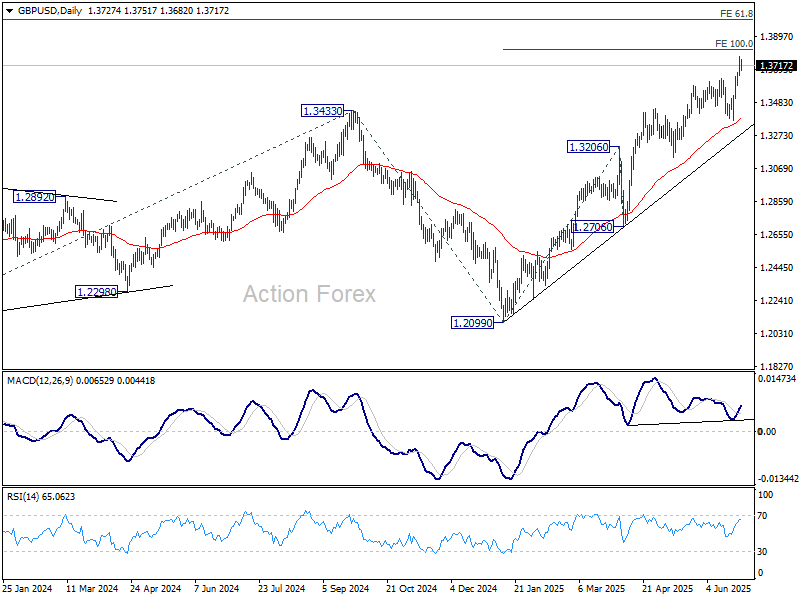
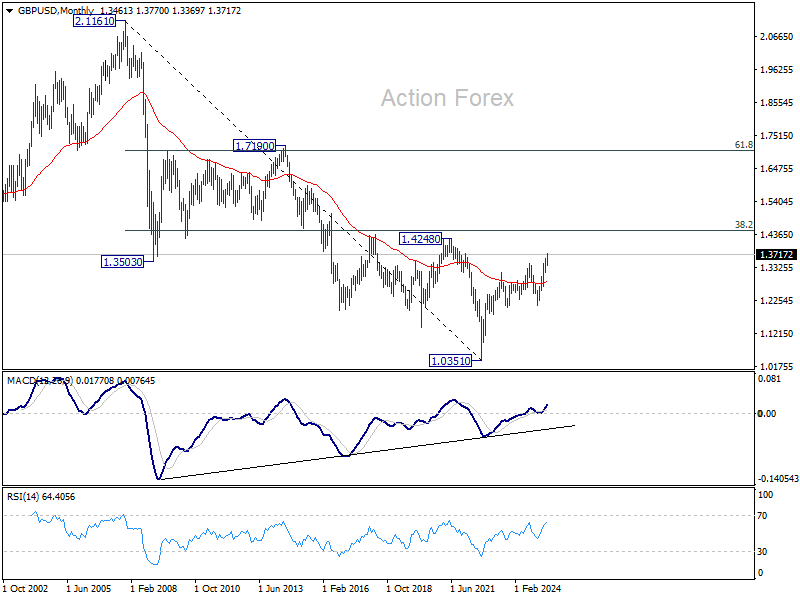
In the long term picture, for now, price actions from 1.0351 (2022 low) are still seen as a corrective pattern to the long term down trend from 2.1161 (2007 high) only. However, firm break of 1.4248 resistance (38.2% retracement of 2.1161 to 1.0351 at 1.4480) will be a strong sign of long term bullish reversal.
USD/CHF Weekly Outlook
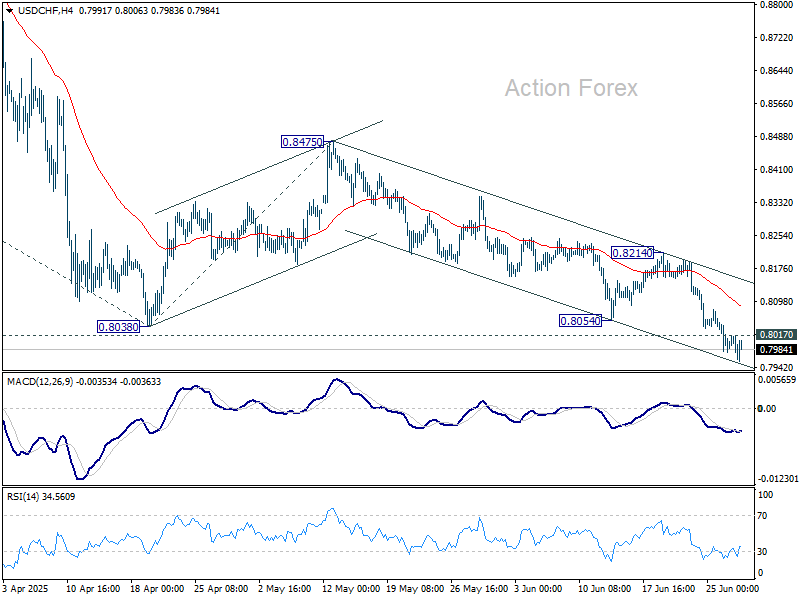
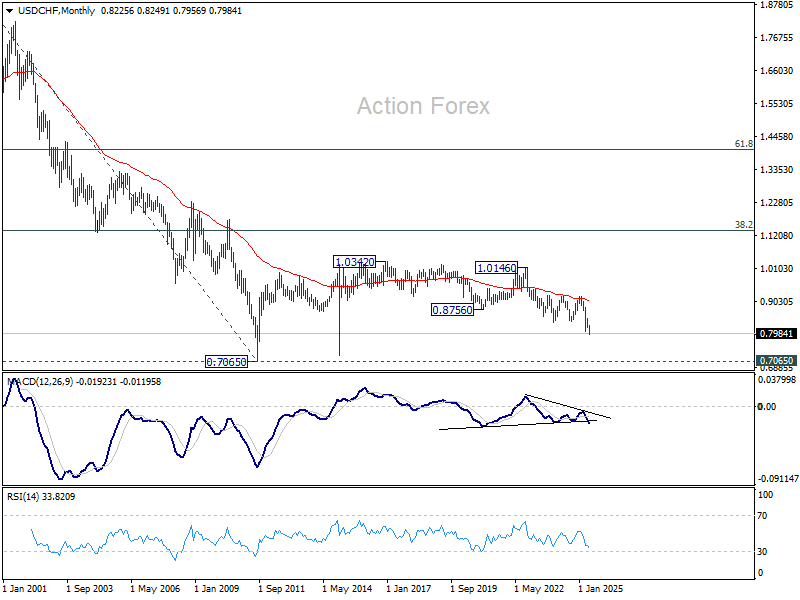
USD/CHF's break of 0.8038 low last week confirms down trend resumption. Initial bias stays on the downside this week for 61.8% projection of 0.9200 to 0.8038 from 0.8475 at 0.7757 next. On the upside, above 0.8017 minor resistance will turn intraday bias neutral and bring consolidations. But recovery should be limited below 0.8214 resistance to bring another fall.
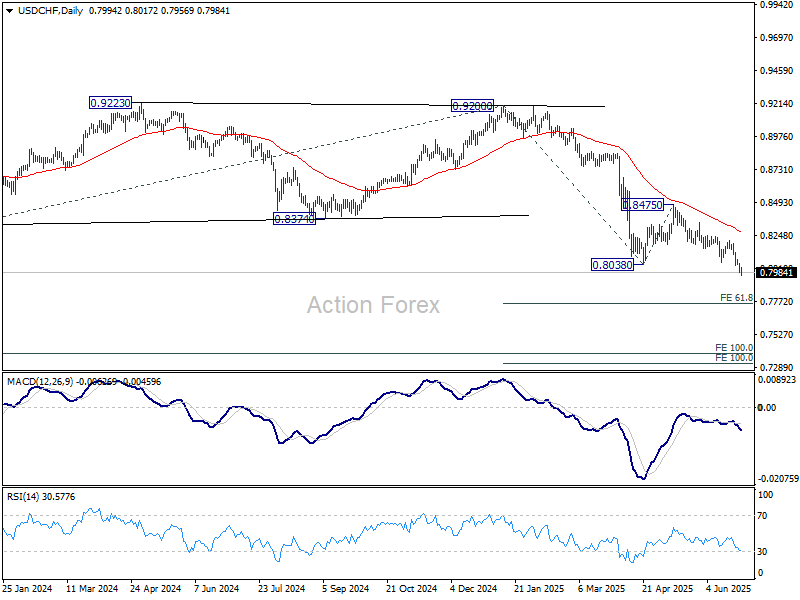
In the bigger picture, long term down trend from 1.0342 (2017 high) is still in progress. Next target is 100% projection of 1.0146 (2022 high) to 0.8332 from 0.9200 at 0.7382. In any case, outlook will stay bearish as long as 0.8475 resistance holds.
In the long term picture, price action from 0.7065 (2011 low) are seen as a corrective pattern to the multi-decade down trend from 1.8305 (2000 high). It's uncertain if the fall from 1.0342 is the second leg of the pattern, or resumption of the down trend. But in either case, outlook will stay bearish as long as 0.9200 resistance holds. Retest of 0.7065 should be seen next.

AUD/USD Weekly Report
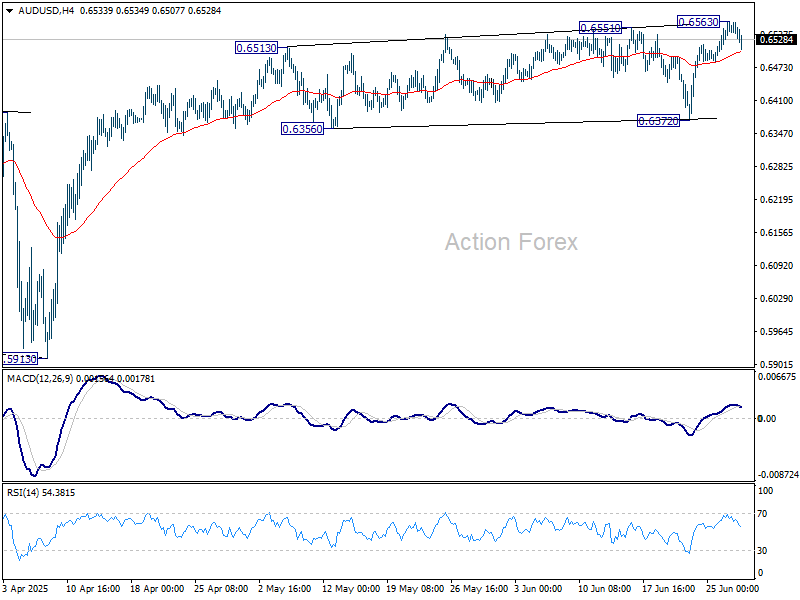
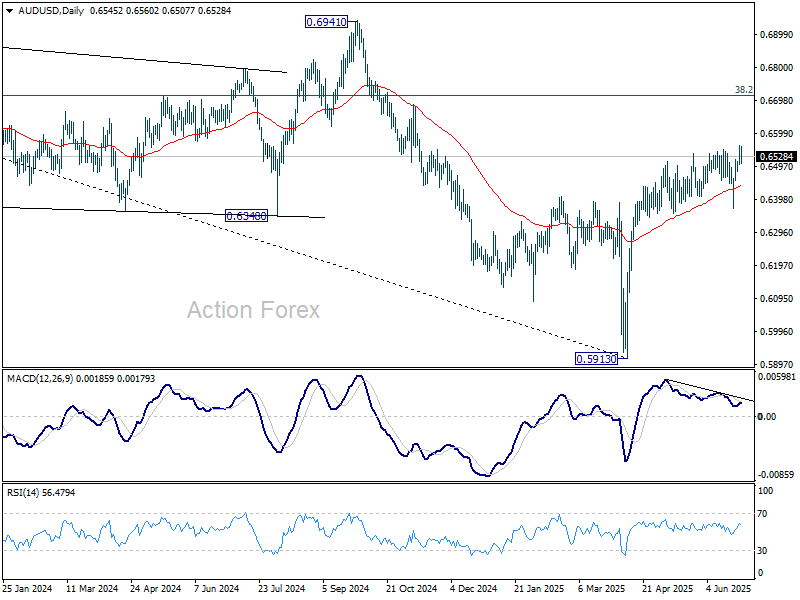
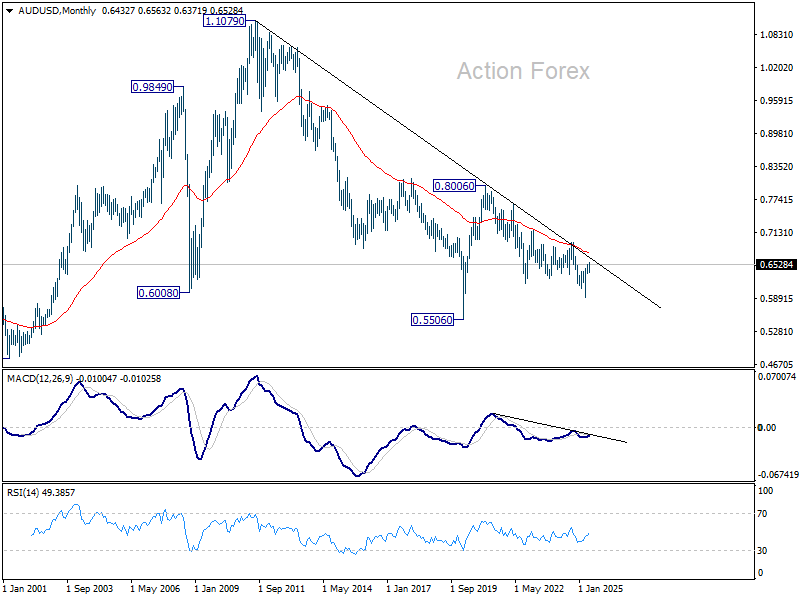
AUD/USD edged higher to 0.6563 last week but retreated since then. Initial bias is turned neutral this week for consolidations. Near term outlook will stay bullish as long as 0.6372 support holds. Above 0.6563 will resume the rally from 0.51913 to 0.6713 fibonacci level.
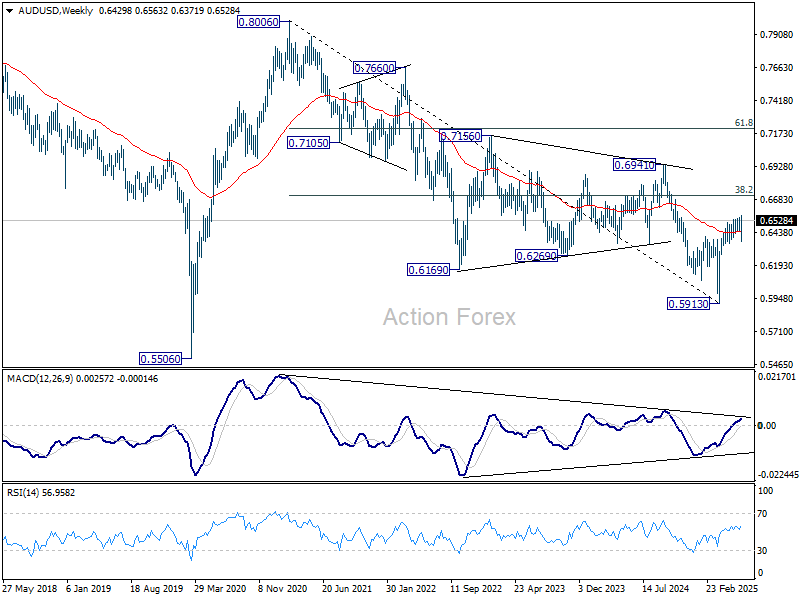
In the bigger picture, there is no clear sign that down trend from 0.8006 (2021 high) has completed. Rebound from 0.5913 is seen as a corrective move. While stronger rally cannot be ruled out, outlook will remain bearish as long as 38.2% retracement of 0.8006 to 0.5913 at 0.6713 holds. Nevertheless, considering bullish convergence condition in W MACD, even in case of another fall through 0.5913, downside should be contained above 0.5506 (2020 low).
In the long term picture, fall from 0.8006 is seen as the second leg of the corrective pattern from 0.5506 long term bottom (2020 low). Hence, in case of deeper decline, strong support should emerge above 0.5506 to contain downside to bring reversal. On the upside, firm break of 0.6941 will argue that the third leg has already started back to 0.8006.
USD/CAD Weekly Outlook
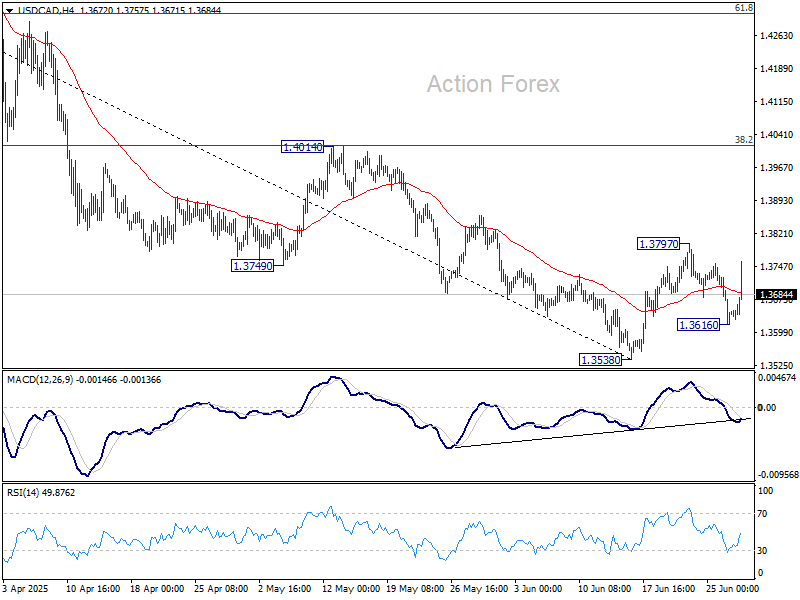
USD/CAD retreated after edging higher to 1.3797 last week but rebounded strongly since then. Initial bias is turned neutral this week first. On the upside, break of 1.3797 will resume the rebound from 1.3538 short term bottom to 1.4014 cluster resistance (38.2% retracement of 1.4791 to 1.3538 at 1.4017). Nevertheless, below 1.3616 will bring retest of 1.3538 low.
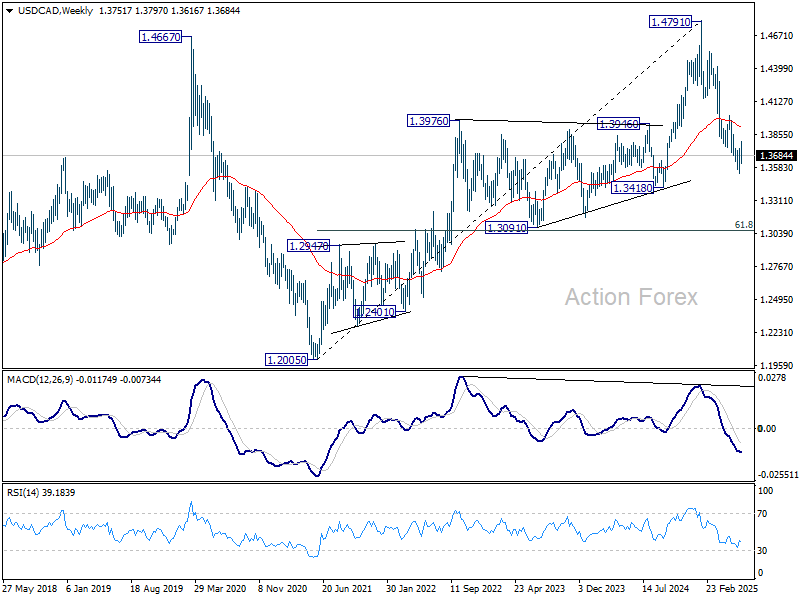
In the bigger picture, price actions from 1.4791 medium term top could either be a correction to rise from 1.2005 (2021 low), or trend reversal. In either case, further decline is expected as long as 1.4014 resistance holds. Next target is 61.8% retracement of 1.2005 (2021 low) to 1.4791 at 1.3069.

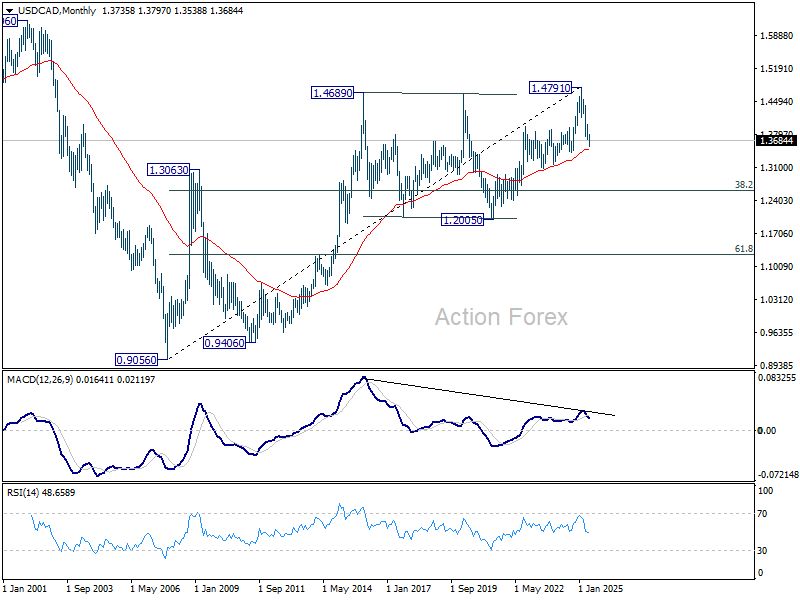
In the long term picture, as long as 55 M EMA (now at 1.3494) holds, up trend from 0.9056 (2007 low) should still resume through 1.4791 at a later stage. However, sustained trading below 55 M EMA will argue that the up trend has already completed, with rise from 1.2005 to 1.4791 as the fifth wave. 1.4791 would then be seen as a long term top and deeper medium term down trend should then follow.
GBP/JPY Weekly Outlook
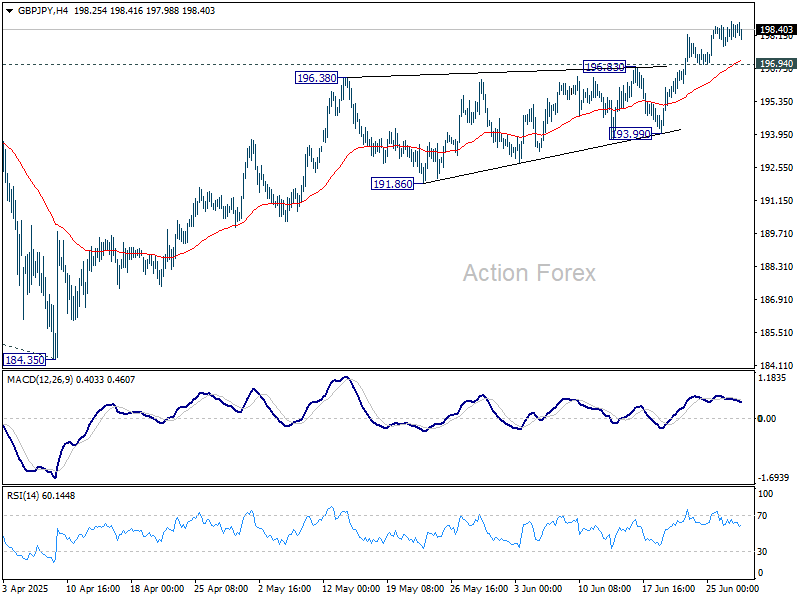
GBP/JPY rally from 184.35 resumed last week. Despite diminishing momentum as seen in 4H MACD, there is no clear sign of topping yet. Initial bias stays on the upside this week for 199.79 resistance. Break there will target 100% projection of 180.00 to 199.79 from 184.35 at 204.14. On the downside, below 196.94 minor support will turn intraday bias neutral and bring consolidations. But near term outlook will stay bullish as long as 193.99 support holds, in case of retreat.
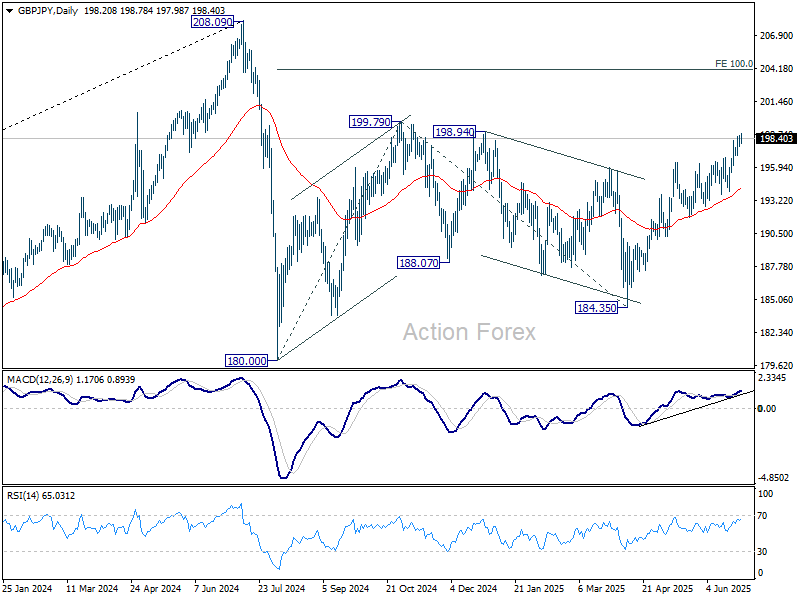
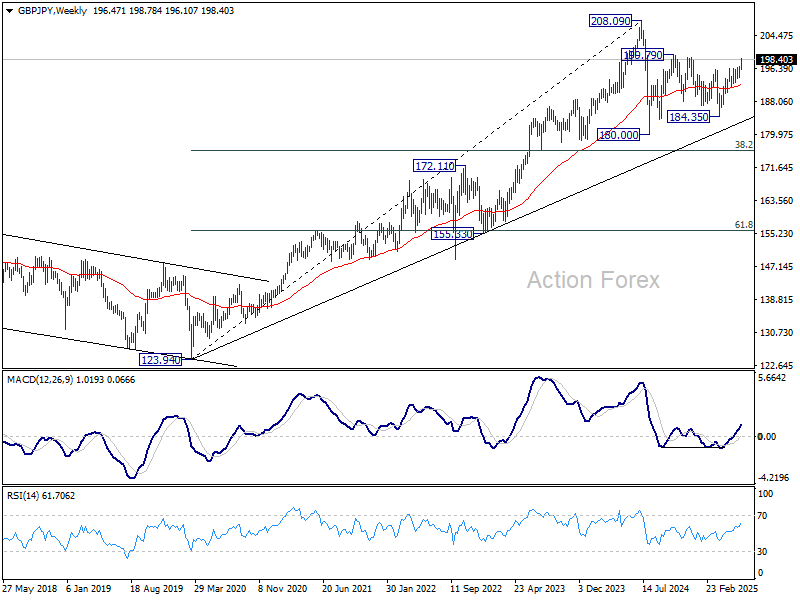
In the bigger picture, price actions from 208.09 are seen as a correction to rally from 123.94 (2020 low). Strong support should be seen from 38.2% retracement of 123.94 to 208.09 at 175.94 to contain downside. However, sustained break of 175.94 will bring deeper fall even still as a correction.
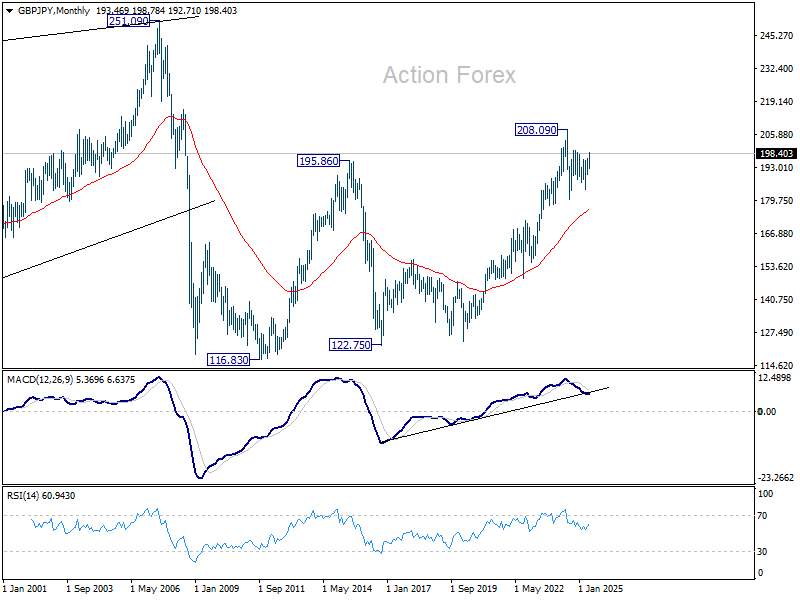
In the longer term picture, while a medium term top was formed at 208.09 (2024 high), it's still early to conclude that the up trend from 122.75 (2016 low) has completed. But GBP/JPY is at least in a medium term corrective phase, with risk of correction to 55 M EMA (now at 176.62).
EUR/JPY Weekly Outlook
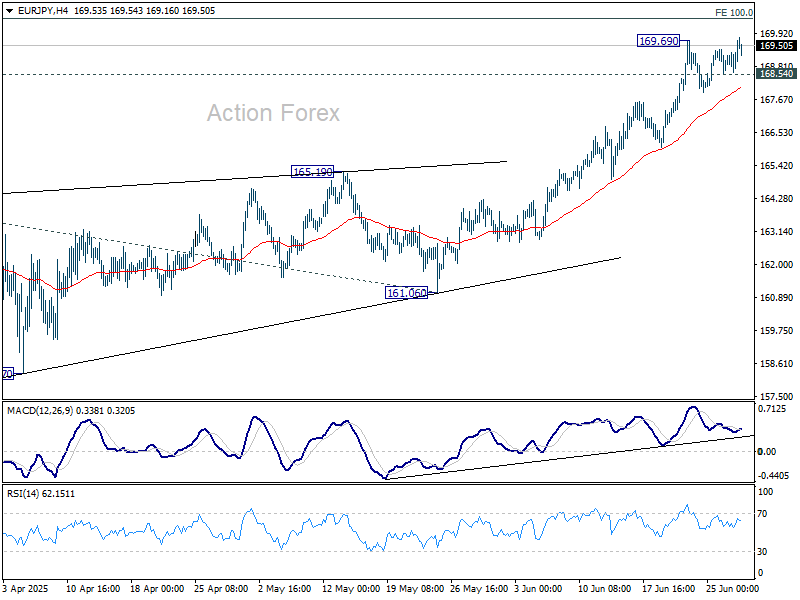
EUR/JPY's rally from 154.77 continued last week and the late breach of 169.69 temporary top suggests that it's resuming after brief retreat. Initial bias is now on the upside this week for 100% projection of 154.77 to 164.16 from 161.06 at 170.45. Break there will target 138.2% projection at 174.03. On the downside, below 168.54 minor support will turn intraday bias neutral again and bring more consolidations.
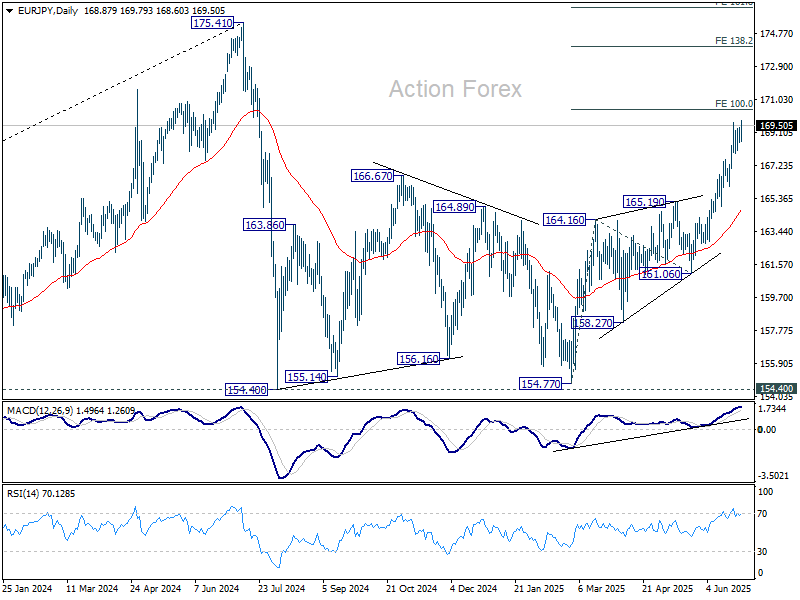
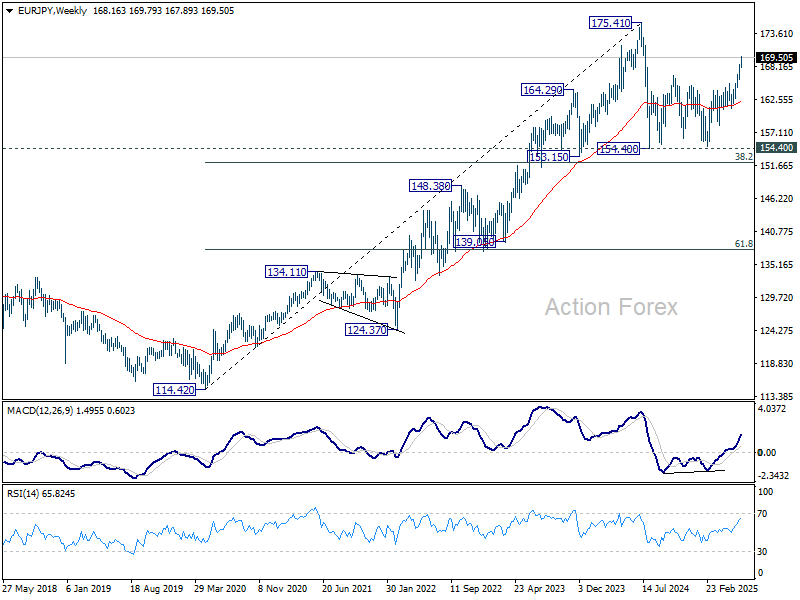
In the bigger picture, price actions from 175.41 are seen as correction to up trend from 114.42 (2020 low). Strong support should be seen from 38.2% retracement of 114.42 to 175.41 at 152.11 to contain downside. However, sustained break of 152.11 will bring deeper fall even still as a correction.
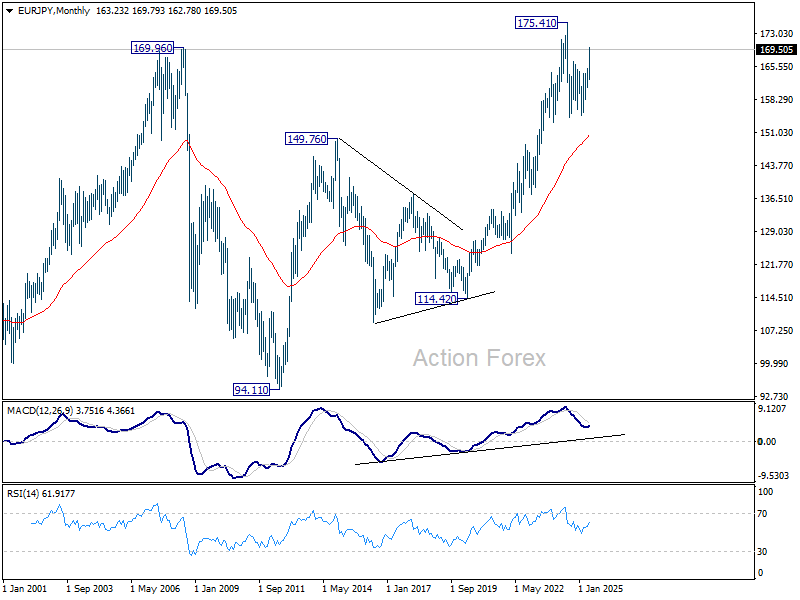
In the long term picture, while 175.41 is at least a medium term top, it's still early to conclude that up trend from 94.11 (2012 low) has completed. A medium term corrective phase is in progress with risk of deeper fall back to 55 M EMA (now at 150.56).
EUR/GBP Weekly Outlook
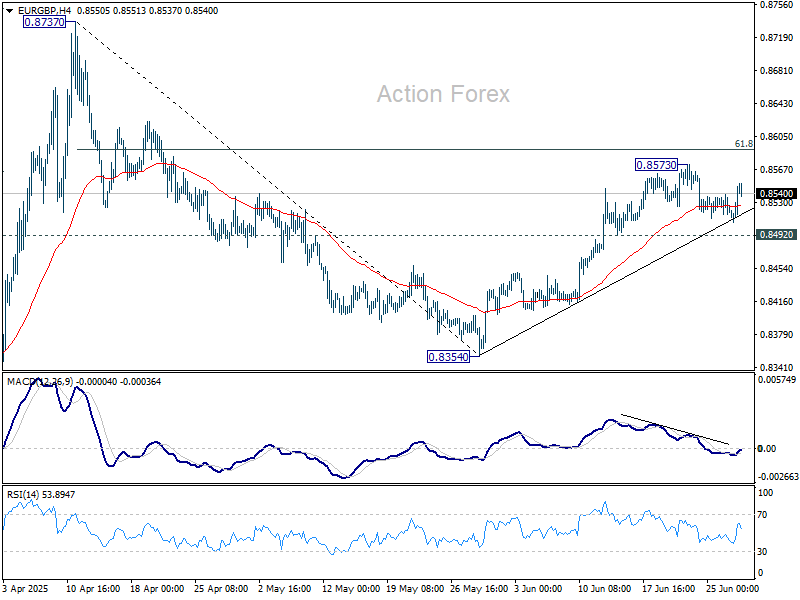
EUR/GBP edged higher to 0.8573 last week but retreated since then. Initial bias stays neutral this week for more consolidations. Further rally is expected as long as 0.8492 support holds. Above 0.8573 will target 61.8% retracement of 0.8737 to 0.8354 at 0.8591. Sustained break there will pave the way to 0.8737 resistance. However, firm break of 0.8492 will argue that rebound from 0.8354 has completed, and turn bias back to the downside.
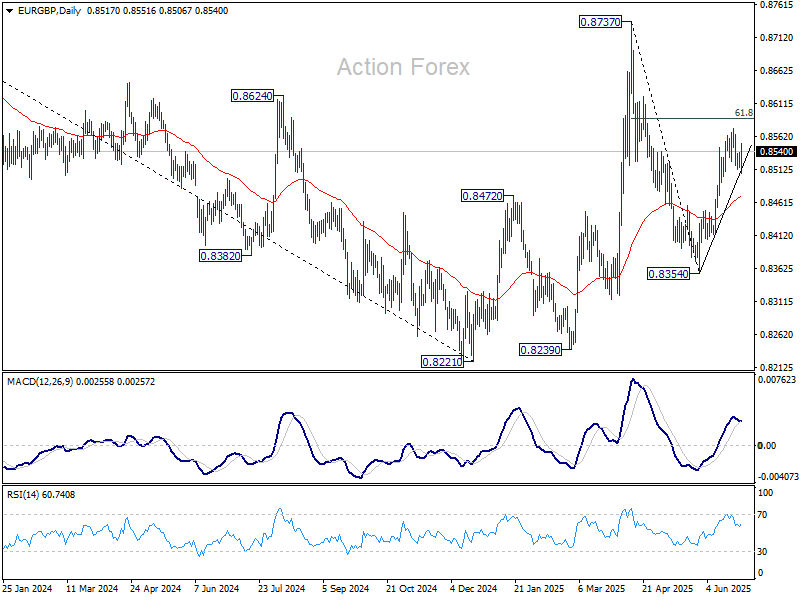
In the bigger picture, price actions from 0.8221 medium term bottom are seen as forming a corrective pattern to the down trend from 0.9267 (2022 high). Nevertheless, there is no clear momentum to break through 0.8201 key support (2022 low) yet. Hence, range trading is expected between 0.8221/8737 for now.
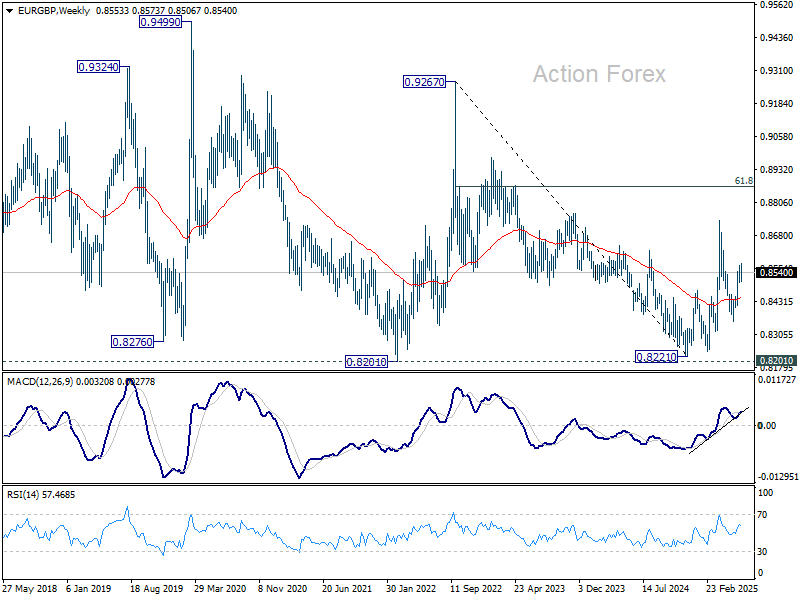
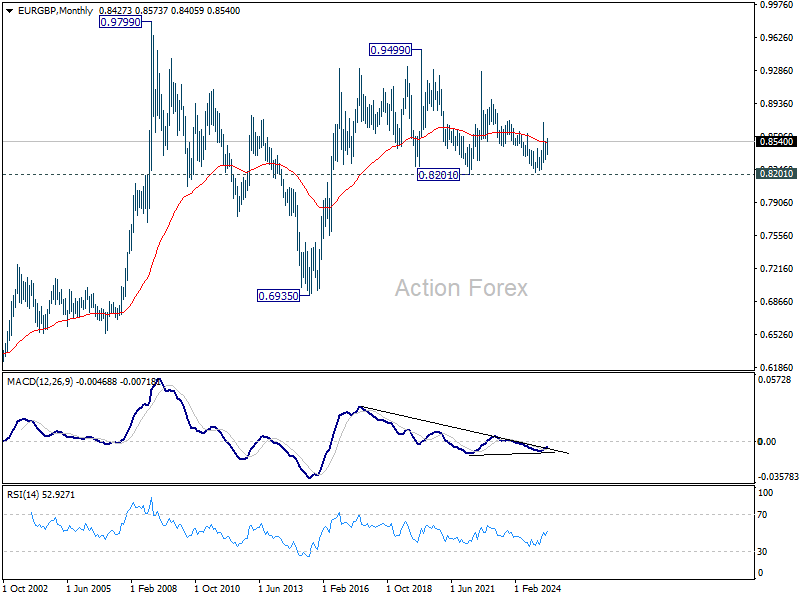
In the long term picture, price action from 0.9499 (2020 high) is seen as part of the long term range pattern from 0.9799 (2008 high). Range trading should continue between 0.8201 and 0.9499, until there is clear signal of imminent breakout.
EUR/AUD Weekly Outlook
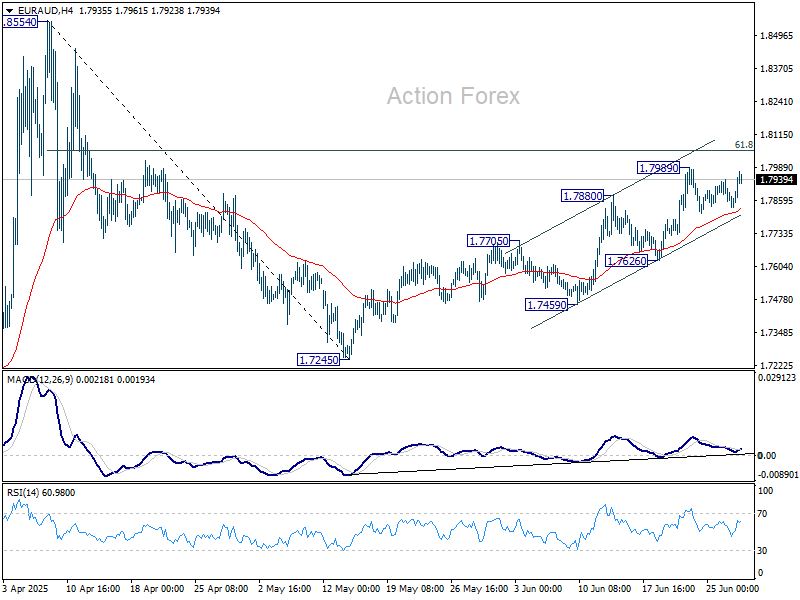
EUR/AUD edged higher to 1.7989 last week but turned sideway since then. Initial bias stays neutral this week first, and further rally is expected as long as 1.7626 support holds. Above 1.7989 will target 61.8% retracement of 1.8554 to 1.7245 at 1.8054. Sustained break there will pave the way to 1.8554.
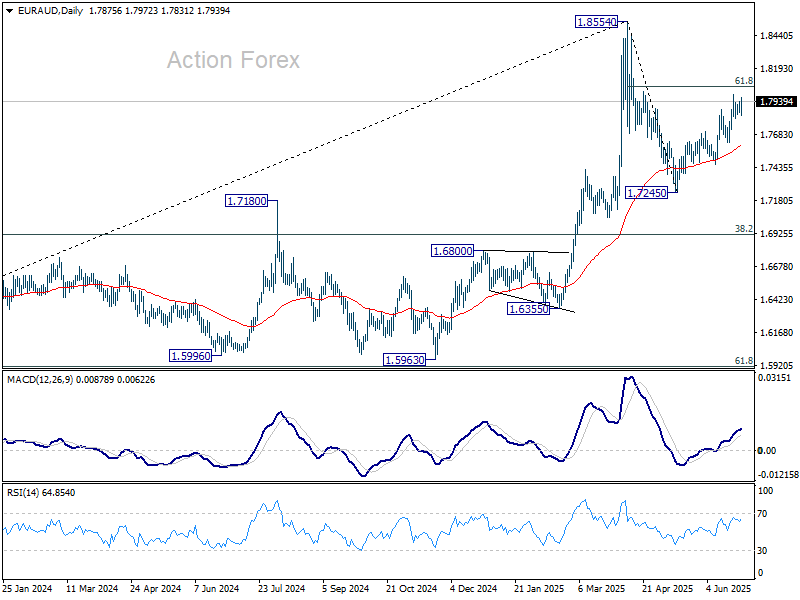
In the bigger picture, price actions from 1.8554 medium term are seen as a corrective pattern. While deeper pullback might be seen, downside should be contained by 38.2% retracement of 1.4281 (2022 low) to 1.8554 at 1.6922 to bring rebound. Up trend from 1.4281 is expected to resume at a later stage.
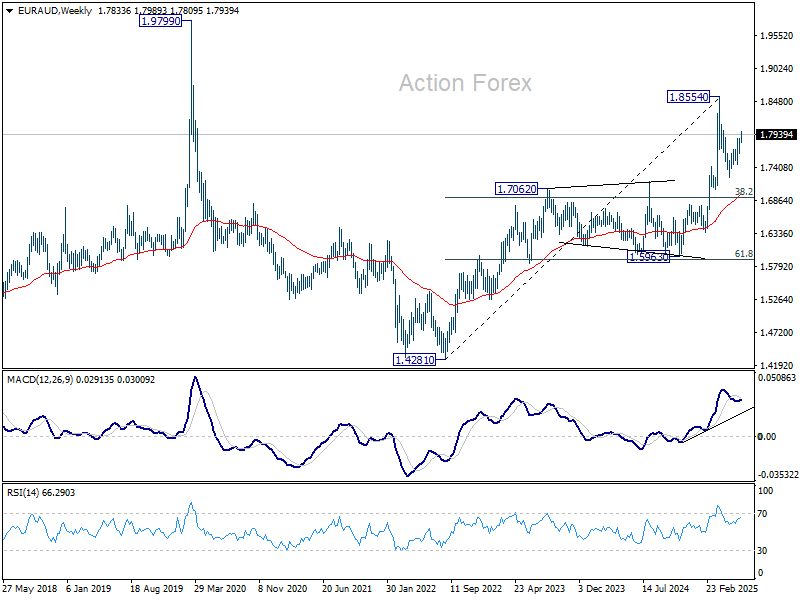
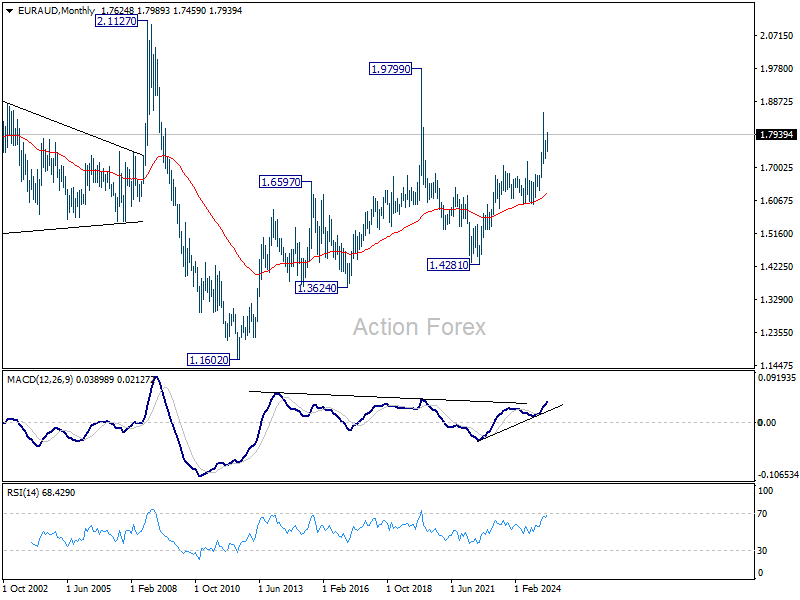
In the longer term picture, rise from 1.4281 is seen as the second leg of the pattern from 1.9799 (2020 high), which is part of the pattern from 2.1127 (2008 high). As long as 55 M EMA (now at 1.6303) holds, this second leg could still extend higher.
EUR/CHF Weekly Outlook
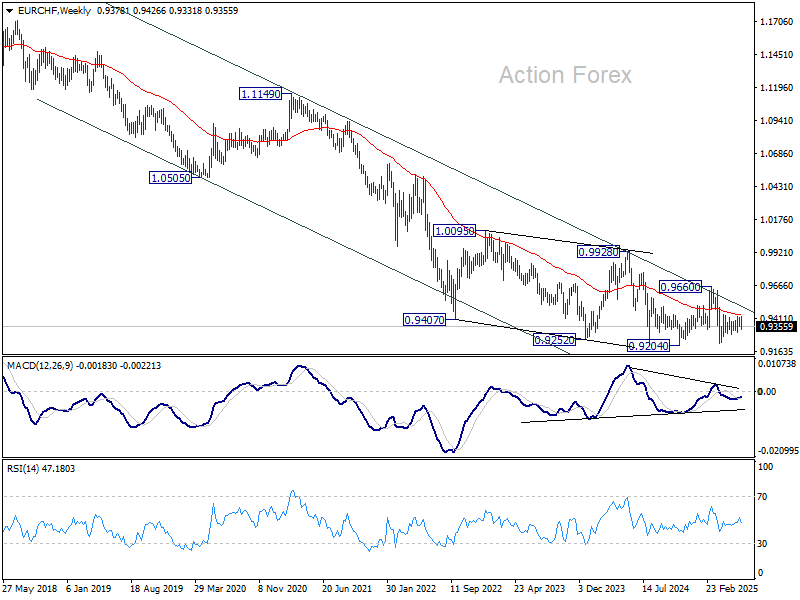
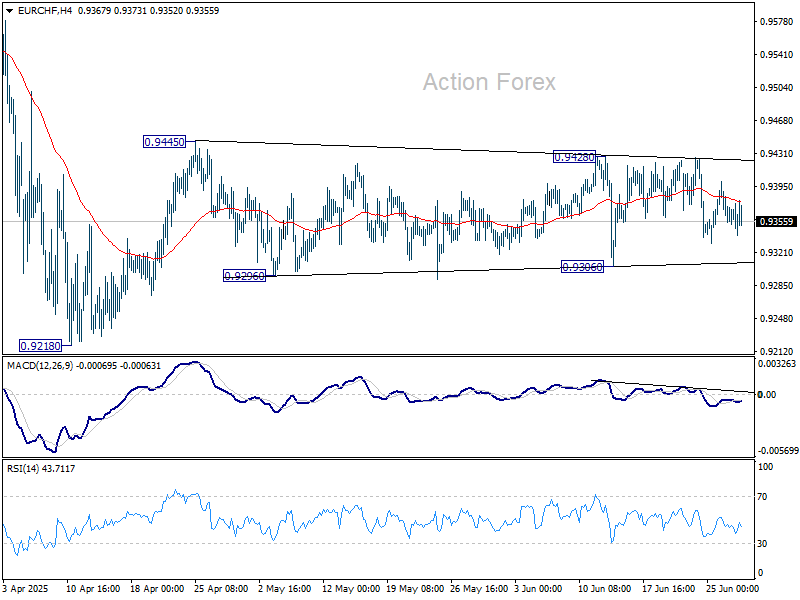
Sideway trading continued in EUR/CHF last week and outlook is unchanged. Initial bias stays neutral this week first, and further rally is mildly in favor as long as 0.9306 support holds. On the upside, break of 0.9428/45 resistance zone will resume the rebound from 0.9218. On the downside, break of 0.9306 will bring retest of 0.9218 low instead.
In the bigger picture, while downside momentum has been diminishing as seen in W MACD, there is no sign of bottoming yet. EUR/CHF is still staying below 55 W EMA and well inside long term falling channel. Outlook will stay bearish as long as 0.9660 resistance holds. Break of 0.9204 (2024 low) will confirm resumption of down trend from 1.2004 (2018 high).
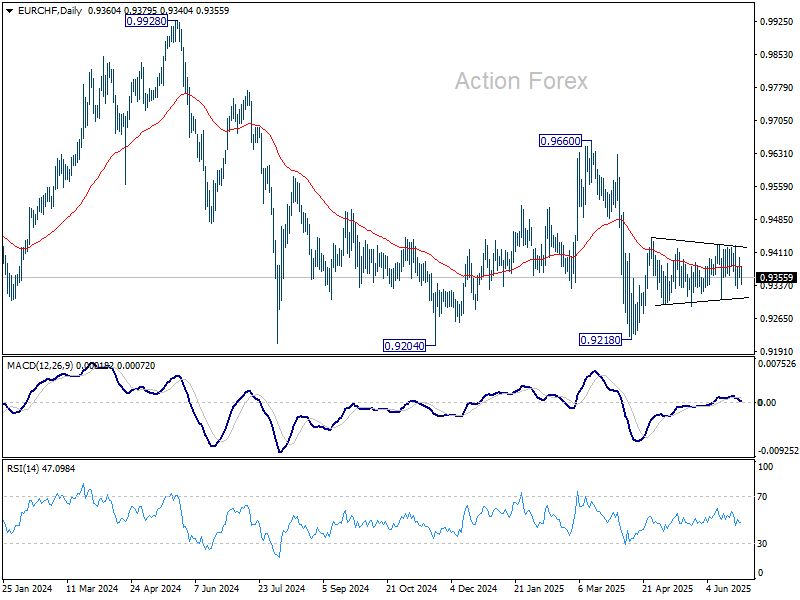
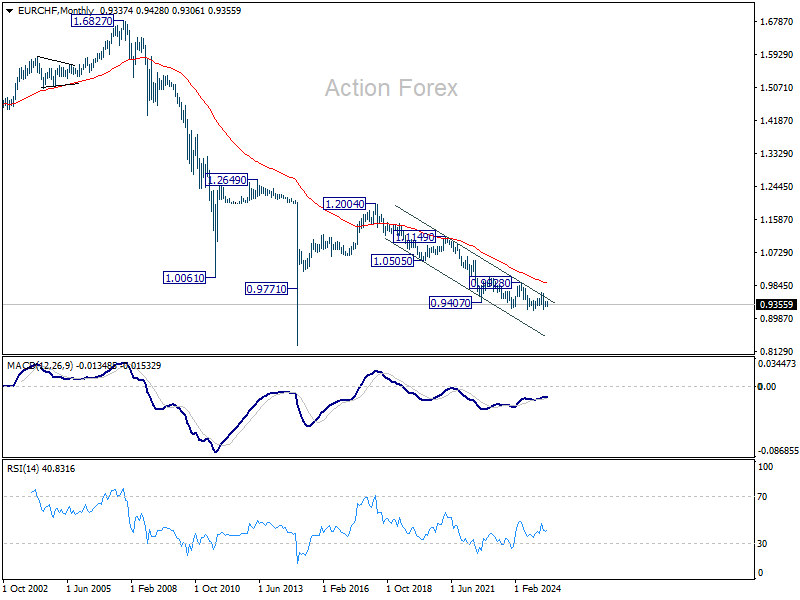
In the long term picture, overall long term down trend is still in progress in EUR/CHF. Outlook will continue to stay bearish as long as 55 M EMA (now at 0.9901) holds.