Sample Category Title
Middle East De-Escalation Supported Risk Appetite, Hurting Dollar
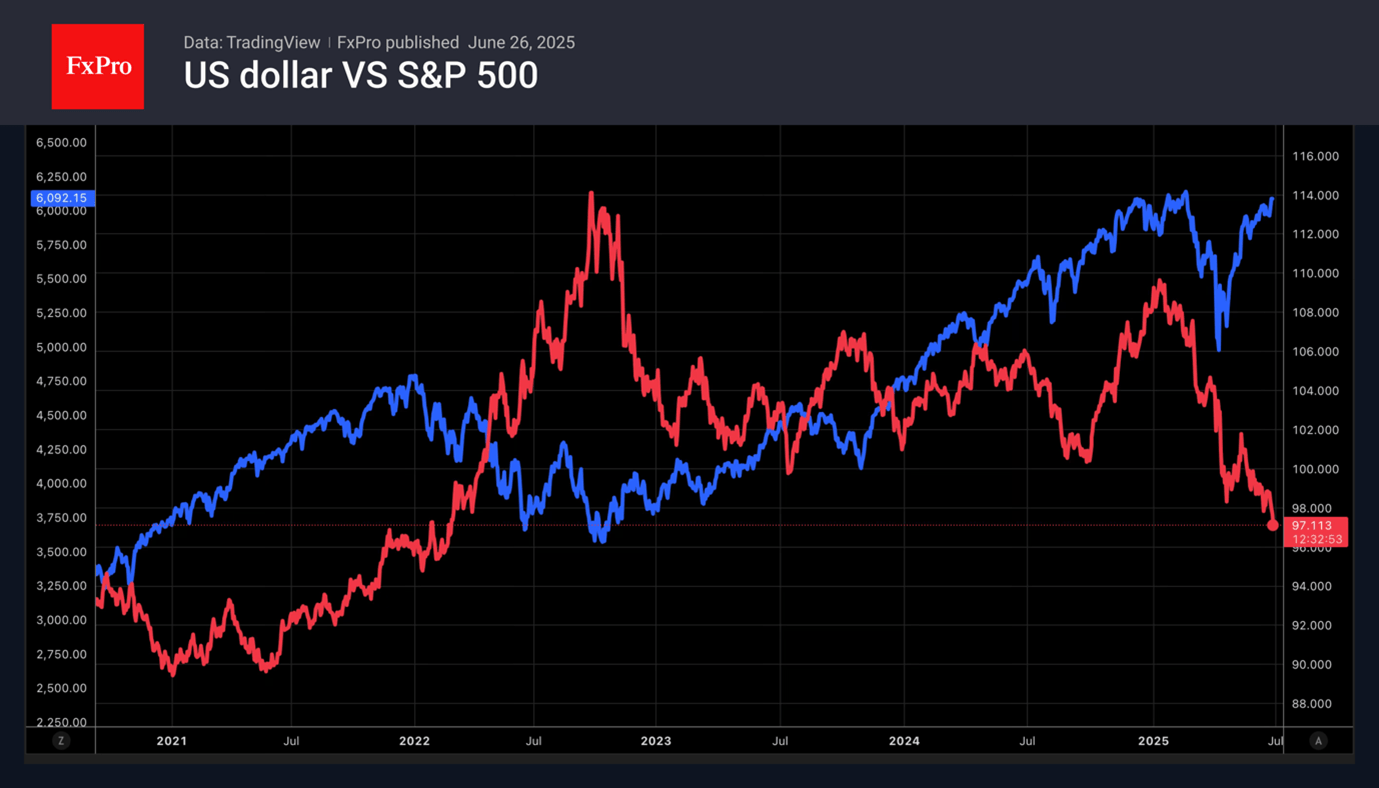
The conflict in the Middle East has restored the US dollar’s status as a safe-haven asset, but that has also been its downfall. The inverse correlation with US stock indices amid growing global risk appetite has caused the USD index to hit three-year lows. Investors perceive the ceasefire as the end of the Twelve-Day War between Israel and Iran and are buying stocks.
Carry traders are actively using the US dollar as a funding currency. Since the beginning of the year, its effectiveness in arbitrage against a basket of emerging market currencies has exceeded 8%. The use of the yen in carry trades has yielded just over 2%, while the euro and Swiss franc have been unprofitable.
The weakening of the US dollar is part of the White House’s plans. Donald Trump is putting pressure on the central bank to lower rates by 2 to 2.5 percentage points. The president intends to name Jerome Powell’s successor ahead of schedule, as early as this autumn. The emergence of a shadow Fed chair will put pressure on the USD index.
Stock indices
The de-escalation of the conflict in the Middle East brought the S&P 500 closer to record highs. A new wave of interest in artificial intelligence has allowed the Nasdaq 100 to update its historical peaks. The growth of US stock indices at the end of June is being called a rally of tech giants. NVIDIA has surpassed Microsoft in terms of market capitalisation, again becoming the most expensive company in the world.
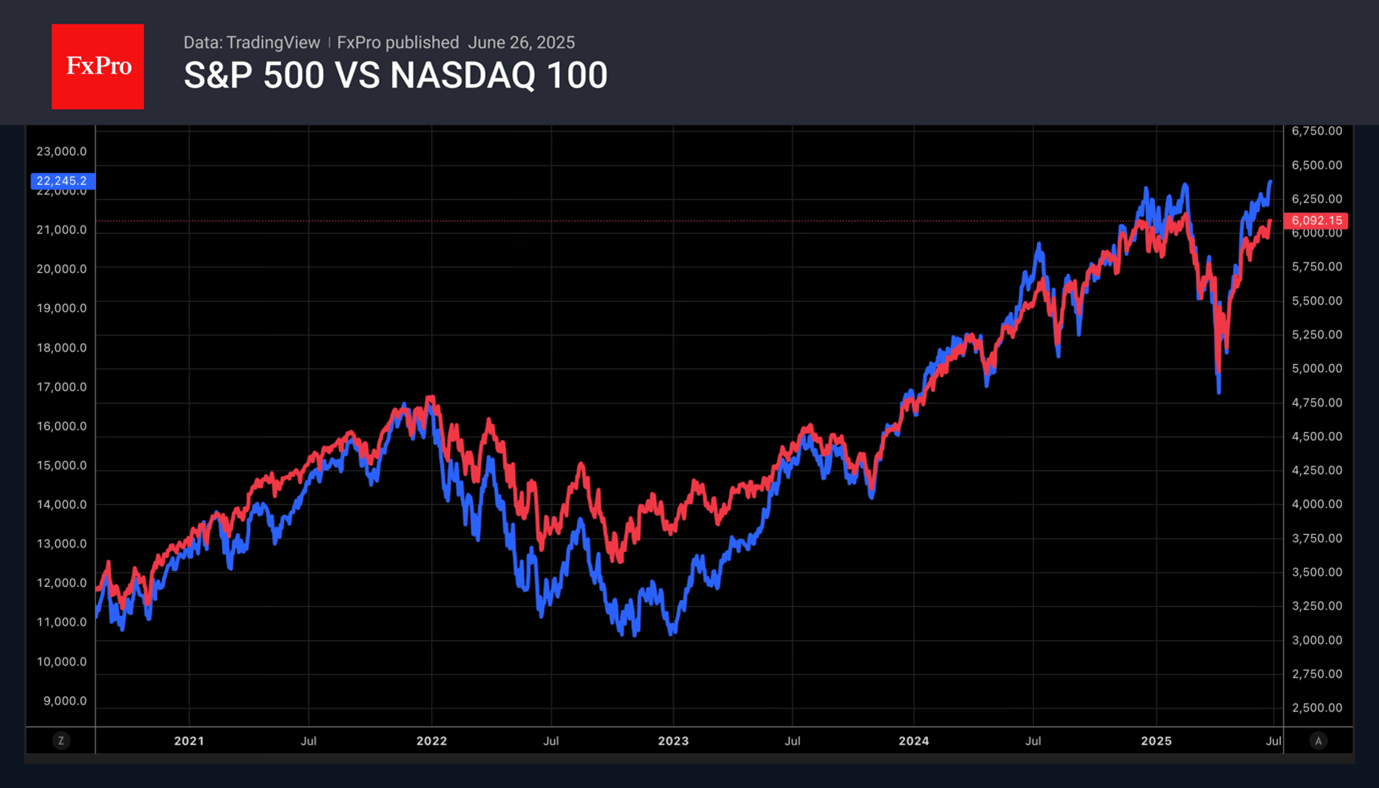
Support from the White House is creating a tailwind for US stocks. However, the market is overly confident about Donald Trump’s intention to extend the 90-day delay in import duties or to limit himself to a minimum universal tariff of 10%. The US president has repeatedly emphasised that his policies have brought billions of dollars into the budget. His chief economist, Stephen Mnuchin, has estimated the inflow of money from tariffs at $3 to $5 trillion over 10 years. As the expiry date approaches, fear may return to the markets.
The inflated fundamental valuations of the S&P 500 are causing concern. The price-to-earnings ratio exceeds 22. This is 35% higher than the historical average for the indicator.
EURUSD Elliott Wave Update: Upward Momentum Resumes
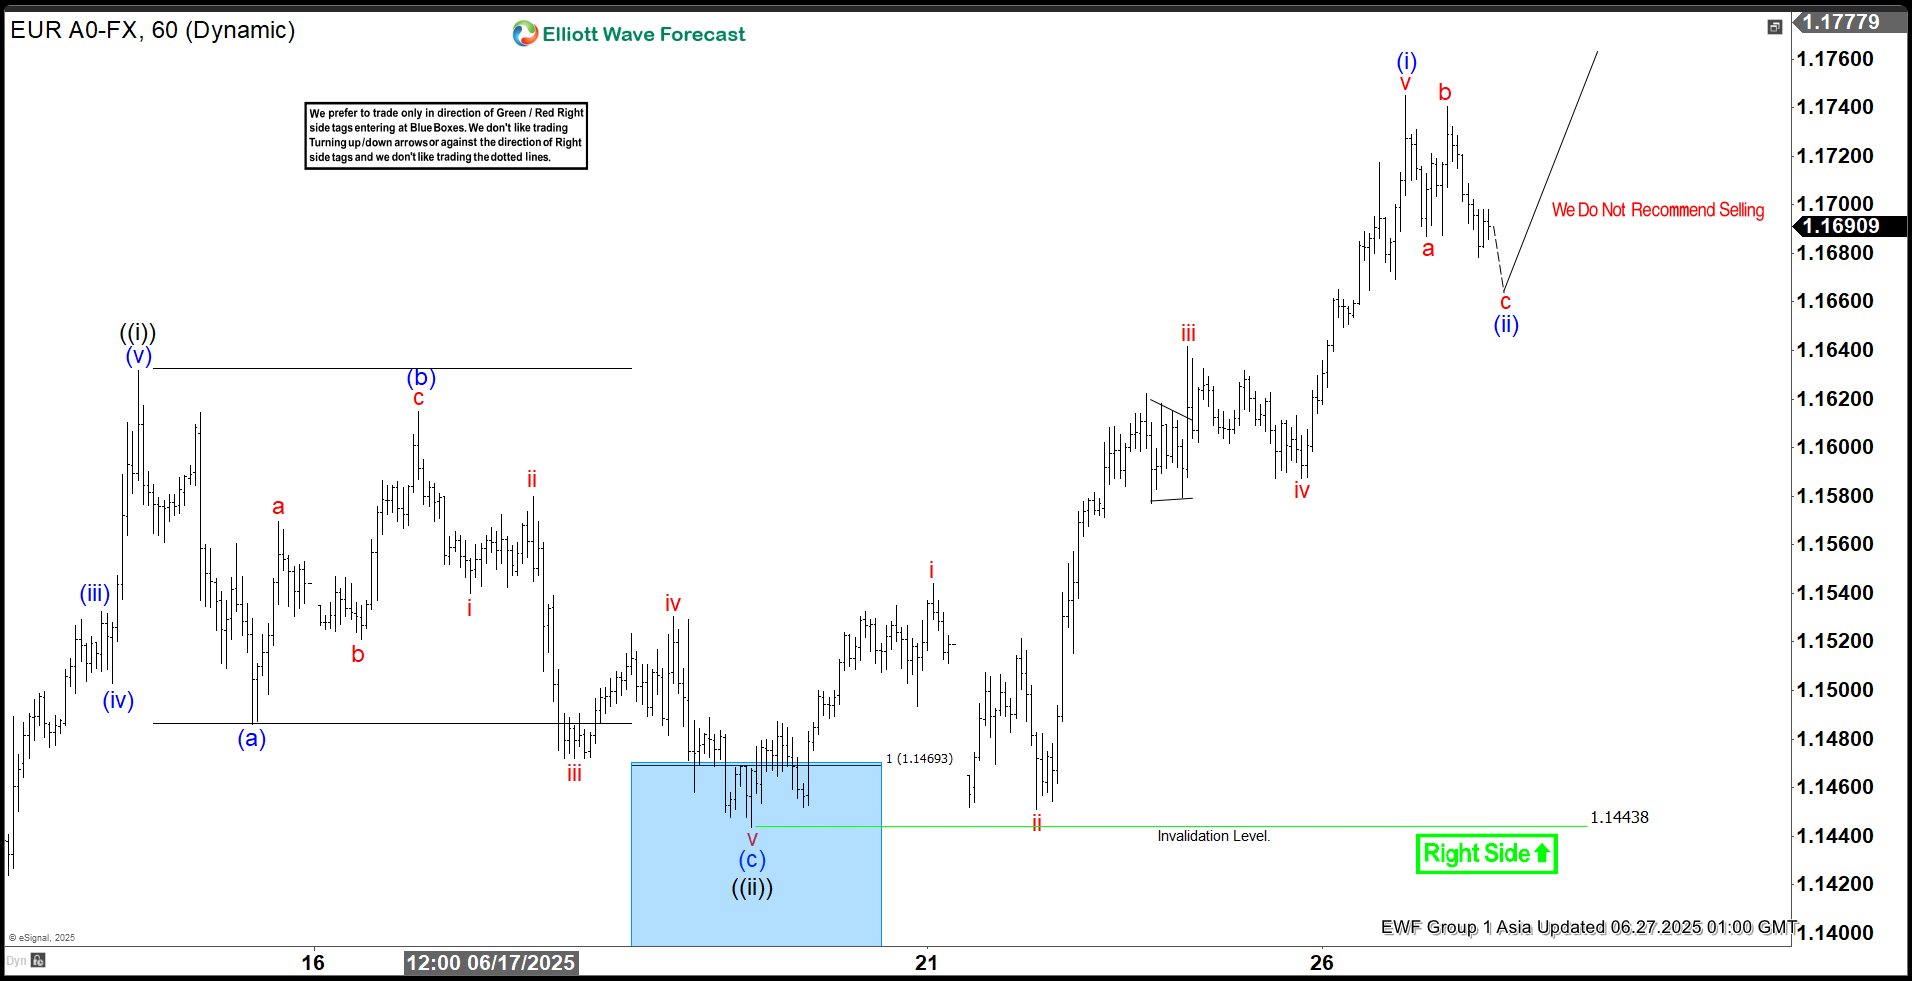
The EURUSD Elliott Wave sequence initiated from the September 2022 low reveals an incomplete bullish structure, signaling potential for further upside. A short-term rally from the May 29, 2025 low is currently unfolding as a five-wave impulse. As depicted in the 1-hour chart below, wave ((i)) peaked at 1.16319. A corrective wave ((ii)) followed which concluded at 1.14435. The internal structure of wave ((ii)) formed a zigzag pattern, with wave (a) declining to 1.1486 and wave (b) rebounding to 1.1614. Wave (c) completed the correction at 1.144, finalizing wave ((ii)) in the higher degree.
The pair has resumed its ascent in wave ((iii)), exhibiting an impulsive internal subdivision. From the wave ((ii)) low, wave i advanced to 1.1544, followed by a minor dip in wave ii to 1.1451. Wave iii surged to 1.1641, with a subsequent wave iv pullback ending at 1.1587. The final leg, wave v, culminated at 1.1745, completing wave (i) in the higher degree. A corrective wave (ii) pullback, likely a three-wave zigzag, appears to have concluded at 1.1678. However, a break above the wave (i) high at 1.1745 is required to negate the possibility of a double correction lower. Given the shallow nature of the wave (ii) pullback, the risk of a deeper correction remains. However, as long as the pivotal low at 1.144 holds, dips should attract buyers in 3, 7, or 11 swings, supporting further upside momentum.
EURUSD 60-Minute Elliott Wave Technical Chart
EURUSD Elliott Wave Technical Video
https://www.youtube.com/watch?v=eRZSNZm_FJ0
US Moving to Reach Agreements With 10 Major Trading Partners
Markets
Yesterday, trends of the previous days continued with a further steepening of the US yield curve acting as a key driver translating into a weaker dollar and a better bid for US equities. The finalization of the Trump’s Big Beautifull budget Bill in the US Senate and the trade negotiations heading for the July 09 deadline continue playing on the background as well. US data were mixed with a further downward revision of Q1 GDP (-0.5% QoQa), solid durable goods orders/shipments and mixed jobless claims (lower than expected initial claims, but higher continuing claims). It was sufficient for markets to raise the odds that the Fed could be in the position to start cutting the policy rate more significantly after summer. Fed speakers (SF Fed Daly, Boston Fed Collins) still speak in a very conditional way but also didn’t aggressively reject market thinking. US yields yesterday again declined between 6.1 bps (2-y) and 3.1 bps (30-y). Moves on the German yield curve were much more limited (less than two bps across the curve). US major US equity indices add close to 1%, with the Nasdaq and the S&P 500 inches away from all-time record levels. The US Treasury announcing to remove the ‘revenge tax’ from the budget bill after a deal with G7 allies on foreign taxation of US companies, is probably supportive for US assets. A risk-on context combined with a bull steepening of the US yield curve only reinforced the by-default USD-downtrend. At 97.15, the DXY index closed at the lowest level since March 2022. EUR/USD finished near the 1.17 big figure. For now, the USD/JPY-decline is less outspoken with the pair holding in a relatively tight sideways range (close 144.4).
Overnight, US Commerce Secretary Lutnick said the US and China ‘finalized’ the trade framework reached in Geneva. He also indicated that the US is moving to reach agreements with 10 major trading partners going into the July 09 deadline. US president Trump in this respect indicated that a deal with India might be close. Countries might be put in different ‘categories’ according to the status of deals reached (or not yet being reached). At least for now this looks like a relatively orderly framework, potentially comforting markets. Later today, the eco calendar is well-filled including EC confidence indicators and first national EMU CPI data (Spain, Belgium). Even so, the focus will stay on the US data with US May PCE deflators and (final) consumer confidence of the University of Michigan. Soft PCE deflators (0.1% M/M) in particular might be seen as validating expectations on the Fed moving towards a neutral rate faster than what had been guided of late. If so, short-term US yields still have downside, with next support for the 2-y yield (currently 3.74% near 3.55%/3.50%). In such a scenario, more (cyclical) USD-losses might be on the cards.
News & Views
Tokyo June inflation numbers were more modest than feared. Prices in Japan’s capital rose by 3.1% Y/Y (from 3.4% in May and vs 3.3% expected). Price rises in the underlying gauge excluding fresh food slowed from 3.6% Y/Y to 3.1%. Details showed water utility prices falling 34.6% Y/Y, reflecting a four-month waiver of water charges by the regional government to ease the cost-of-living burden. This Tokyo specific measure won’t meaningfully show in national Japanese numbers due on July 18. Without this effect, core CPI likely stabilized in June following significant upward surprises in April and May. With more clarity expected on a potential trade framework in the US in coming weeks, this persistent underlying price pressure might become the BoJ’s central focus again when it meets next on July 31st (including updated quarterly forecasts). Right now, Japanese money markets expect a status quo with only a 50% probability that the BoJ will this year resume its hiking cycle. We are inclined to err on the hawkish side of this positioning.
The Bank of Mexico lowered its policy rate as expected by 50 bps to 8% in a split decision (4-1; dissenter in favor of no change). The central bank changed its forward guidance saying it will assess further adjustments depending on the data. At previous meetings, they hinted at more accommodative 50 bps rate cuts ahead. Recent upward inflation surprises, which prompted revisions higher to the expected CPI path, triggered the change of tone after 325 bps of cumulative policy rate reductions since March 2024.
Trade News Back to Headlines
The month of June is approaching its end with US equities having rebounded to their all-time high levels, fully brushing off the trade-war-led selloff between February and April this year.
Funny enough, the rally was not necessarily backed by material progress in trade negotiations, but rather by the so-called TACO trade and FOMO — with TACO standing for ‘Trump Always Chickens Out’ and FOMO standing for ‘Fear of Missing Out’ on the chickening out. There's also the conviction that the Federal Reserve (Fed) will cut rates sooner rather than later, that earnings growth will remain strong despite trade uncertainties, and that AI will eventually boost productivity and reduce costs.
But Fed officials keep saying they’re not planning to cut rates before the fall. Many companies refrained from giving earnings guidance last quarter because trade uncertainties made forecasting too difficult. And the productivity gains from AI are likely months — if not years — away.
So the rally looks stretched. Happily, stretched doesn’t mean it won’t continue. If investors are fed a steady diet of sugar, asset prices could keep inflating. And Trump may eventually give them what they want. The US and China have apparently reached a trade truce, the US administration said that 10 more deals could be imminent, and EU Commission President Ursula von der Leyen said she’s ready to negotiate when the US is — in an effort to reach an agreement before the July deadline. Meanwhile, US bank investors are cheering news of softer regulation on leverage rules this week, which could free up to $6 trillion in additional balance sheet capacity.
As such, futures are in the green.
But overall, tariff uncertainties persist for key sectors like metals, autos, and technology. The direction and speed of US debt accumulation haven’t improved — on the contrary, current developments suggest the Trump administration’s planned spending cuts will be outweighed — and more — by benefits aimed at enriching already wealthy Americans. The geopolitical situation in the Middle East also remains tense, with Iran claiming that recent US bombing didn’t significantly damage its nuclear facilities — a claim supported by European officials.
On the data front, the news isn’t brilliant either. Yesterday’s GDP update showed that the US economy slowed more than previously reported in Q1. While declining exports and a pre-tariff spike in imports explain part of the slowdown, a sharp drop in sales — more than 3% — explains another chunk. That’s consistent with sentiment surveys: Michigan’s sentiment index plunged nearly 30% in the spring and remains stuck near post-pandemic lows due to trade-related uncertainty. Bloomberg notes that over the survey’s 79-year history, a drop this severe has ’almost always predicted a recession.’ On the jobs front, recent data showed continued surprise resilience, but continuing jobless claims are notably on the rise. And while inflation pressures have remained surprisingly contained so far, risks remain skewed to the upside given potential tariffs. Today, the focus will be on the core PCE data — the Fed’s preferred inflation gauge — which may show a slight acceleration in inflation, further cementing the case for the Fed to wait before cutting rates.
But all that looks like peanuts to retail investors, who appear to be shouldering the rally by ignoring mounting risks. In the best-case scenario, trade deals materialize and institutional investors — who’ve been sitting on the sidelines — join the retail crowd, pushing global equities to new highs. Or, the summer turns volatile and the failure to secure trade deals dents sentiment, triggering a downside correction. Pick your side. A fun fact: China’s CSI 300 index is barely reacting to the trade truce news this morning — perhaps due to reports that industrial profits fell more than 1% between January and May, reversing an earlier 1.4% gain.
In FX, the US dollar index fell to a fresh three-year low yesterday, partly on reports that Trump plans to nominate the next Fed chair as soon as next fall— an effort to soften Powell’s cautious stance and dent the Fed’s credibility at a moment when investor confidence in the dollar and US debt is weakening. The EURUSD is consolidating gains just below the 1.17 mark while Cable is stting on the 1.37 mark this morning. Any positive trade developments could partially unwind the dollar’s trade-related losses and cap the majors’ advance against the greenback.
In metals and commodities, gold slipped below its 50-day moving average and could fall back toward $3,000 per ounce if trade sentiment improves. Crude oil tested but held above the key $65 per barrel support — which corresponds to the 38.2% Fibonacci retracement of the YTD decline and marks the line between a bearish continuation and the start of a bullish breakout, mostly fueled by geopolitical tensions. Positive trade news could improve global demand expectations and help put a fundamental floor under oil near the $65 mark.
But as you’ve likely gathered, the focus will now shift from geopolitics to trade negotiations — and if the news is good enough, the risk rally could easily gain momentum.
US PCE Data Concludes the Week
In focus today
In the US, US PCE data for May is due for release. Earlier CPI and retail sales data indicate moderating price and real consumption growth. The revised June University of Michigan consumer sentiment survey is also expected.
In Norway, we expect unemployment and retail sales figures. Following a surprising jump in unemployment in May, the upcoming data will reveal whether this signals a real weakening of the labour market or reflects changes in the way NAV registers the unemployed. We anticipate the adjusted SA unemployment rate to be unchanged at 2.1%, although the number of unemployed individuals may increase. Retail sales have shown strong growth since the end of last year, driven by high real wage growth, a tight labour market, and a shift from service consumption. We believe May's retail sales saw an approximate 1% SA decline.
In Sweden, the producer price index has been trending lower since the turn of the year, with both y/y and m/m figures negative for the past three months. May's data release is expected to continue this disinflationary trend.
In the euro area, focus turns to the June's first inflation reports from Spain and France, preceding the euro area print. We expect euro area HICP inflation to increase to 2.0% y/y (prior: 1.9%), driven entirely by rising energy inflation. Importantly, we expect core inflation to continue grinding lower to 2.2% y/y (prior: 2.3%), reflecting ongoing disinflation in services following an Easter-related uptick in April.
Economic and market news
What happened overnight
In Japan, the Tokyo CPI excluding fresh food came in lower than expected at 3.1% y/y (prior:3.6), still above Japan's target of 2%, and fuelling market expectations for further interest rate hikes. Core inflation (excl. fresh food and energy) printed at -0.4% m/m June, which follows a 0.1% national print in May. May's retail sales growth slowed to 2.2% y/y from April's 3.3%, falling short of market expectations of 2.7%. These data points will be pivotal in the upcoming BoJ rate review scheduled for 30-31 July, where new quarterly growth and price forecasts will be issued.
In China, industrial profits dropped -1.1% y/y in the first five months of the year, reversing a two-month growth streak, according to the National Bureau of Statistics.
What happened yesterday
In the US, final Q1 GDP was revised down to -0.5% Q/Q AR (prior: -0.2%) driven by weaker private consumption ahead of tariffs. May's preliminary trade balance data showed the goods trade deficit widening to -96.6bn (prior: -87.0bn), indicating renewed front-loading of imports following the US-China trade deal. Durable goods orders saw a sharp increase of 16.4% m/m, largely driven by aircraft orders. Continuing jobless claims edged higher but remain historically modest.
There were several comments from Fed Officials yesterday - Fed's Daly stated that tariffs may not lead to a large or sustained inflation surge and thus opening for an easing in the autumn. Fed's Collins indicated July would be too early for a rate cut. Lastly, Fed's Barkin signalled that increased average tariff rates could push inflation higher, stressing policy uncertainty but affirming the Fed's readiness to tackle evolving economic challenges.
In Sweden, NIER released their Economic Tendency Indicator, showing a slight decline from 94.5 to 92.8. Manufacturing dropped from 100.1 to 99.3, while retail trade saw a significant drop to 96.3 (prior: 103.7). Household sentiment improved modestly to 84.6, though it remains low. Retail sector price plans decreased, a positive sign for the Riksbank, despite small declines in prices for durable and non-durable goods, which remain elevated.
In the UK, BoE's governor Bailey noted employment tax hikes impact pay and jobs, not prices, amid inflation uncertainty. Despite holding rates at 4.25%, Bailey emphasised a restrictive policy stance to curb persistent inflation, with potential rate cuts expected in August, as the labour market shows signs of easing.
Equities: Goldilocks is (almost) back - at least through the lens of market performance. Less than a week after the geopolitical risk premium spiked on fears of an expanded Middle East conflict involving the US in the Iran/Israel conflict, risk sentiment has remarkably recalibrated. Equity markets pushed higher (again) yesterday, with several major indices either breaking into new all-time highs or inching very close. The VIX continued to grind lower (again), cyclical sectors outperformed defensives (again), and true to form in this type of risk on minimum volatility lagged (again). To qualify for goldilocks we need have yields lower of course, so please check your screen as see the short end of the US curve (again). In the US yesterday, Dow +0.9%, S&P 500 +0.8%, Nasdaq +1.0% and Russell 2000 +1.7%. This morning's picture in Asia is more mixed, though Japan stands out with a strong ~1.5% gain following softer-than-expected inflation data.US. and European futures are also higher.
FI and FX: EUR/USD has set new year-to-date highs above 1.17 as the USD extends its losses. Together with the USD, SEK was yesterday's loser within G10 space as we saw EUR/SEK crawling above 11.10 again. EURUSD XCCY basis has tightened significantly this week. The 1Y tenor has tightened more than 2bp to the tightest level since March. The catalyst seems to be upcoming changes to US banks supplementary leverage ratio. There was a decent decline in US Treasury yields yesterday as well as a steepening of the yield curve on the back of weaker than expected Q1 GDP numbers from the US as well as speeches from various Federal Reserve officials that are indicating forthcoming easing of monetary policy despite the potential impact from Tariffs.
GBP/JPY Daily Outlook
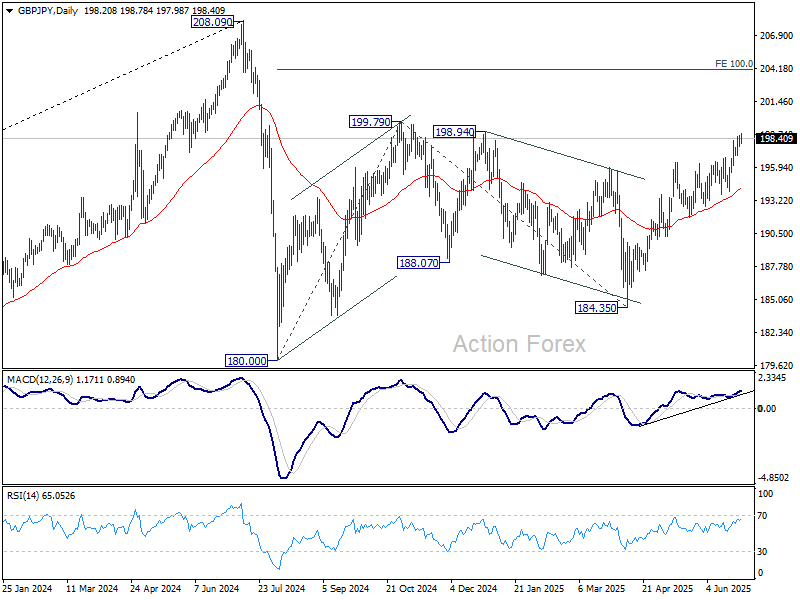
Daily Pivots: (S1) 197.75; (P) 198.18; (R1) 198.65; More...
Intraday bias in GBP/JPY stays mildly on the upside. Current rise from 184.35 should target 199.79 resistance. Break there will target 100% projection of 180.00 to 199.79 from 184.35 at 204.14. On the downside, below 196.94 minor support will turn intraday bias neutral and bring consolidations. But near term outlook will stay bullish as long as 193.99 support holds, in case of retreat.
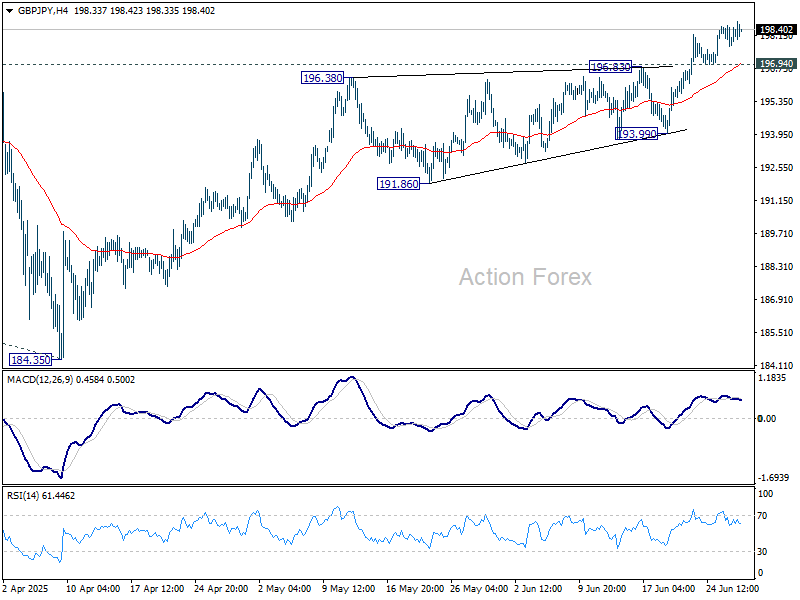
In the bigger picture, price actions from 208.09 are seen as a correction to rally from 123.94 (2020 low). Strong support should be seen from 38.2% retracement of 123.94 to 208.09 at 175.94 to contain downside. However, sustained break of 175.94 will bring deeper fall even still as a correction.
EUR/JPY Daily Outlook
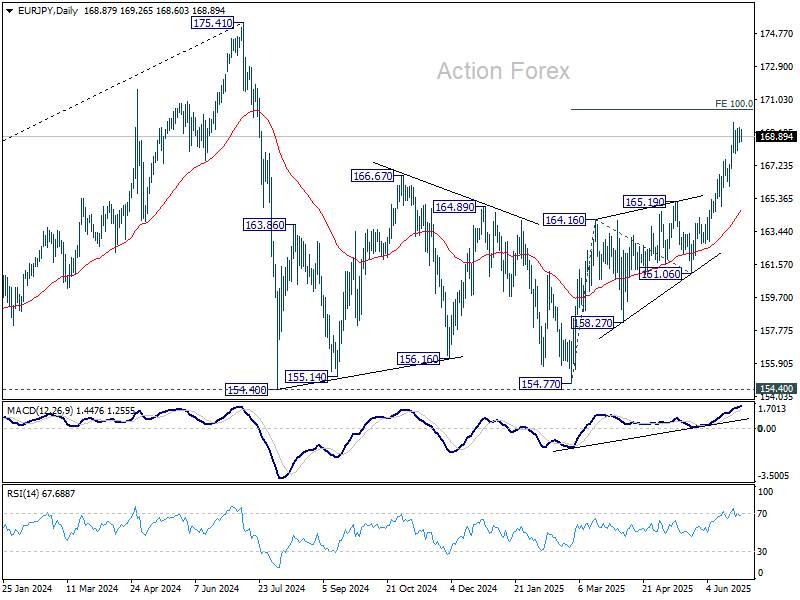
Daily Pivots: (S1) 168.54; (P) 168.97; (R1) 169.39; More...
Intraday bias in EUR/JPY remains neutral as consolidation continues below 169.69. Further rally is expected as long as 166.01 support holds. Break of 169.69 temporary top will resume the rise from 154.77 and target 100% projection of 154.77 to 165.19 from 161.06 at 170.45.
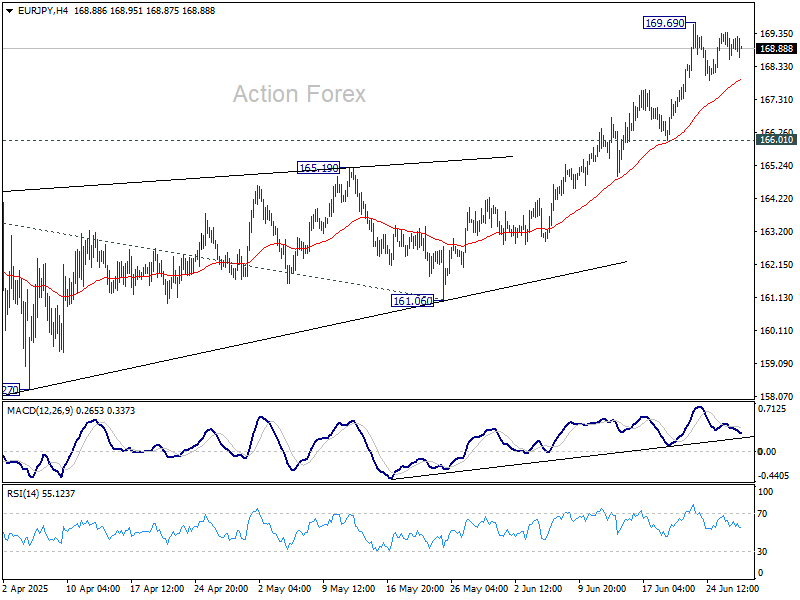
In the bigger picture, price actions from 175.41 are seen as correction to up trend from 114.42 (2020 low). Strong support should be seen from 38.2% retracement of 114.42 to 175.41 at 152.11 to contain downside. However, sustained break of 152.11 will bring deeper fall even still as a correction.
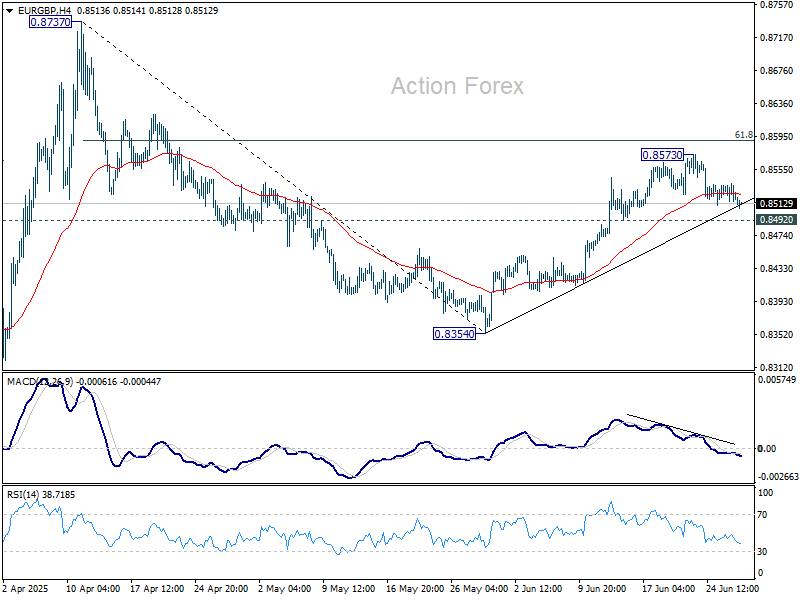
EUR/GBP Daily Outlook
Daily Pivots: (S1) 0.8515; (P) 0.8527; (R1) 0.8538; More...
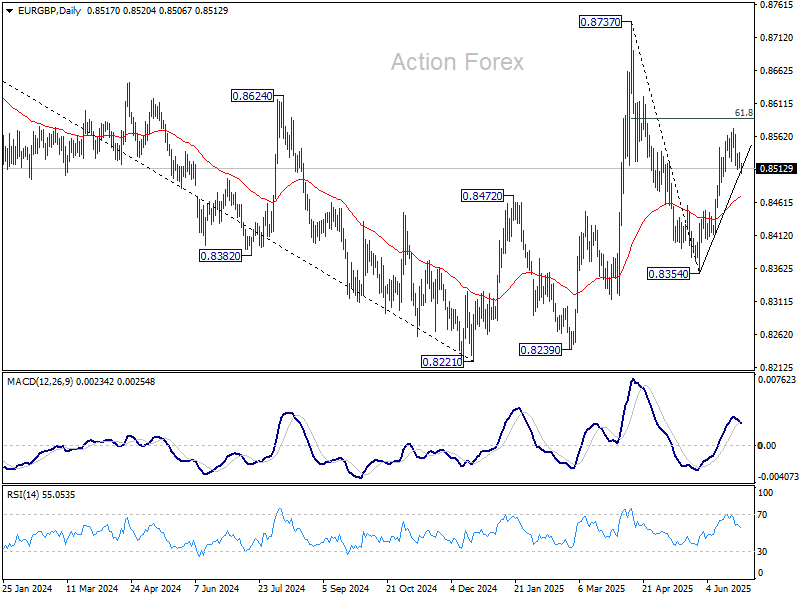
EUR/GBP is staying in consolidations below 0.8573 and intraday bias remains neutral. Further rise remains mildly in favor with 0.8492 support intact. Above 0.8573 will target 61.8% retracement of 0.8737 to 0.8354 at 0.8591. Firm break there will pave the way to 0.8373 resistance. However, firm break of 0.8492 will argue that rebound from 0.8354 has completed, and turn bias back to the downside.
In the bigger picture, price actions from 0.8221 medium term bottom are merely forming a corrective pattern to the down trend from 0.9267 (2022 high). Nevertheless, there is no clear momentum to break through 0.8201 key support (2022 low) yet. Hence, range trading is expected between 0.8221/8737 for now.
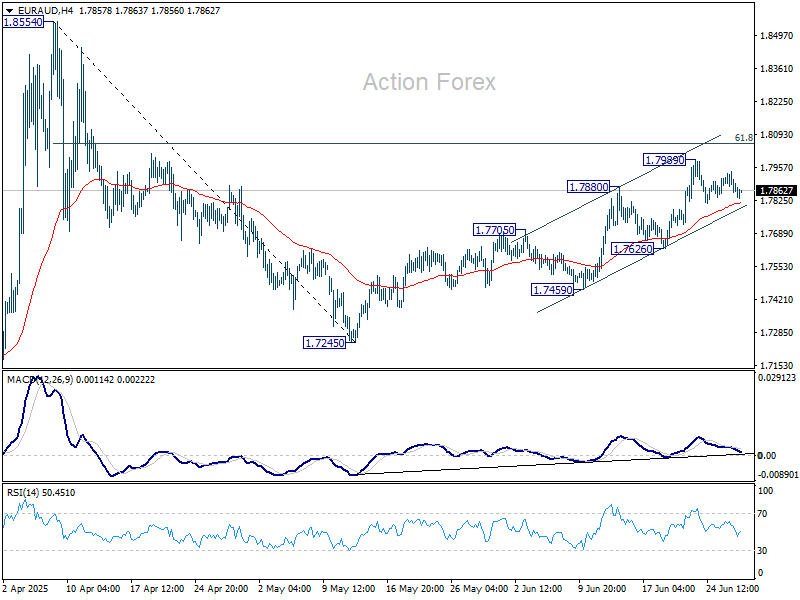
EUR/AUD Daily Outlook
Daily Pivots: (S1) 1.7842; (P) 1.7892; (R1) 1.7925; More...
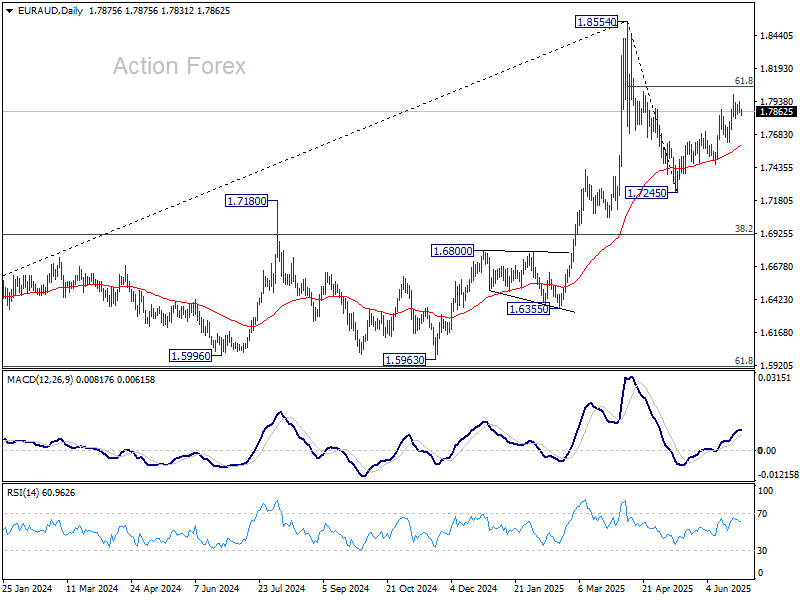
EUR/AUD is extending consolidations below 1.7989 and intraday bias remains neutral. Further rise is expected as long as 1.7626 support holds. Above 1.7989 will target 61.8% retracement of 1.8554 to 1.7245 at 1.8054. Firm break there will pave the way to 1.8554.
In the bigger picture, price actions from 1.8554 medium term are currently seen as a corrective pattern. While deeper pullback might be seen, downside should be contained by 38.2% retracement of 1.4281 (2022 low) to 1.8554 at 1.6922 to bring rebound. Up trend from 1.4281 is expected to resume at a later stage.
EUR/CHF Daily Outlook
Daily Pivots: (S1) 0.9347; (P) 0.9374; (R1) 0.9393; More....
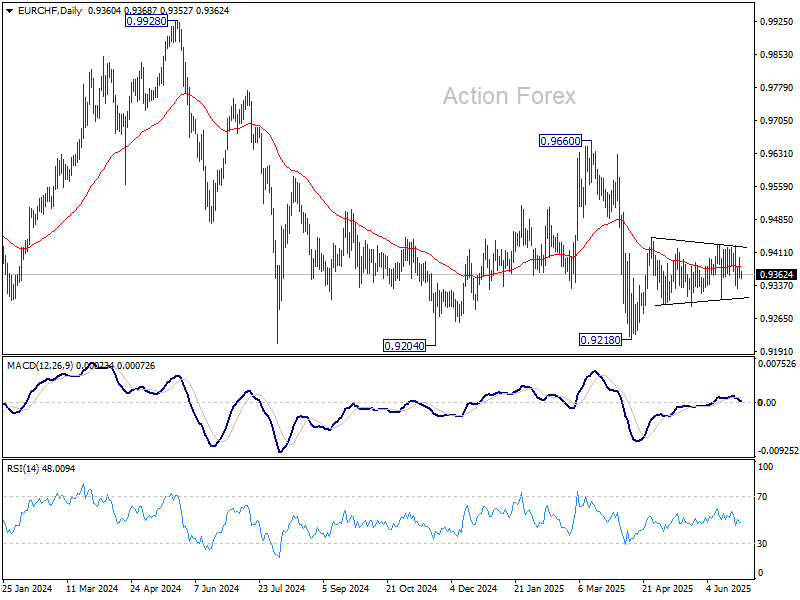
Intraday bias in EUR/CHF remains neutral as range trading continues. On the upside, break of 0.9428/45 resistance zone will resume the rebound from 0.9218. However, break of 0.9306 will turn bias back to the downside for retesting 0.9218 low instead.
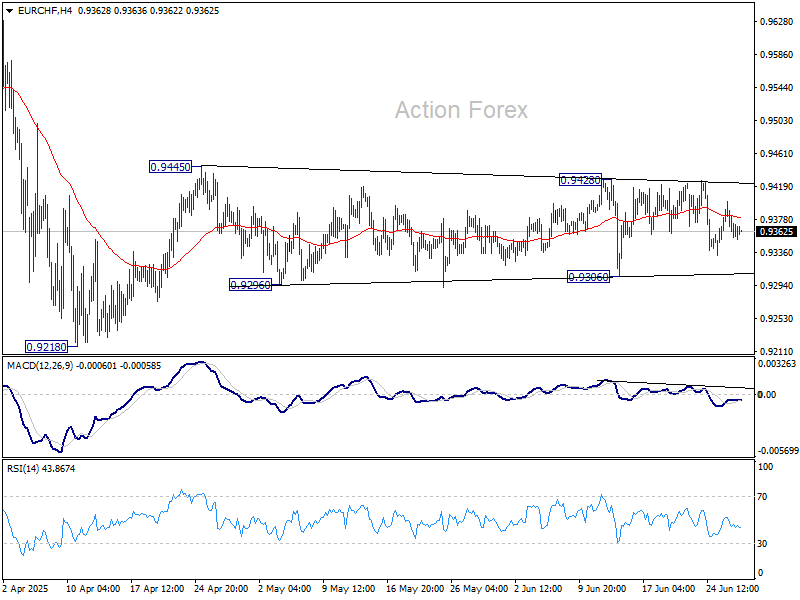
In the bigger picture, prior rejection by long-term falling channel resistance (now at 0.9511) retains medium term bearishness. That is, down trend from 1.2004 (2018 high) is still in progress. Firm break of 0.9204 (2024 low) will confirm resumption. This will remain the favored case as long as 0.9660 resistance holds.