
Sample Category Title
USD/CHF Daily Outlook
Daily Pivots: (S1) 0.7970; (P) 0.8012; (R1) 0.8044; More….
Intraday bias in USD/CHF remains on the downside at this point. Current down trend should target 61.8% projection of 0.9200 to 0.8038 from 0.8475 at 0.7757 next. On the upside, above 0.8079 minor resistance will turn intraday bias neutral and bring consolidations. But recovery should be limited below 0.8214 resistance to bring another fall.
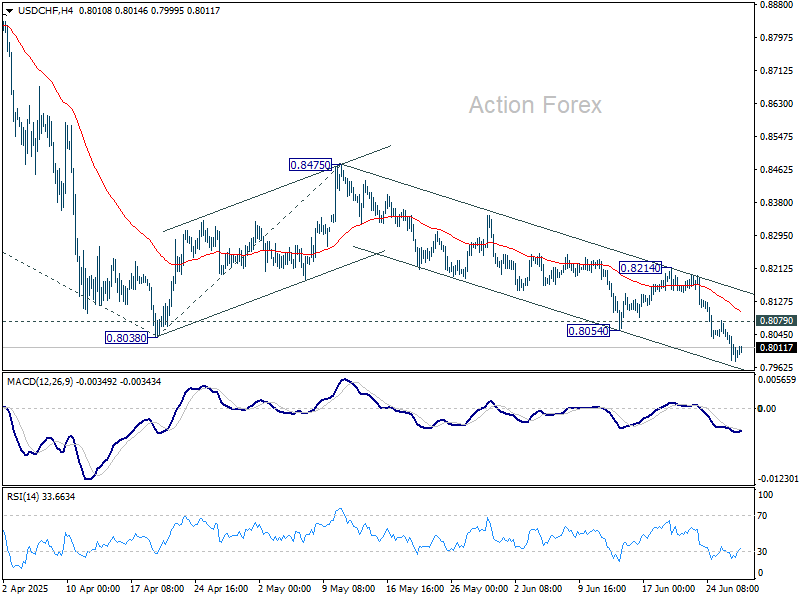
In the bigger picture, long term down trend from 1.0342 (2017 high) is still in progress. Next target is 100% projection of 1.0146 (2022 high) to 0.8332 from 0.9200 at 0.7382. In any case, outlook will stay bearish as long as 0.8475 resistance holds.
USD/CAD Daily Outlook
Daily Pivots: (S1) 1.3596; (P) 1.3663; (R1) 1.3709; More...
USD/CAD's break of 1.3633 minor support suggests that corrective recovery from 1.3538 has completed at 1.3797. Intraday bias is back on the downside. Firm break of 1.3538 will resume larger fall from 1.4791. On the upside, break of 1.3797 will extend the corrective bounce towards 1.4014 cluster resistance (38.2% retracement of 1.4791 to 1.3538 at 1.4017).
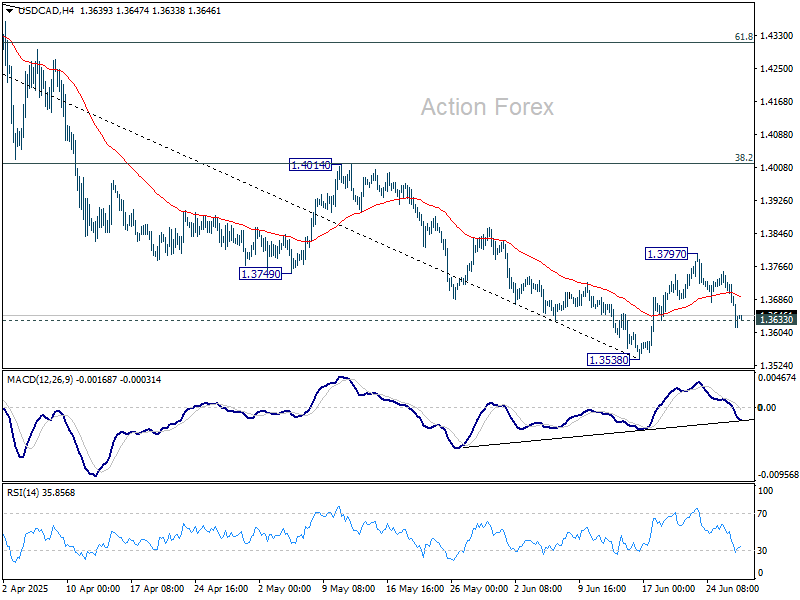
In the bigger picture, price actions from 1.4791 medium term top could either be a correction to rise from 1.2005 (2021 low), or trend reversal. In either case, further decline is expected as long as 1.4014 resistance holds. Next target is 61.8% retracement of 1.2005 (2021 low) to 1.4791 at 1.3069.
AUD/USD Daily Report
Daily Pivots: (S1) 0.6511; (P) 0.6538; (R1) 0.6572; More...
AUD/USD's rise from 0.5913 finally resumed by breaking 0.6551 resistance. Intraday bias is back on the upside for 0.6713 fibonacci level. On the downside, below 0.6483 minor support will turn intraday bias neutral first. But near term outlook will now stay bullish as long as 0.6372 support holds, in case of retreat.
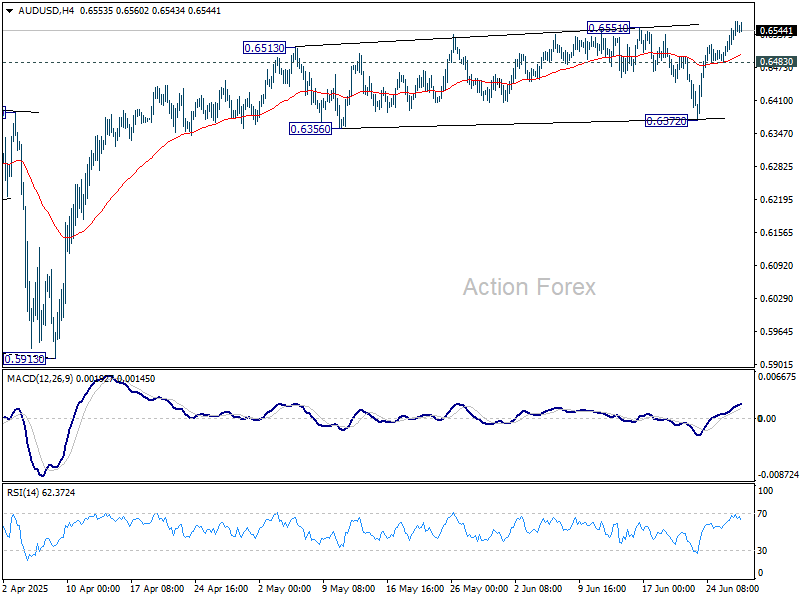
In the bigger picture, there is no clear sign that down trend from 0.8006 (2021 high) has completed. Rebound from 0.5913 is seen as a corrective move. While stronger rally cannot be ruled out, outlook will remain bearish as long as 38.2% retracement of 0.8006 to 0.5913 at 0.6713 holds. Nevertheless, considering bullish convergence condition in W MACD, even in case of another fall through 0.5913, downside should be contained above 0.5506 (2020 low).
Risk Appetite Holds, Dollar Extends Losses Markets Eye PCE into Friday’s Finish
Global risk sentiment remains firm heading into the weekend, with both S&P 500 and NASDAQ pushing near record highs overnight. Asian markets followed suit, with Japan’s Nikkei breaking above the symbolic 40k mark, extending its robust rally driven by AI optimism and strong corporate earnings.
The bullish tone persists despite persistent warnings from Fed officials that a July rate cut is unlikely. Instead, Fed’s consistent message of "not now, but likely later" is reinforcing market hopes that easing will resume by fall. Most policymakers continue to emphasize patience due to tariff-related inflation risks, yet concede that inflation appears to be trending back toward target. This dovish tilt later in the year is offering enough support for equity bulls to stay in control.
Traders are now squarely focused on May’s US PCE inflation release. A modest rise is expected, with headline PCE set to climb to 2.3% and core PCE to 2.6%. A soft reading would further cement the case for September easing, while any significant surprise to the upside could temporarily dampen sentiment. For now, though, investors appear optimistic that inflation remains manageable.
In contrast, China delivered fresh disappointment. Industrial profits plunged -9.1% yoy in May, the steepest drop since last October, reflecting continued weakness in domestic demand and pricing power. Cumulative profits are down 1.1% year-to-date, despite Beijing’s targeted stimulus. The data highlight the limits of China's support measures and add to growth concerns.
In currency markets, Dollar remains under pressure and looks set to finish the week as the worst performer, followed by Loonie and Yen. Swiss Franc leads on the upside, with Sterling and Kiwi close behind. Euro and Aussie are positioning in the middle.
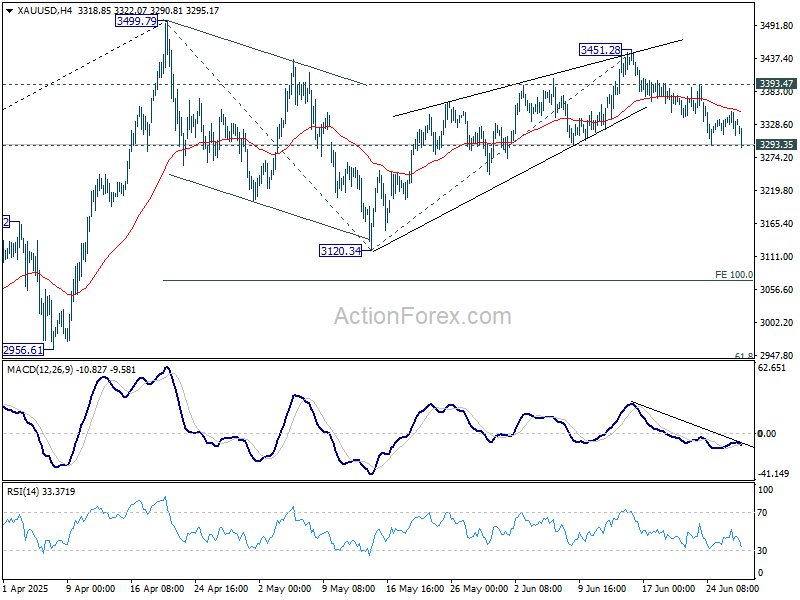
Technically, Gold's weakness returns today and focus is back on 3293.35 support. Firm break there will resume the fall from 3451.28. That would also solidify the case that whole corrective pattern from 3499.79 is already in the third leg. Deeper decline should then be seen back to 3120.34 support.
In Asia, at the time of writing, Nikkei is up 1.56%. Hong Kong HSI is down -0.06%. China Shanghai SSE is down -0.21%. Singapore Strait Times is up 0.64%. Japan 10-year JGB yield is up 0.01 at 1.434. Overnight, DOW rose 0.94%. S&P 500 rose 0.80%. NASDAQ rose 0.97%. 10-year yield fell -0.040 to 4.253.
Tokyo core inflation slows to 3.1% in June, but food costs still surging
Tokyo’s core CPI (ex-fresh food) slowed more than expected in June, coming in at 3.1% yoy versus 3.6% yoy in May and below forecasts of 3.4% yoy. The decline was largely driven by the resumption of fuel subsidies and temporary reductions in utility charges. Core-core CPI, which strips out both fresh food and energy, also eased to 3.1% yoy from 3.3% yoy.
However, the figure masks ongoing strain on household budgets. Food prices (excluding volatile items) rose a sharp 7.2% yoy, accelerating from May's 6.9% yoy. Tokyo consumers paid nearly 90% more for rice and faced eye-watering increases in chocolate and coffee costs. Service prices edged down slightly but remained elevated at 2.1%.
On the labor side, Japan's May jobless rate held steady at 2.5%, while the job-to-applicant ratio slipped slightly to 1.24.
Fed's Barr: Tariffs pose dual risk to inflation and jobs, justifying wait and see
Fed Governor Michael Barr said overnight that tariffs may pose a dual threat to the economy—lifting inflation expectations while simultaneously slowing growth. He pointed to survey data showing households anticipate sharp near-term price increases, which, coupled with supply chain reconfiguration and second round effects effects, could result in "some inflation persistence."
At the same time, Barr acknowledged tariffs could cause the economy to slow and unemployment to rise," disproportionately impacting low-income workers.
Given these uncertainties, Barr advocated for a patient policy approach. “Monetary policy is well positioned to allow us to wait and see how economic conditions unfold,” he said.
Fed’s Collins: July cut too soon, needs more data before moving
Boston Fed President Susan Collins said in a Bloomberg interview that July is too soon for a rate cut, pointing to the limited data available between now and the next FOMC meeting. “We’re only going to have really one more month of data before the July meeting,” she noted, adding, “I expect to want to see more information than that.”
Collins emphasized there’s no urgency to ease policy and reaffirmed her baseline view that cuts are likely later this year. Whether that translates to “one rate cut” or potentially more, she said, will depend entirely on how the data evolves.
Fed's Kashkari needs clarity before cutting rates
Minneapolis Fed President Neel Kashkari reiterated the cautious stance on monetary policy, citing continued uncertainty over the inflationary impact of new tariffs. Speaking at an event overnight, Kashkari said the Fed needs to "go slow" until it gains more clarity, adding, “We still need to get a better assessment of what impact tariffs are going to have on the economy. We just don't know yet.”
He noted that many businesses are hesitating to raise prices, fearing a backlash if tariffs are later reversed. Kashkari also highlighted the ability of supply chains to adapt and “find their way around and through barriers,” suggesting the inflation impact might be more muted than expected.
AUD/USD Daily Report
Daily Pivots: (S1) 0.6511; (P) 0.6538; (R1) 0.6572; More...
AUD/USD's rise from 0.5913 finally resumed by breaking 0.6551 resistance. Intraday bias is back on the upside for 0.6713 fibonacci level. On the downside, below 0.6483 minor support will turn intraday bias neutral first. But near term outlook will now stay bullish as long as 0.6372 support holds, in case of retreat.
In the bigger picture, there is no clear sign that down trend from 0.8006 (2021 high) has completed. Rebound from 0.5913 is seen as a corrective move. While stronger rally cannot be ruled out, outlook will remain bearish as long as 38.2% retracement of 0.8006 to 0.5913 at 0.6713 holds. Nevertheless, considering bullish convergence condition in W MACD, even in case of another fall through 0.5913, downside should be contained above 0.5506 (2020 low).
Cliff Notes: Australian Inflation Risks Recede
Key insights from the week that was.
In Australia, the main event this week was May’s CPI Indicator which surprised materially to the downside, headline prices falling 0.4% in the month and annual inflation decelerating to 2.1%yr, near the bottom of the RBA’s target band. The housing category was a primary source of disinflation, energy rebates continuing to supress gains in electricity prices while price discounting by project home builders saw no change in dwelling prices overall. A outsized seasonal fall for holiday travel and accommodation prices was also at play, so too a surprise fall in the cost of insurance.
As a result, on a trimmed mean basis, inflation gapped lower to 2.4%yr in May from 2.8%yr in April. While the monthly indicator is only a partial read on inflation, and the comprehensive quarterly update is still likely to show underlying inflation in the upper half of the RBA’s target band for Q2 overall, price momentum and associated risks are clearly abating.
Chief Economist Luci Ellis subsequently announced a change to Westpac Economics’ RBA rate call, with the next rate cut now expected in July instead of August. With the RBA already in the middle of a rate cutting cycle and inflationary pressure and risks receding ahead of expectations, it is becoming increasingly difficult to justify a delay.
Note though, this does not mean the RBA is ready to rapidly deliver the full cycle of cuts we and the market are forecasting to a terminal rate around 2.85%. Holding concerns over the lack of productivity growth economy wide and also remaining confident in the strength of the labour market (on display again in this week’s job vacancies data), the RBA is likely to bide their time before cutting again after the July decision. Arguably additional cuts will only be fast tracked if conditions warrant, i.e. the labour market suddenly deteriorates and/or the global outlook darkens materially, threatening Australia’s nascent recovery in consumer spending.
Before moving offshore, a note on the domestic manufacturing sector. The latest instalment of the Westpac-ACCI Survey of Industrial Trends found the gradual recovery in manufacturing conditions remains intact, the Actual Composite remaining in expansionary territory at 51.6 in Q2. Perhaps the most promising development was a surge in optimism in future conditions, evinced by the Expected Composite lifting to 59.3. This not only reflects a greater degree of confidence around the economic recovery overall but also an improving outlook for profitability, aided by easing unit cost pressures. Still, capacity constraints and the availability of skilled labour will remain significant headwinds.
Offshore, the market has primarily focused on developments in the Middle East. Thankfully, after the US’ strike at the weekend and Iran’s limited retaliation against a US military base in Qatar, a ceasefire has held between Israel and Iran. With global oil supply unaffected and negotiations to be held, the price of oil has snapped back to levels seen prior to Israel’s initial strike on Iran in mid-June, having surged circa 20% in between. While uncertainty remains elevated, the financial cost for households and businesses across the West and Asia has been negligible.
It is not surprising then that policy makers generally remain favourably disposed to the outlook, both with respect to activity growth and inflation. Chair Powell’s remarks before Congress this week were a case in point. Chair Powell believes the FOMC does not need to be in a hurry “because the economy is still strong”. Still, he believes the FOMC will start easing policy “sooner rather than later” if tariff-related inflationary pressures prove contained. The FOMC’s Bowman and Goolsbee signalled a greater degree of comfort in the inflation outlook by being open to a cut as soon as July. However, Daly, Barkin and Collins showed a preference for additional time to assess. With Chair Powell seemingly of a similar view to the latter group, a September timing for the next cut still seems most probable absent a raft of rapid trade deals that remove the tariff threat and/or a marked deterioration in the labour market in June – this report is due next Thursday, ahead of the 4th of July long weekend.
Also flagged in the second day of Chair Powell’s testimony before Congress is a proposed reduction in the enhanced supplementary leverage ratio which would lower major bank capital requirements and allow them to choose to hold more Treasuries, if they wish. Under the planned change, holding companies' capital requirement would be lowered to 3.5-4.5% from 5% while banking subsidiaries' requirement would be lowered to the same 3.5-4.5% range from 6% currently. A 60-day public comment period will run before the change is confirmed. If the change goes ahead, it is expected to improve liquidity and make the US Treasury market more resilient to shocks. A material reduction in yields is unlikely, however, particularly if the US budget deficit and the Federal Government’s funding needs continue to grow. Research by the Federal Reserve Bank of Boston provides context on the likely implications of the change for the Treasury market.
The data released this week has been secondary in nature and provided little clear signal. The one release to call out is the third estimate of Q1 US GDP. This is not typically a release that warrants attention. But, in this instance, it does. Leading to the headline revision from -0.2% annualised growth to -0.5% was a near two-third cut to services consumption growth in the quarter, from 1.7% annualised to just 0.6%. Services export growth was also materially revised, from -2.1% annualised to -9.7%, although this deterioration was offset by a larger downward revision to import growth. These outcomes highlight the hit to US growth from political uncertainty, particularly with respect to trade policy and migration. Services spending has been a cornerstone for US GDP growth in recent years. If weakness now takes hold, it will be difficult for the US to sustainably achieve growth at trend let alone outperform as it has done in the recent past.
Tokyo core inflation slows to 3.1% in June, but food costs still surging
Tokyo’s core CPI (ex-fresh food) slowed more than expected in June, coming in at 3.1% yoy versus 3.6% yoy in May and below forecasts of 3.4% yoy. The decline was largely driven by the resumption of fuel subsidies and temporary reductions in utility charges. Core-core CPI, which strips out both fresh food and energy, also eased to 3.1% yoy from 3.3% yoy.
However, the figure masks ongoing strain on household budgets. Food prices (excluding volatile items) rose a sharp 7.2% yoy, accelerating from May's 6.9% yoy. Tokyo consumers paid nearly 90% more for rice and faced eye-watering increases in chocolate and coffee costs. Service prices edged down slightly but remained elevated at 2.1%.
On the labor side, Japan's May jobless rate held steady at 2.5%, while the job-to-applicant ratio slipped slightly to 1.24.
Fed’s Kashkari needs clarity before cutting rates
Minneapolis Fed President Neel Kashkari reiterated the cautious stance on monetary policy, citing continued uncertainty over the inflationary impact of new tariffs. Speaking at an event overnight, Kashkari said the Fed needs to "go slow" until it gains more clarity, adding, “We still need to get a better assessment of what impact tariffs are going to have on the economy. We just don't know yet.”
He noted that many businesses are hesitating to raise prices, fearing a backlash if tariffs are later reversed. Kashkari also highlighted the ability of supply chains to adapt and “find their way around and through barriers,” suggesting the inflation impact might be more muted than expected.
Fed’s Collins: July cut too soon, needs more data before moving
Boston Fed President Susan Collins said in a Bloomberg interview that July is too soon for a rate cut, pointing to the limited data available between now and the next FOMC meeting. “We’re only going to have really one more month of data before the July meeting,” she noted, adding, “I expect to want to see more information than that.”
Collins emphasized there’s no urgency to ease policy and reaffirmed her baseline view that cuts are likely later this year. Whether that translates to “one rate cut” or potentially more, she said, will depend entirely on how the data evolves.
Fed’s Barr: Tariffs pose dual risk to inflation and jobs, justifying wait and see
Fed Governor Michael Barr said overnight that tariffs may pose a dual threat to the economy—lifting inflation expectations while simultaneously slowing growth. He pointed to survey data showing households anticipate sharp near-term price increases, which, coupled with supply chain reconfiguration and second round effects effects, could result in "some inflation persistence."
At the same time, Barr acknowledged tariffs could cause the economy to slow and unemployment to rise," disproportionately impacting low-income workers.
Given these uncertainties, Barr advocated for a patient policy approach. “Monetary policy is well positioned to allow us to wait and see how economic conditions unfold,” he said.
USD/JPY Declines — Traders Eye Support for Potential Rebound
Key Highlights
- USD/JPY extended losses and traded below the 145.00 support zone.
- A major bullish trend line is forming with support at 143.50 on the 4-hour chart.
- EUR/USD extended gains and broke the 1.1700 resistance.
- GBP/USD rallied above the 1.3620 and 1.3650 levels.
USD/JPY Technical Analysis
The US Dollar failed to stay above 146.20 and extended losses against the Japanese Yen. USD/JPY traded below the 145.50 and 145.00 support levels.
Looking at the 4-hour chart, the pair dipped below the 61.8% Fib retracement level of the upward move from the 142.79 swing low to the 148.03 high. Besides, there was a drop below the 100 simple moving average (red, 4-hour) and the 200 simple moving average (green, 4-hour).
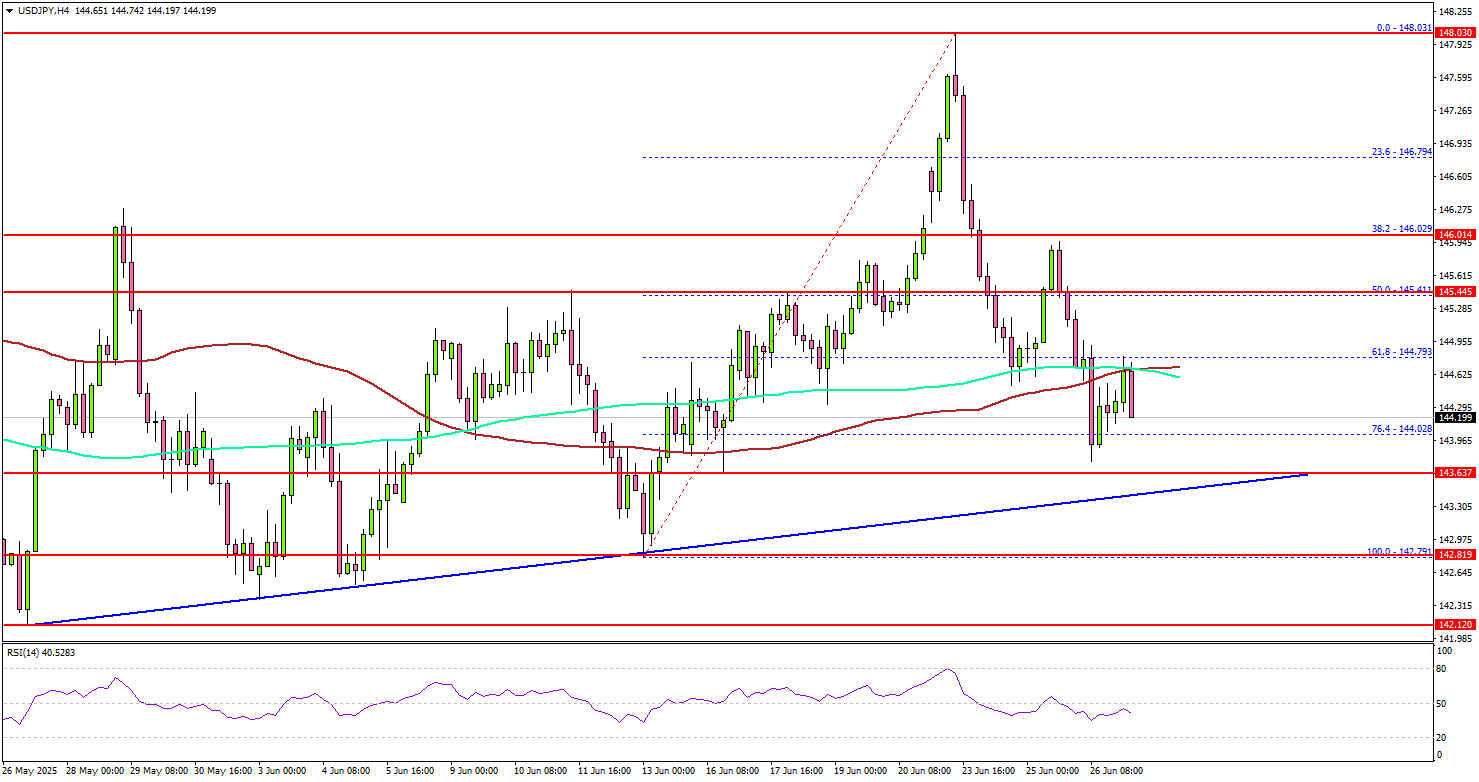
On the downside, immediate support is near the 143.65 level. The next key support sits near 143.50. There is also a major bullish trend line forming with support at 143.50 on the same chart.
Any more losses could send the pair toward the 142.80 support zone. If the bulls remain active above the stated support levels, there could be a fresh increase. On the upside, the pair could face resistance near the 145.00 level.
The next key resistance sits near the 145.50 level. The first major resistance sits at 146.20. A close above the 146.20 level could set the pace for another increase. In the stated case, the pair could even clear the 147.00 resistance. The next major stop for the bulls could be near the 148.00 resistance.
Looking at EUR/USD, the pair gained pace for an upside break above the 1.1620 and 1.1650 resistance levels. The next key hurdle sits at 1.1800.
Upcoming Economic Events:
- US Personal Income for May 2025 (MoM) - Forecast +0.3%, versus +0.8% previous.
- US Core Personal Consumption Expenditure for May 2025 (MoM) - Forecast +0.1%, versus +0.1% previous.
- Michigan Consumer Sentiment Index for June 2025 – Forecast 60.5, versus 60.5 previous.