
Sample Category Title
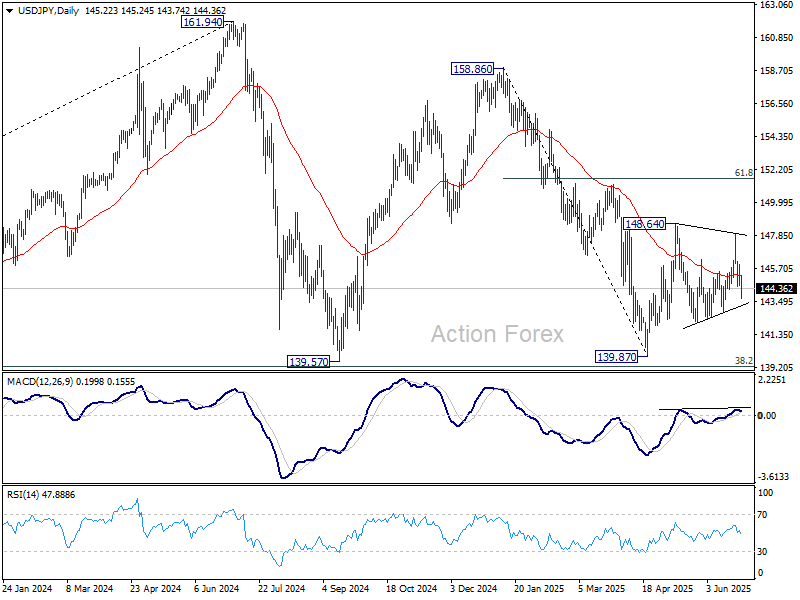
USD/JPY Mid-Day Outlook
Daily Pivots: (S1) 144.59; (P) 145.27; (R1) 145.93; More...
USD/JPY's fall from 148.01 extends lower today, but stays above 142.10 support. Intraday bias remains neutral and further rise is still in favor. On the upside. firm break of 148.64 will resume the rise from 139.87 to 61.8% retracement of 158.86 to 139.87 at 151.22. However, break of 142.10 will bring deeper fall back to retest 139.87 low.
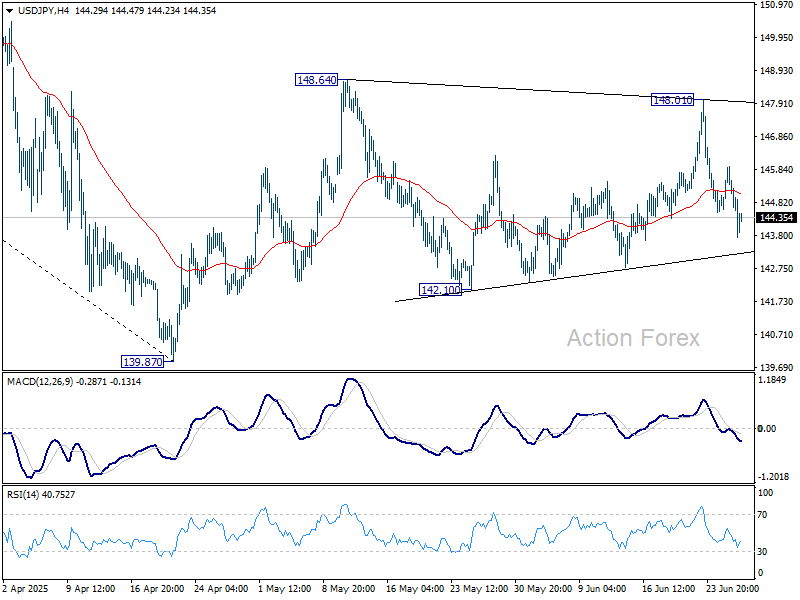
In the bigger picture, price actions from 161.94 are seen as a corrective pattern to rise from 102.58 (2021 low), with fall from 158.86 as the third leg. Strong support should be seen from 38.2% retracement of 102.58 to 161.94 at 139.26 to bring rebound. However, sustained break of 139.26 would open up deeper medium term decline to 61.8% retracement at 125.25.
Dollar Struggles After Mixed Data; Yen Rallies With Nikkei Surge
Dollar weakness continues to dominate FX markets, with the greenback staying under pressure across the board. he spotlight is on which currencies are capitalizing the most. Yen is stealing the show, along with sharp rally in the Nikkei as AI-fueled optimism sends semiconductor shares surging. Swiss Franc and Aussie are also firming, while the Kiwi and Loonie lag. Euro and Sterling are steady in the middle of the pack, with their earlier bullish momentum taking a breather.
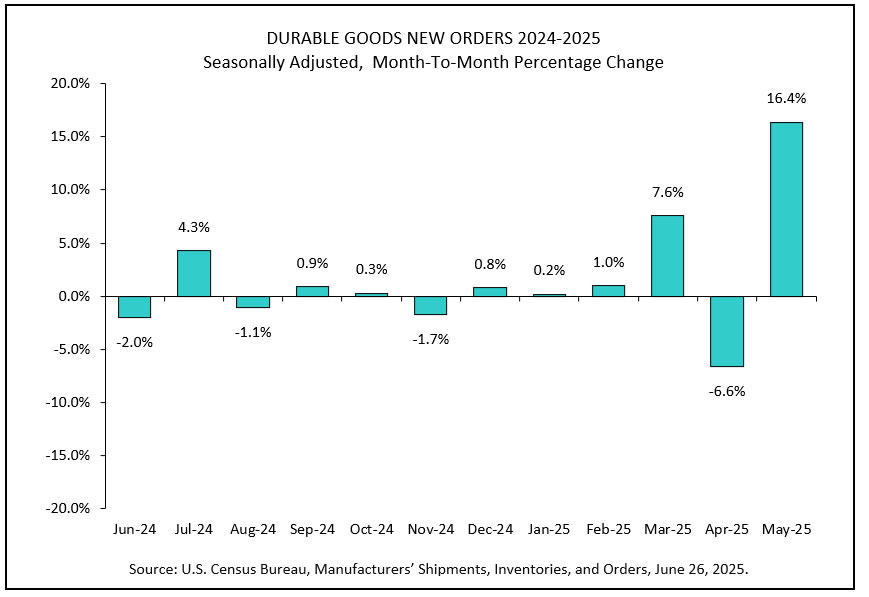
Economic data from the US did little to reverse the greenback’s decline. Finalized Q1 GDP was revised down to -0.5%, reinforcing concerns about underlying growth momentum. Durable goods orders surprised to the upside at 16.4%, but that strength was concentrated in a 48% surge in transportation equipment—most likely driven by tariff frontloading. Jobless claims fell more than expected, but signs of labor market resilience were not enough to shift the rate cut narrative.
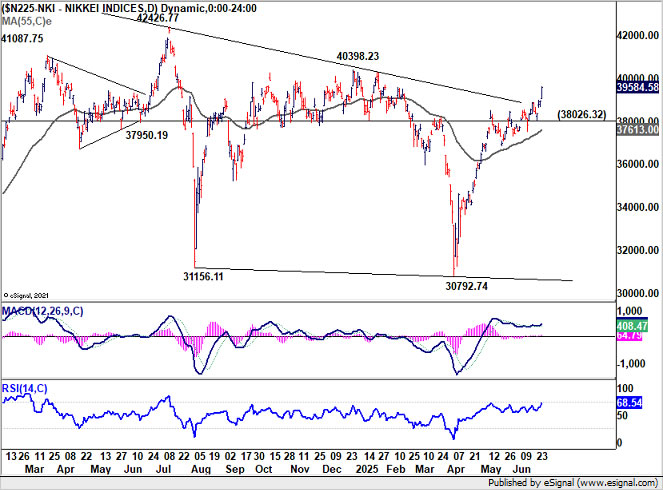
Earlier today, Japan’s Nikkei surged to a five-month high, with tech and chip-related stocks outperforming amid robust investor appetite linked to artificial intelligence demand. Despite pressure on automakers tied to slowing progress in US-Japan trade negotiations, the broader index rallied.
Technically, the break of trend line resistance solidifies that case medium term correction from 4246.77 has completed with three waves down to 30792.74. Further rally is expected in Nikkei as long as 38026.32 support holds. Break of 40398.23 will bring retest of 42426.77.
In Europe, at the time of writing, FTSE is up 0.24%. DAX is up 0.36%. CAC is down -0.01%. UK 10-year yield is down -0.02 at 4.464. Germany 10-year yield is down -0.023 at 2.549. Earlier in Asia, Nikkei rose 1.65%. Hong Kong HSI fell -0.61%. China Shanghai SSE fell -0.22%. Singapore Strait Times rose 0.32%. Japan 10-year JGB yield rose 0.02 to 1.425.
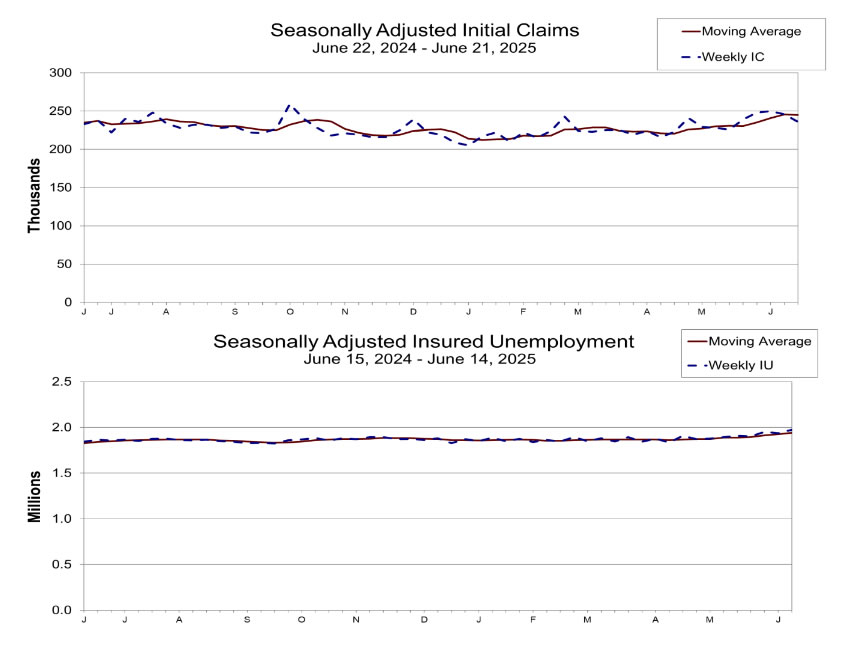
US durables rise 16.4% mom in May, transportation surges 48.3% mom
US durablg goods orders rose 16.4% mom to USD 343.6B in May, well above expectation of 6.8% mom. Ex-transport orders rose 0.5% mom, above expectation of 0.1% mom. Excluding defense, new orders increased 15.5% mom. Transportation equipment, up five of the last six months, led the increase, by 48.3% mom to USD 145.3B.
US initial jobless claims fall to 236k vs exp 247k
US initial jobless claims fell -10k to 236k in the ween ending June 21, below expectation of 247k. Four-week moving average of initial claims fell -750 to 245k.
Continuing claims rose 37k to 1974k in the week ending June 14, the highest level since November 6, 2021. Four-week moving average of continuing claims rose 17k to 1941k, highest since November 20, 2021.
BoE's Bailey: Policy still restrictive to squeeze out sticky inflation
BoE Governor Andrew Bailey said in a speech today that while the UK has made notable progress on disinflation, monetary policy remains restrictive to "squeeze out remaining persistence in inflationary pressures".
Speaking weeks ahead of the August policy meeting, Bailey stressed the presence of “two-sided risks” to inflation. He emphasized that a "gradual and careful approach" remains appropriate and monetary policy is "not on a pre-set path".
Germany’s Gfk consumer sentiment falls to -20.3, mood sours slightly as precautionary saving picks up
German consumer sentiment slipped slightly in July, with the Gfk index easing from -20.0 to -20.3, missing expectations of a recovery to -19.0.
The drop came despite a strong rebound in the economic expectations component, which surged seven points to 20.1—its highest since the early stages of the Ukraine war. Income expectations also improved for the fourth consecutive month, rising to 12.8.
Yet the consumer climate remains weighed down by caution. The willingness-to-buy index was subdued at -6.2. The notable jump in the savings indicator to 13.9, the highest since April 2024, suggests that households are still holding back on discretionary spending.
GfK’s Rolf Bürkl pointed to rising savings as a key drag, reflecting continued uncertainty and a lack of confidence in making large purchases.
USD/JPY Mid-Day Outlook
Daily Pivots: (S1) 144.59; (P) 145.27; (R1) 145.93; More...
USD/JPY's fall from 148.01 extends lower today, but stays above 142.10 support. Intraday bias remains neutral and further rise is still in favor. On the upside. firm break of 148.64 will resume the rise from 139.87 to 61.8% retracement of 158.86 to 139.87 at 151.22. However, break of 142.10 will bring deeper fall back to retest 139.87 low.
In the bigger picture, price actions from 161.94 are seen as a corrective pattern to rise from 102.58 (2021 low), with fall from 158.86 as the third leg. Strong support should be seen from 38.2% retracement of 102.58 to 161.94 at 139.26 to bring rebound. However, sustained break of 139.26 would open up deeper medium term decline to 61.8% retracement at 125.25.
US durables rise 16.4% mom in May, transportation surges 48.3% mom
US durable goods orders rose 16.4% mom to USD 343.6B in May, well above expectation of 6.8% mom. Ex-transport orders rose 0.5% mom, above expectation of 0.1% mom. Excluding defense, new orders increased 15.5% mom. Transportation equipment, up five of the last six months, led the increase, by 48.3% mom to USD 145.3B.
US initial jobless claims fall to 236k vs exp 247k
US initial jobless claims fell -10k to 236k in the ween ending June 21, below expectation of 247k. Four-week moving average of initial claims fell -750 to 245k.
Continuing claims rose 37k to 1974k in the week ending June 14, the highest level since November 6, 2021. Four-week moving average of continuing claims rose 17k to 1941k, highest since November 20, 2021.
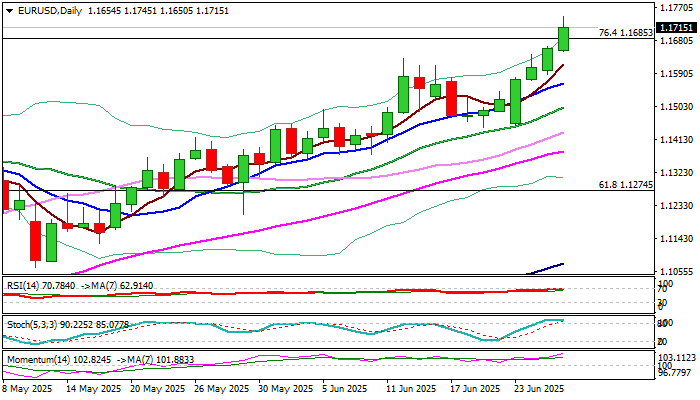
EUR/USD: Continues to Trend Higher and Hit New 2025 Highs
EURUSD extends steep ascend into fourth consecutive day and hit new 2025 high (also the highest since Sep 2021) on Thursday.
Revived risk appetite on signs that the ceasefire in Middle East was so far stable and weaker dollar on fresh concerns about the independence of the US central bank, on signals that President Trump may replace Jerome Powel from the position of Fed Chairperson, continue to lift the single currency.
Bullish daily studies (strong positive momentum/MA’s in full bullish setup) also contribute to near-term outlook.
Break through Fibo barrier at 1.1685 (76.4% of 1.2349/0.9536 downtrend) sparked fresh extension higher which eyes next target at 1.1800, violation of which to unmask Fibo projections at 1.1887 and 1.1961, ahead of key barrier at 1.2000 (psychological/200MMA).
Meanwhile, bulls may take a breather as studies are overbought, with extended dips to hold above 1.1600 (daily Tenkan-sen) and provide better levels to re-enter bullish market.
Res: 1.1767; 1.1800; 1.1887; 1.1961.
Sup: 1.1685; 1.1650; 1.1600; 1.1563.
BoE’s Bailey: Policy still restrictive to squeeze out sticky inflation
BoE Governor Andrew Bailey said in a speech today that while the UK has made notable progress on disinflation, monetary policy remains restrictive to "squeeze out remaining persistence in inflationary pressures".
Speaking weeks ahead of the August policy meeting, Bailey stressed the presence of “two-sided risks” to inflation. He emphasized that a "gradual and careful approach" remains appropriate and monetary policy is "not on a pre-set path".
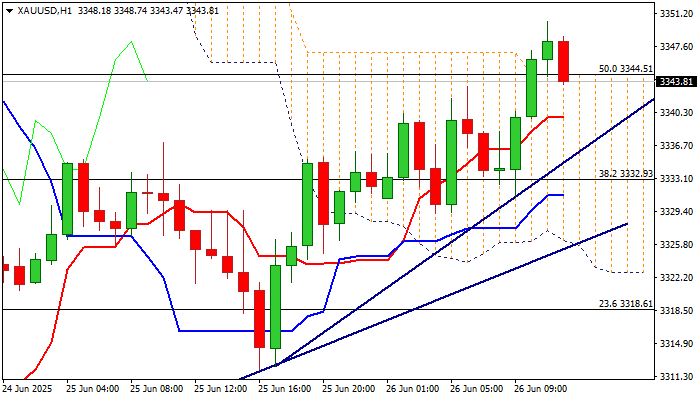
XAU/USD: Extension of Recovery from $3,300 Support Brightens Near-Term Picture
Gold extends recovery from strong support at $3300 zone, where recent drop was contained, with formation of bear-trap pattern on daily chart, adding to bullish near-term outlook.
Weaker dollar and fresh concerns over renewed clash between President Trump and Fed Chief Powell over the monetary policy and signals that Trump is looking for Powell’s replacement, contributed to renewed safe-haven demand.
Fresh gains on Thursday cracked important barrier at $3345 (100HMA / 50% retracement of $3393/$3295 bear-leg / hourly cloud top) that unmasks targets at $3356 (Fibo 61.8% / 20DMA) and $3370 (Fibo 76.4% / 10DMA), guarding upper breakpoint at $3400.
Partial profit-taking is likely to interrupt bulls, with dips should find ground at $3338/35 zone (10HMA / trendline support) to mark healthy correction and positioning for fresh push higher.
Res: 3350; 3356; 3370; 3400.
Sup: 3342; 3338; 3335; 3330.
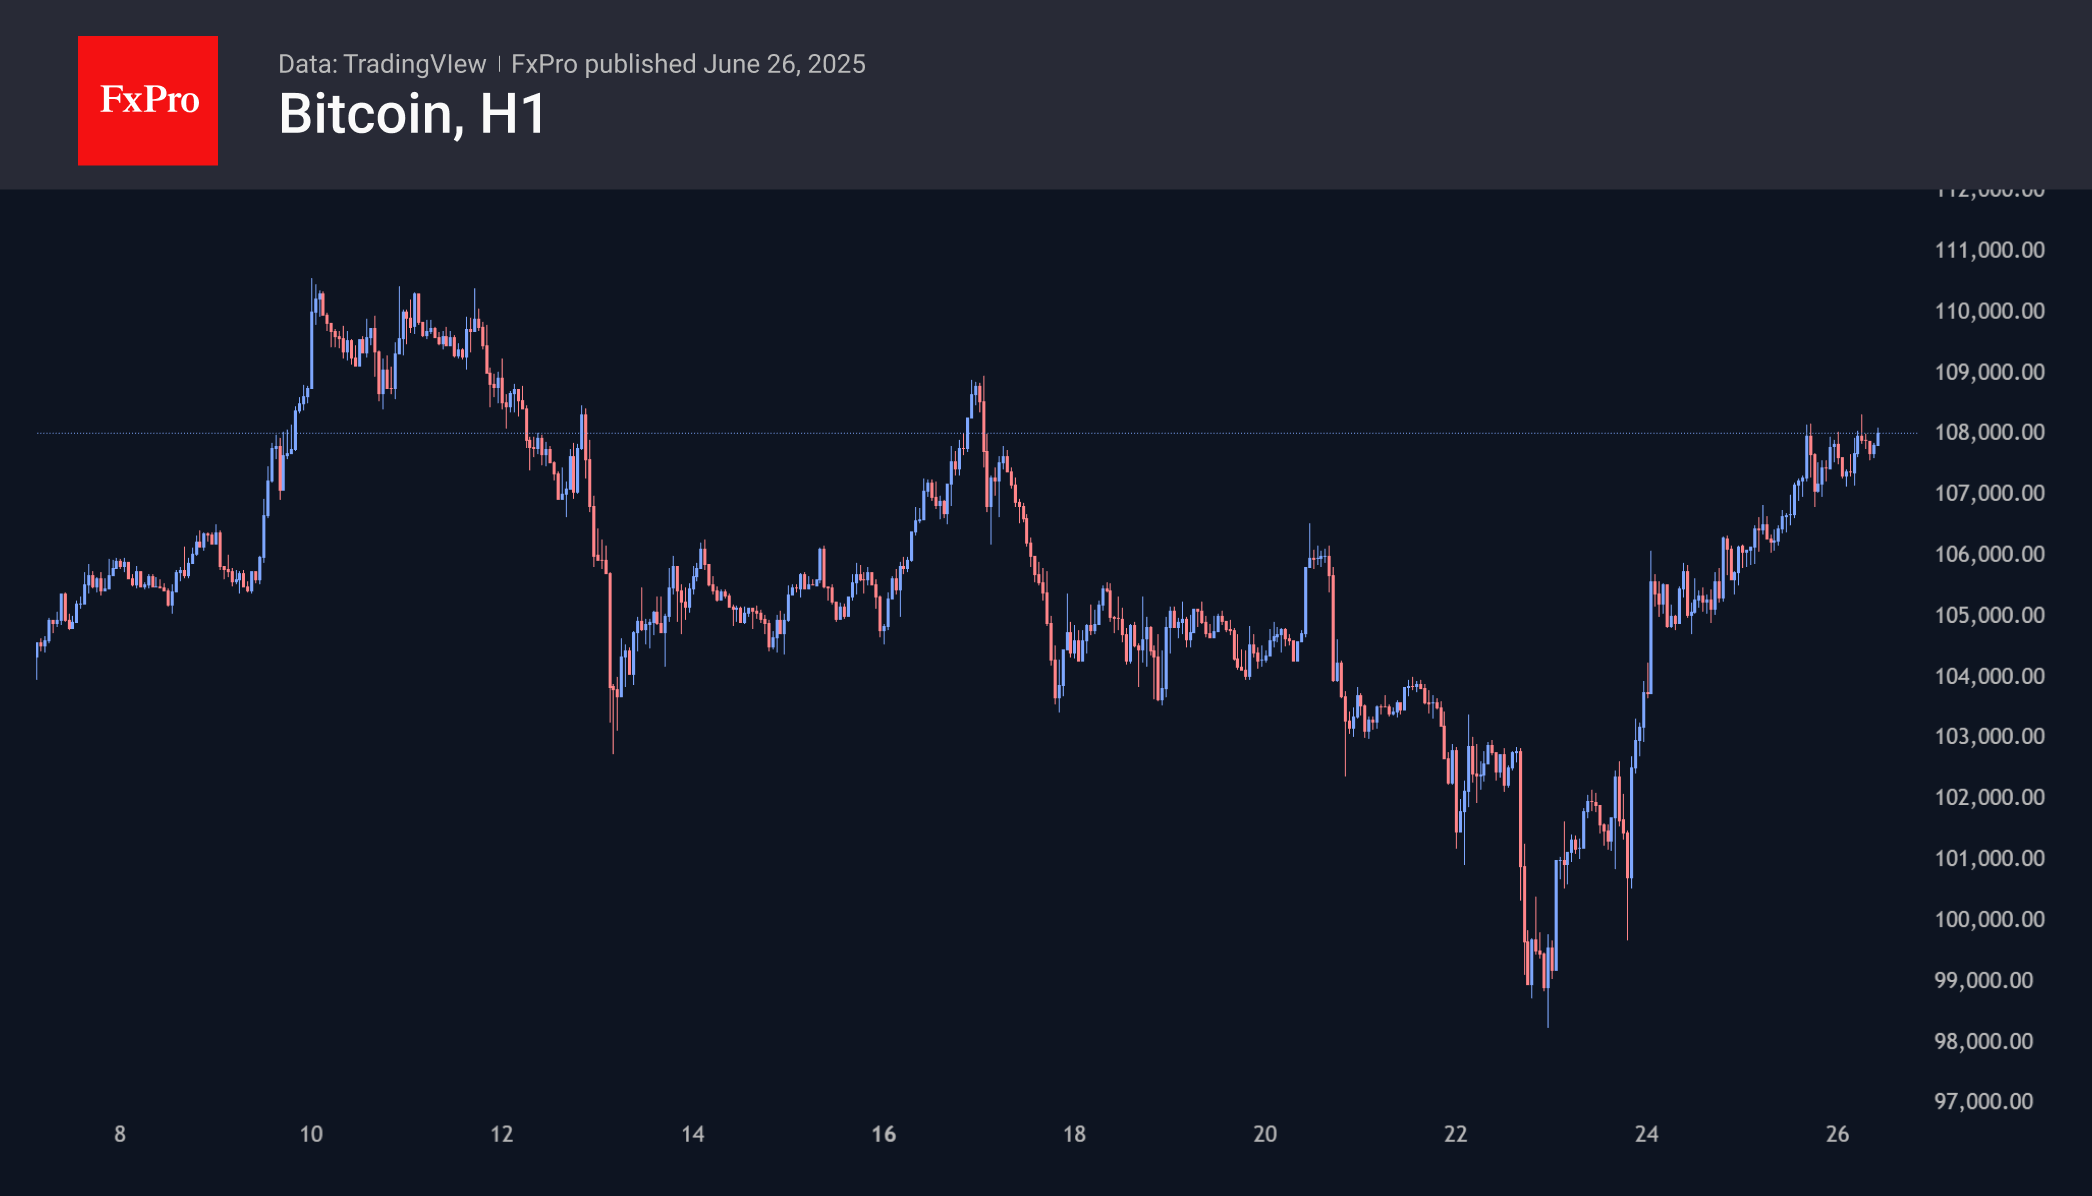
Crypto Market on the Verge of Previous Extremes
Market Picture
The crypto market cap increased by another 1% to $3.31 trillion, reaching the threshold of increased volatility. Just above that, in the $3.40–3.55 trillion range, is a turning point, which has activated sellers and prevented the market from consolidating higher.
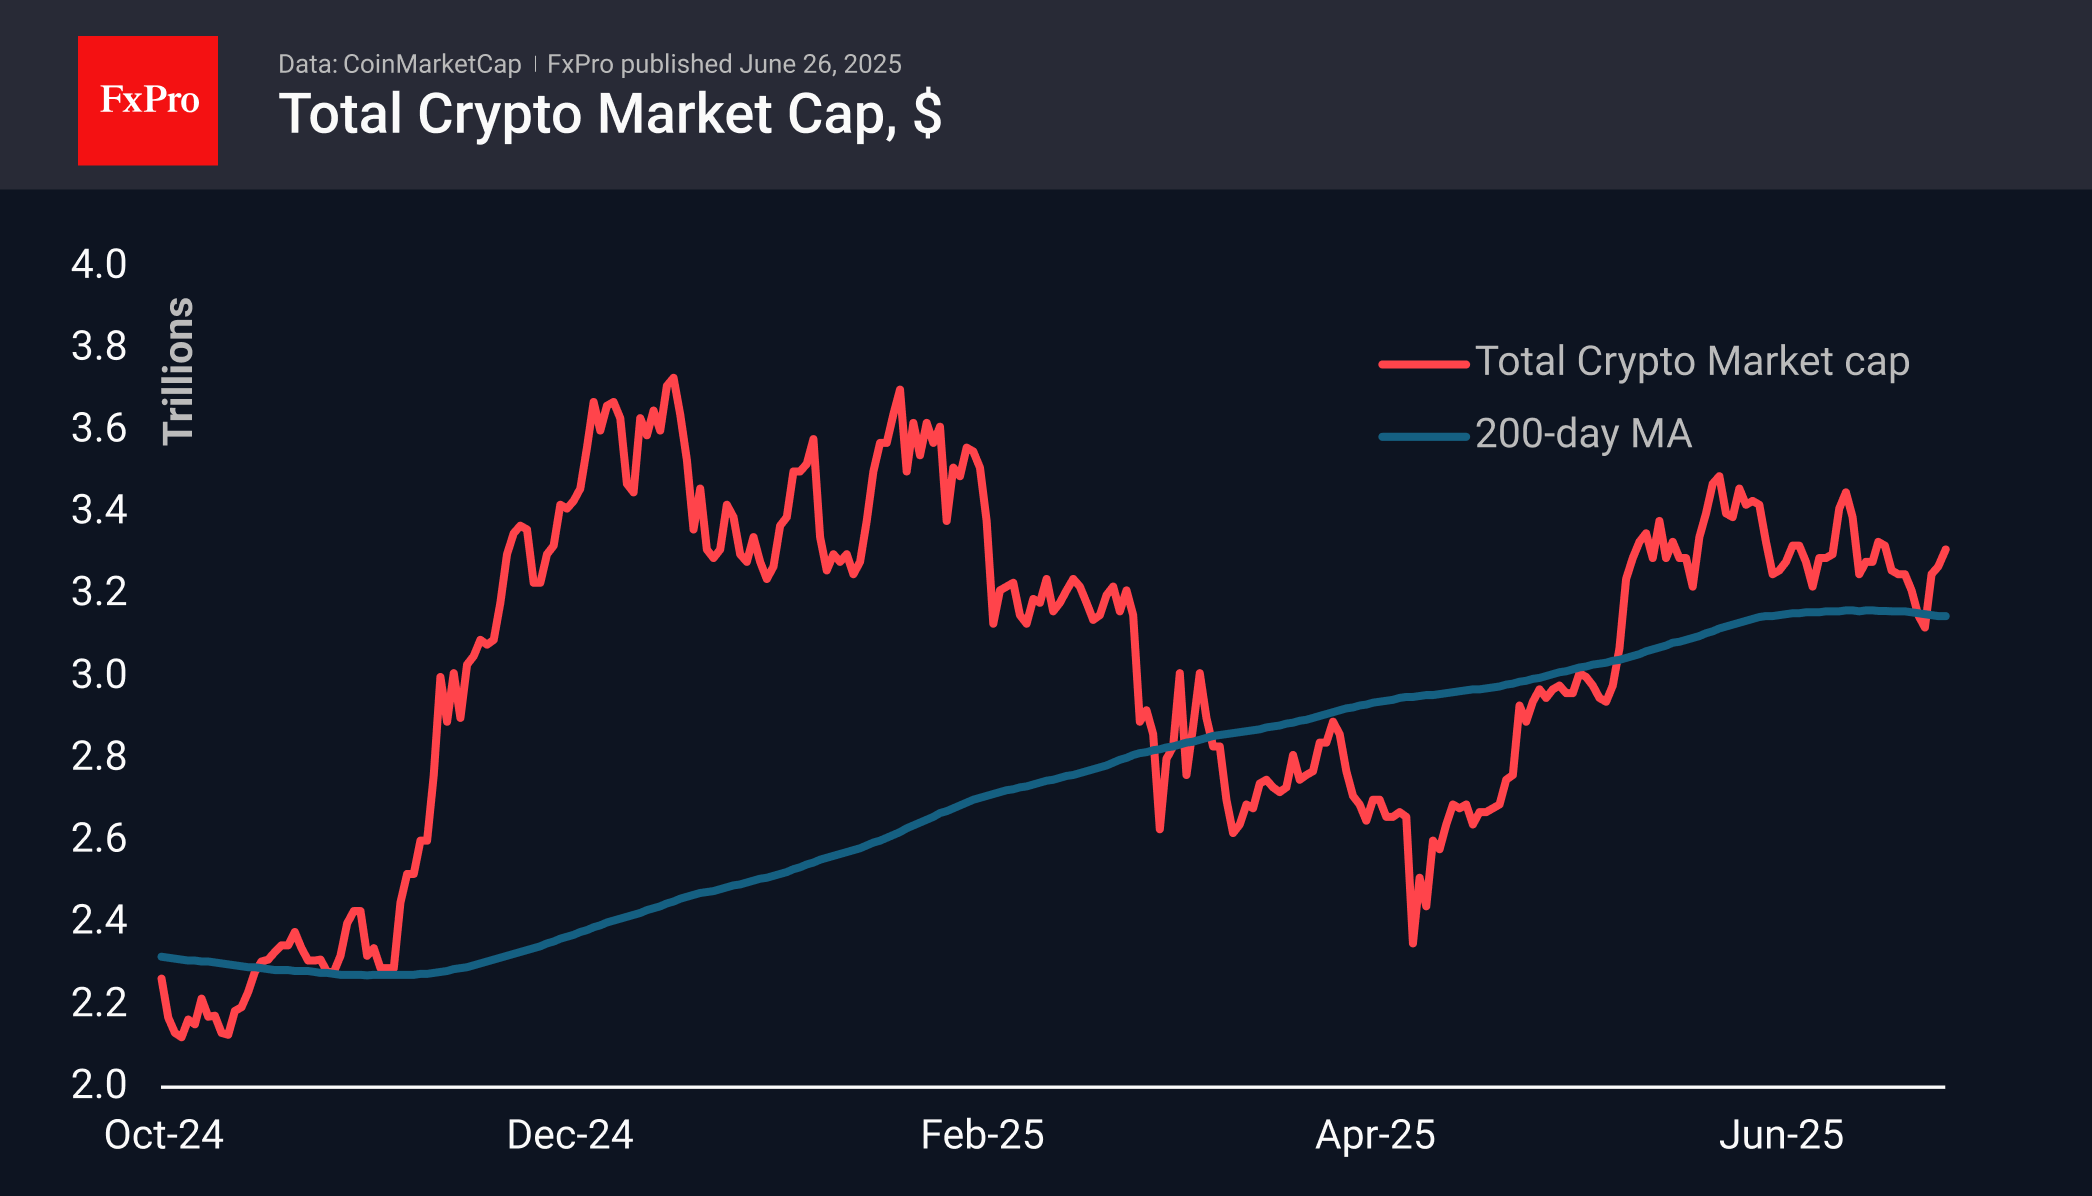
The cryptocurrency sentiment index is at 74, just 1 point below the ‘extreme greed’ zone and in the range of the highs of the second half of May. At that time, the market capitalisation was at approximately the same level.
Since the end of Wednesday, Bitcoin has been testing the $108K mark, but it will sell off when it touches this level. Over the past couple of days, we have seen a smooth but steady intraday uptrend, accompanied by heavy buying from medium—and long-term investors. We see this as a sign of buying by professional market participants and link it to strengthening stocks, which increases the likelihood of reaching $110K or even $112K as early as this week.
News Background
Inflows into Bitcoin ETFs continue to influence the price of the first cryptocurrency, while companies’ purchases for their Bitcoin reserves have virtually no impact, according to K33. Experts warn of likely high volatility in the crypto market due to Trump’s upcoming budget bill and the 9 July tariff deadline.
According to The Block, the Bitcoin dominance index, which reflects its market share compared to other crypto assets, rose to 62% after falling to 59% in May. This raises questions about the onset of the altcoin season.
Fed Chair Jerome Powell said the US needs a regulatory framework for stablecoins. The GENIUS Act, passed by the Senate last week, is awaiting consideration in the House of Representatives.
Barclays, one of the UK’s largest banks, has banned its customers from buying cryptocurrency with Barclaycard credit cards. The bank said that falling cryptocurrency prices could lead to debts that customers would be unable to repay.
Tether CEO Paolo Ardoino said the company could become the largest Bitcoin miner by the end of 2025. According to him, the company’s goal is not commercial gain but protecting its assets. The company owns more than 100,000 BTC and wants to participate in securing the network to protect these investments.
Pound Hits Multi-Year High as Bank of England Signals Rate Cut Readiness
The GBP/USD pair surged to 1.3704, reaching its highest level since January 2022.
This rally was driven by a weakening US dollar, growing expectations of a Federal Reserve rate cut, and easing geopolitical tensions.
Market expectations for an imminent Fed rate reduction strengthened after Chair Jerome Powell suggested that weaker inflation or employment data could prompt faster action from the central bank.
In the UK, Bank of England (BoE) Governor Andrew Bailey and Deputy Governor Dave Ramsden signalled that interest rate cuts are on the horizon. They highlighted signs of a cooling labour market, including slowing wage growth and rising economic inactivity. However, Bailey cautioned about reliability issues in recent employment data.
Ramsden, who voted for a rate cut, cited the labour market slowdown as a key factor. He also warned of the risk of inflation falling below the BoE’s 2% target.
Meanwhile, markets are closely watching the truce between Israel and Iran, which has reduced fears of further escalation and potential inflationary shocks.
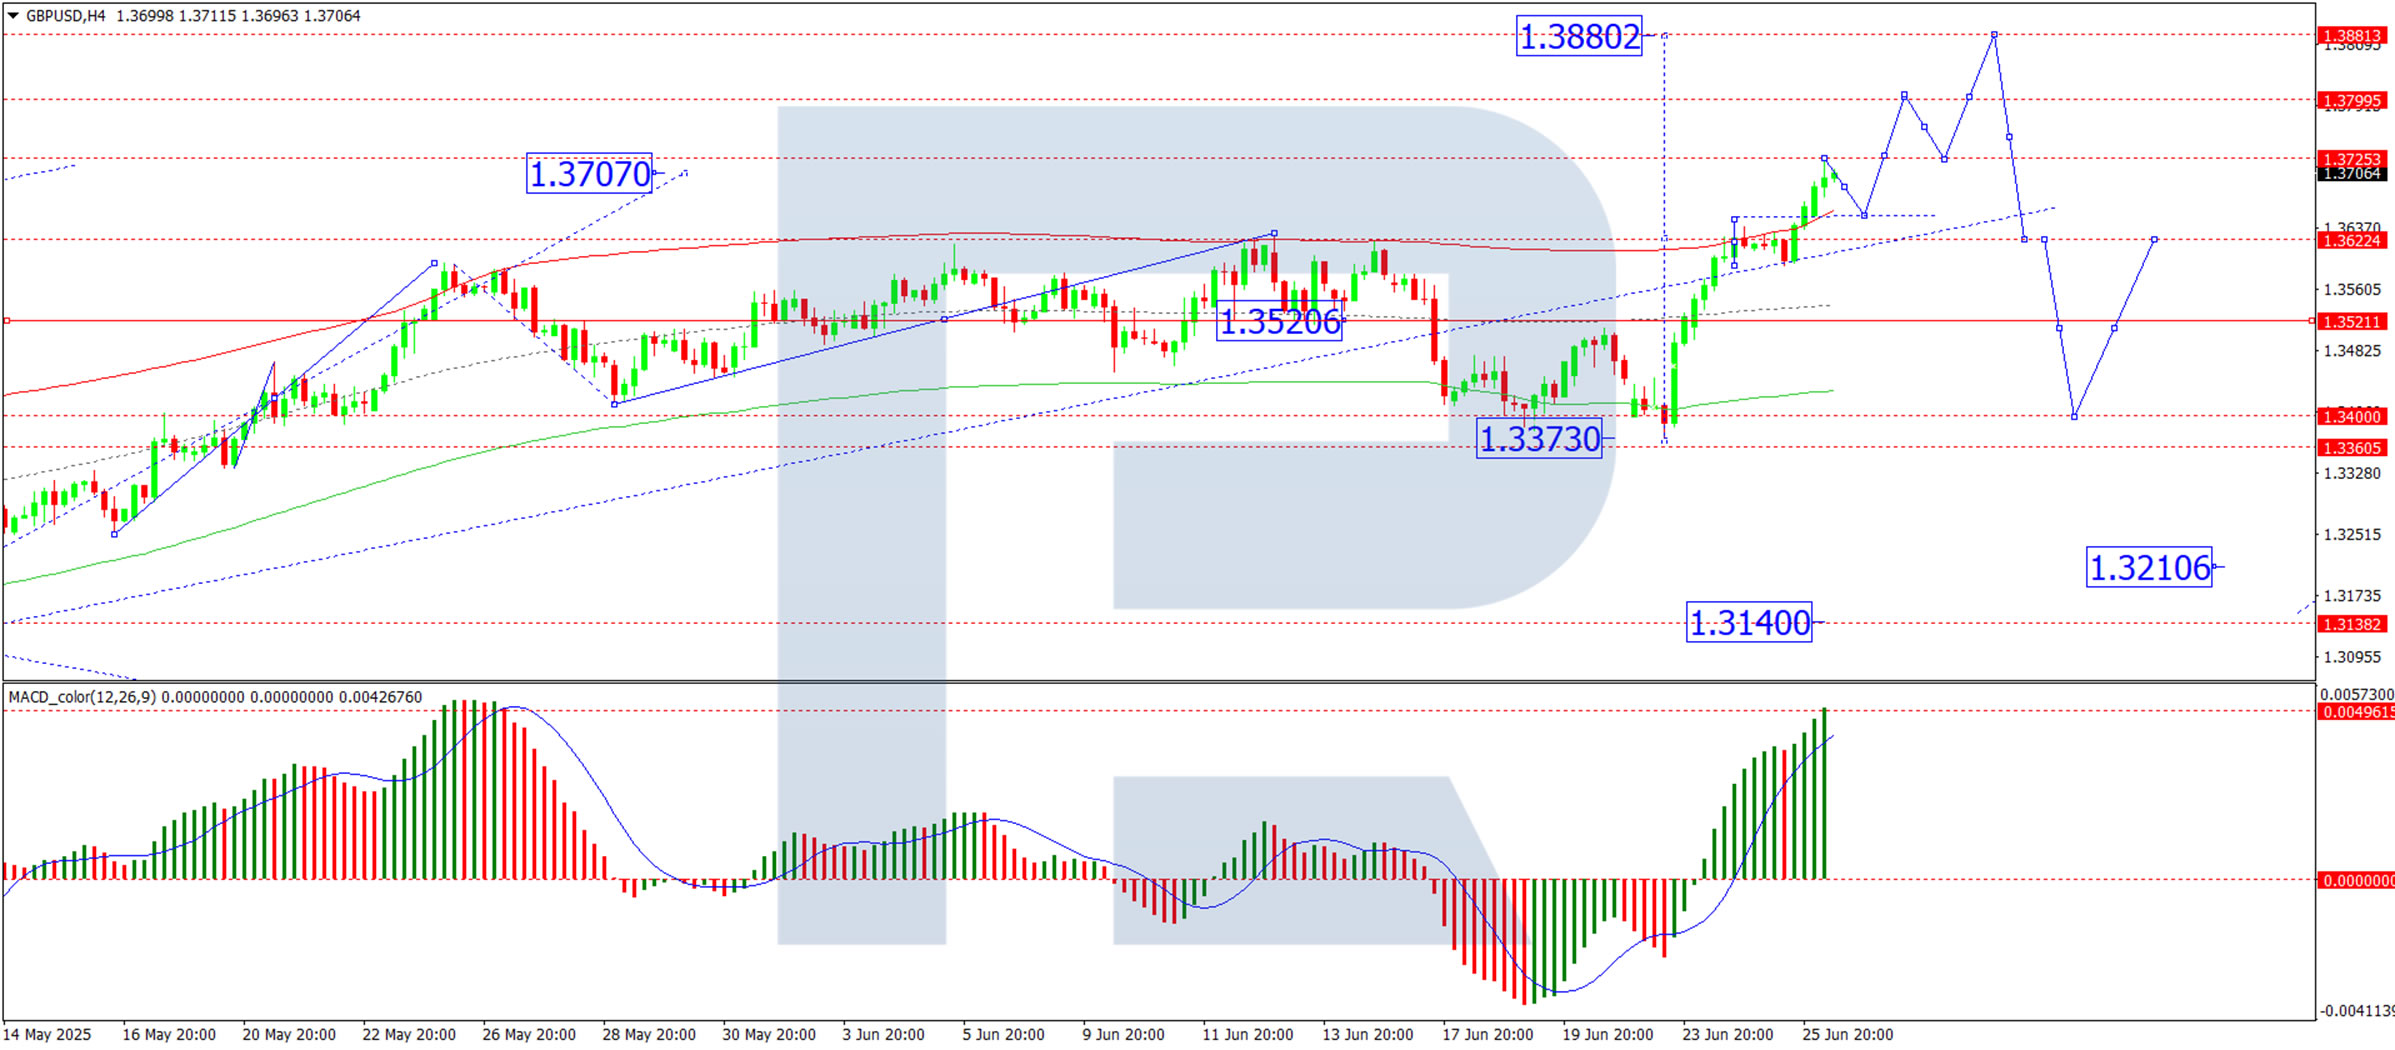
Technical Analysis: GBP/USD
H4 Chart:
On the H4 chart, GBP/USD formed a tight consolidation range around 1.3622 before breaking higher. The pair has now breached the upper boundary of a broader consolidation range, suggesting potential for further gains. The next upside target is 1.3880, supported by the MACD indicator, where the signal line remains above zero and trending upwards.
H1 Chart:
On the H1 chart, the pair completed an upward wave to 1.3723. A short-term pullback towards 1.3630 is possible before another potential rally towards 1.3810. This scenario is supported by the Stochastic oscillator, where the signal line is below 80 and descending towards 20.
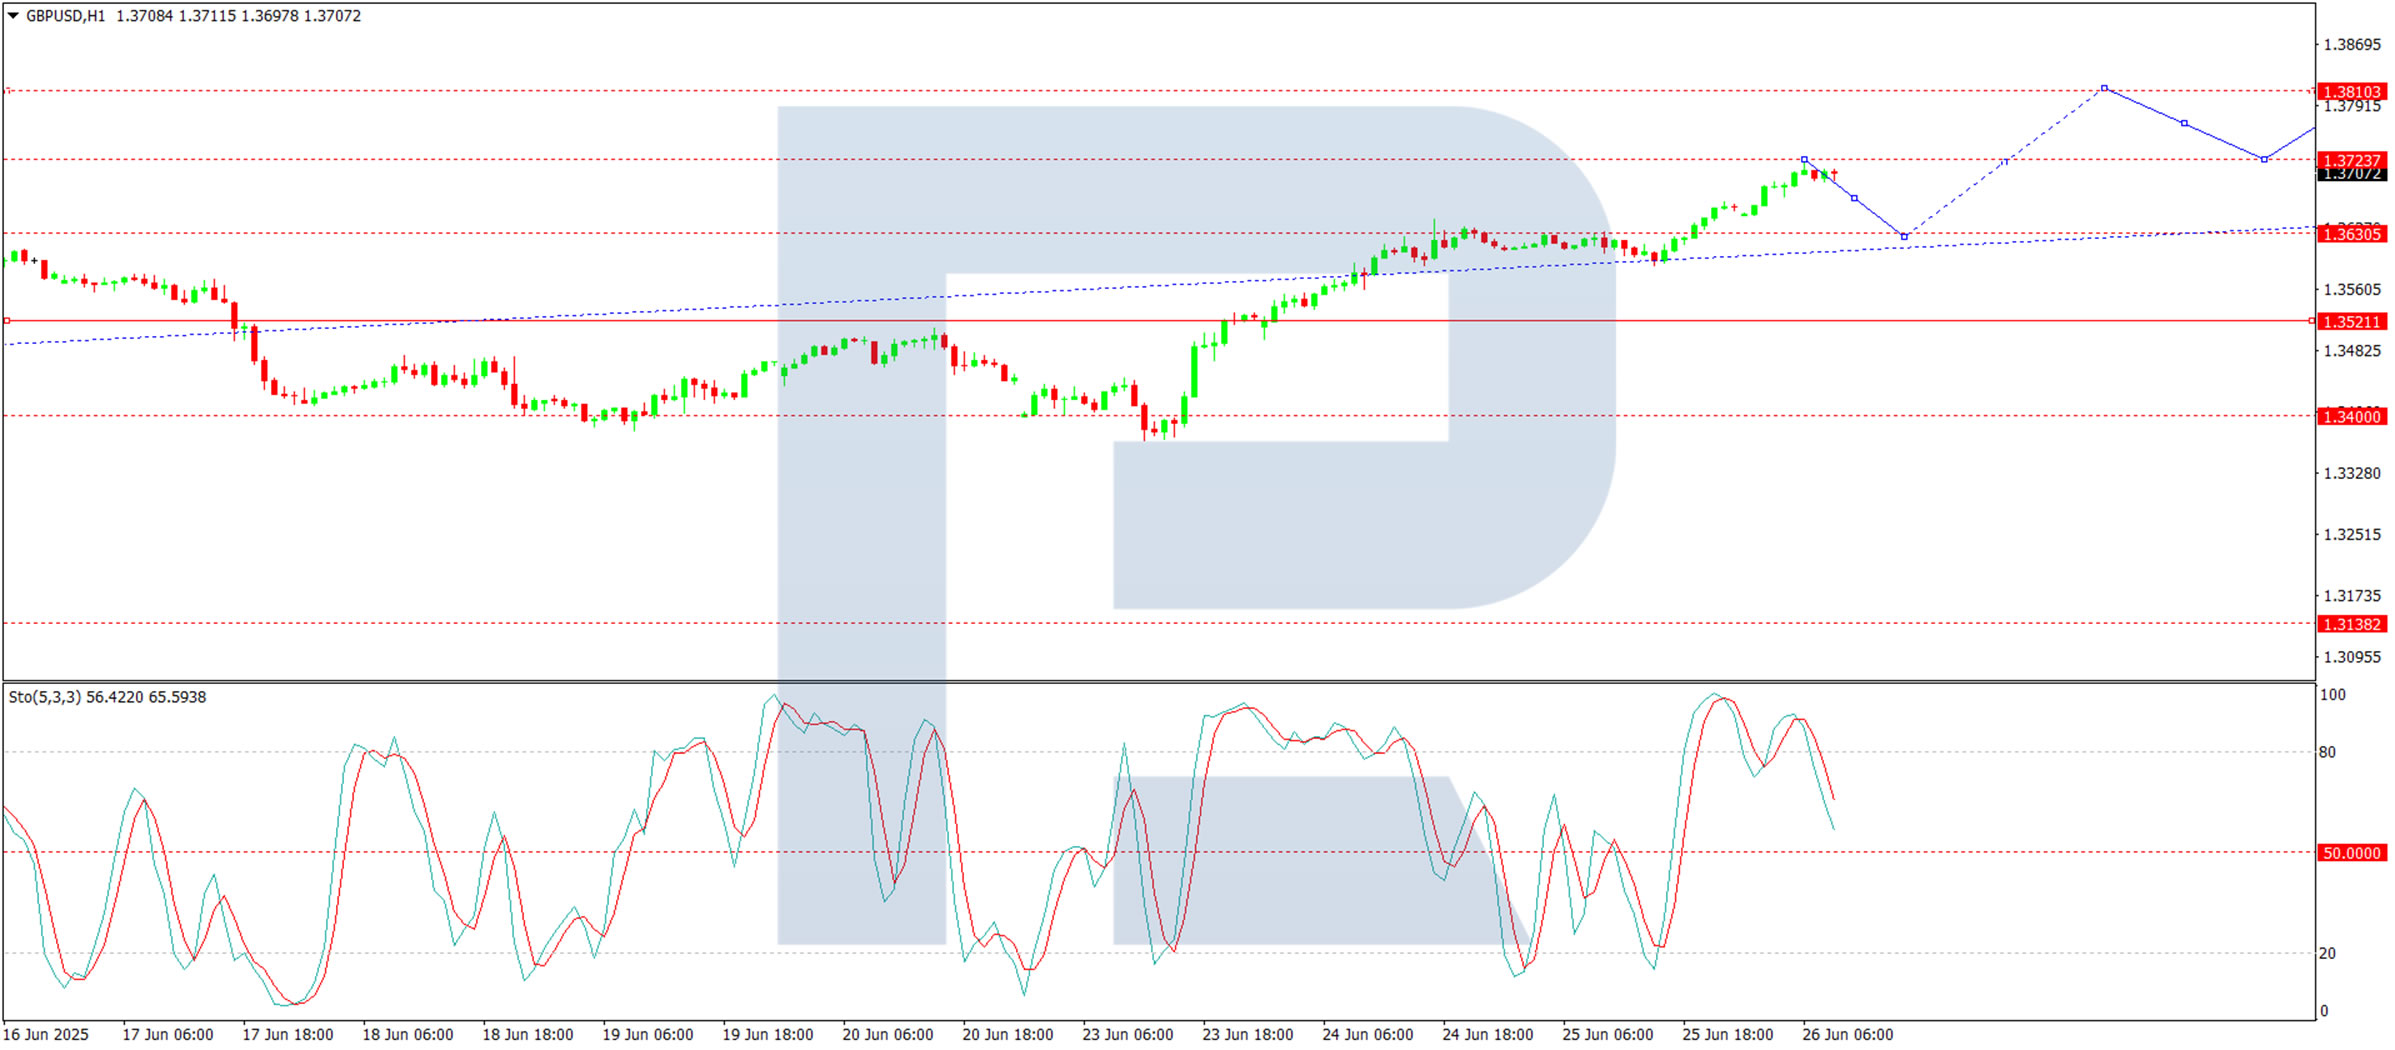
Conclusion
The pound’s rally reflects dollar weakness and BoE rate cut expectations, while technical indicators suggest further upside potential after a possible brief correction.
US Dollar Nears Key Breakdown Level, Nikkei 225 Bullish Breakout from Range
The recent two-day risk-on rally in the US stock market showed signs of fatigue as attention turns to upcoming economic data, Fed policy guidance, and tariff-related developments. Market participants are now eyeing the expiration of the White House’s 90-day pause on reciprocal global tariffs (excluding China), set for 9 July.
Risk-on euphoria in the US stock market fades
On Wednesday, 25 June, early intraday gains across major US equity benchmarks largely faded by the close. The Dow Jones Industrial Average and the small-cap Russell 2000 underperformed, losing -0.3% and -1.2%, respectively. The S&P 500 ended flat, while the tech-heavy Nasdaq 100 edged up 0.2% to a new all-time intraday high, driven by Nvidia’s 4.3% surge to a record close.
Asia equities diverge, led by Japan
Asian stock markets remained mostly buoyant, supported by a weakening US dollar. Japan’s Nikkei 225 outperformed with a 1.4% intraday gain, breaking above a 7-week trading range to reach a 4-month high. Singapore’s Straits Times Index rose 0.21%, while the Hang Seng Index slipped -0.5%, bucking the regional trend.
Fed Chair Powell maintains cautious tone
In his second day of testimony before the US Congress (Senate Banking Committee), Fed Chair Jerome Powell reiterated remarks from Tuesday, stating that the Fed remains uncertain about the inflationary impact of new US tariffs. He emphasized that there is no urgency to cut interest rates.
The US dollar weakens further as the euro and sterling hit multi-year highs
The US dollar extended its decline for a third straight session. The US Dollar Index fell -0.3% on Wednesday and slipped another -0.2% in today’s Asia mid-session, nearing a critical long-term support at 97.40. A weekly close below this level could signal the start of a multi-month downtrend.
Meanwhile, the euro strengthened for a fifth consecutive day to $1.1665, its highest since October 2021. Sterling climbed to $1.3670, the strongest since February 2022. In Asia trade, the top-performing currencies against the greenback were the GBP (+0.3%), JPY (+0.2%), and AUD (+0.1%).
The Japanese yen showed renewed strength, with USD/JPY falling to 144.80—below the 145.00 psychological threshold—ahead of key Tokyo inflation and retail sales data due Friday. Consensus expects Tokyo core inflation to ease to 3.3% y/y in June from 3.6% in May, still well above the BoJ’s 2% target.
Gold holds above support amid dollar weakness
Gold (XAU/USD) continues to stabilize above its 50-day moving average and key support at US$3,300, rising slightly by 0.05% to US$3,334 in the Asia session, aided by ongoing US dollar softness.
Economic data releases
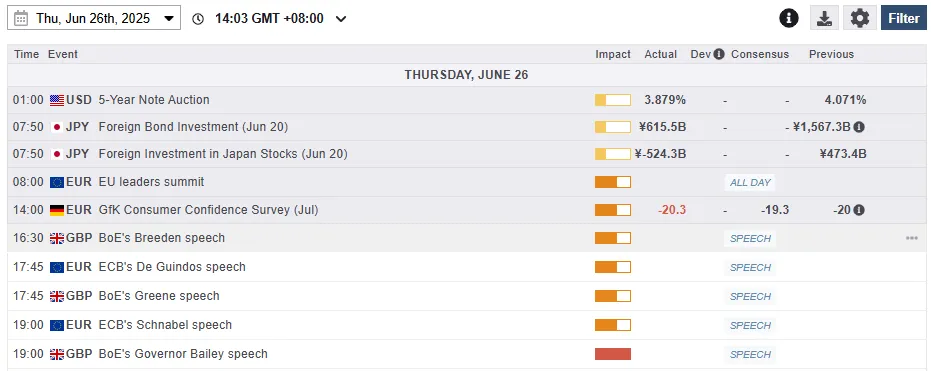
Fig 1: Key data for today’s Asia mid-session (Source: MarketPulse)
Nikkei 225 bullish breakout from 7-week Ascending Triangle range
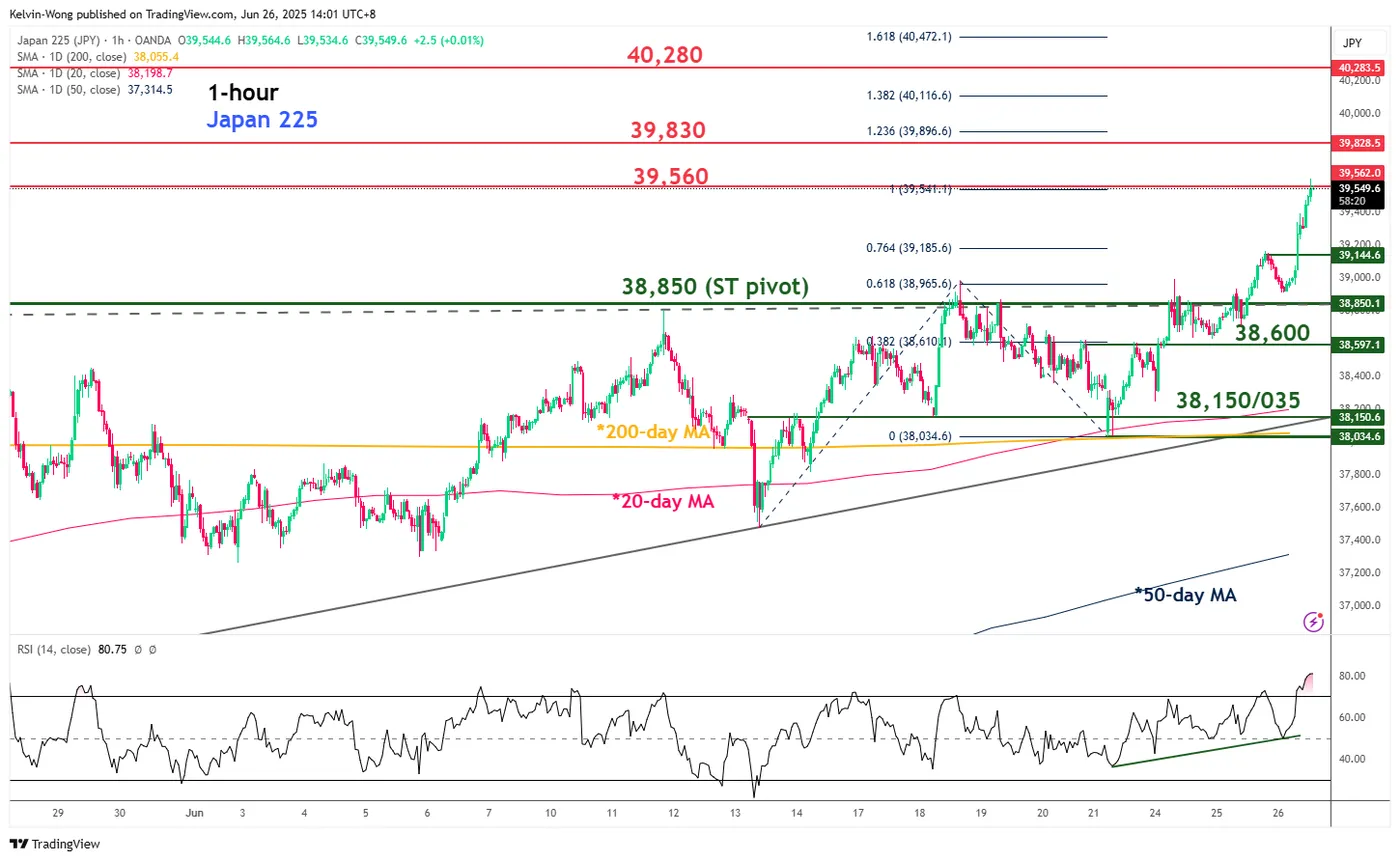
Fig 2: Japan 225 CFD Index minor trend as of 26 June 2025 (Source: TradingView)
The price actions of the Japan 225 CFD Index (a proxy for the Nikkei 225 futures) have staged a bullish breakout from a 7-week “Ascending Triangle” range configuration, previously in place since 13 May 2025 that indicates the start of a potential multi-week impulsive up move sequence within its medium-term uptrend phase in place since 7 April 2025 low.
The hourly RSI momentum indicator has reached an extreme overbought level of 81.20, the highest since 28 May 2025, which suggests that the Japan 225 CFD Index may stage a minor pull-back at this juncture before resuming its bullish impulsive up move.
Watch the intermediate support at 39,145 and the 38,850 key short-term pivotal support to hold the minor pull-back movements with the next intermediate resistances coming in at 39,830, and 40,280 (15 October/30 December 2024 swing high areas (see Fig 2).
On the flip side, failure to hold above 38,850 invalidates the bullish breakout scenario for the continuation of the choppy corrective decline sequence to expose the next intermediate supports at 38,600 and 38,150/38,035 (also the 20-day and 200-day moving averages).