

Sample Category Title
WTI: Bears Pause Above Daily Cloud
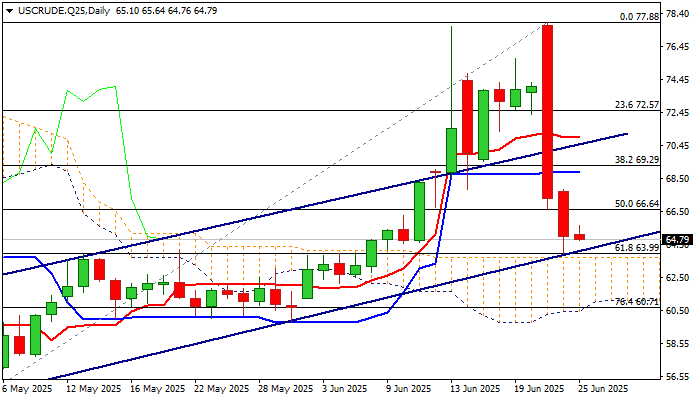
WTI oil price ticked higher on Wednesday morning as bears take a breather after a massive losses in past two days (down around 16%).
Bears found solid support at $64.00 zone (Fibo 61.8% of $55.40/$77.88 rally / just above top of thick daily Ichimoku cloud) with oversold daily conditions adding to scenario of a partial profit-taking from recent sharp fall.
Recovery attempts were so far minimal and capped by broken 100DMA ($65.78) which now acts as initial resistance, still away from upper triggers at $67.25 (Fibo 23.6% of $77.88/$63.97), $68.55 (200DMA) and $69.28 (Fibo 38.2%), violation of which to generate stronger bullish signals.
Meanwhile, the downside is expected to remain at risk, as near-term picture heavily weighed by large bearish daily candles, daily bearish engulfing and weakened daily studies, as well as expectations from OPEC+ to further increase production.
Bears may hold in prolonged consolidation while supports at $64.00 zone hold, but loss of these supports would generate strong bearish signal and open way for continuation of fall from $77.88 (June 23 top).
Res: 65.78; 66.95; 67.25; 68.55.
Sup: 64.20; 64.00; 63.69; 62.50.
Crypto Market Taking a Break After Rebound
Market Picture
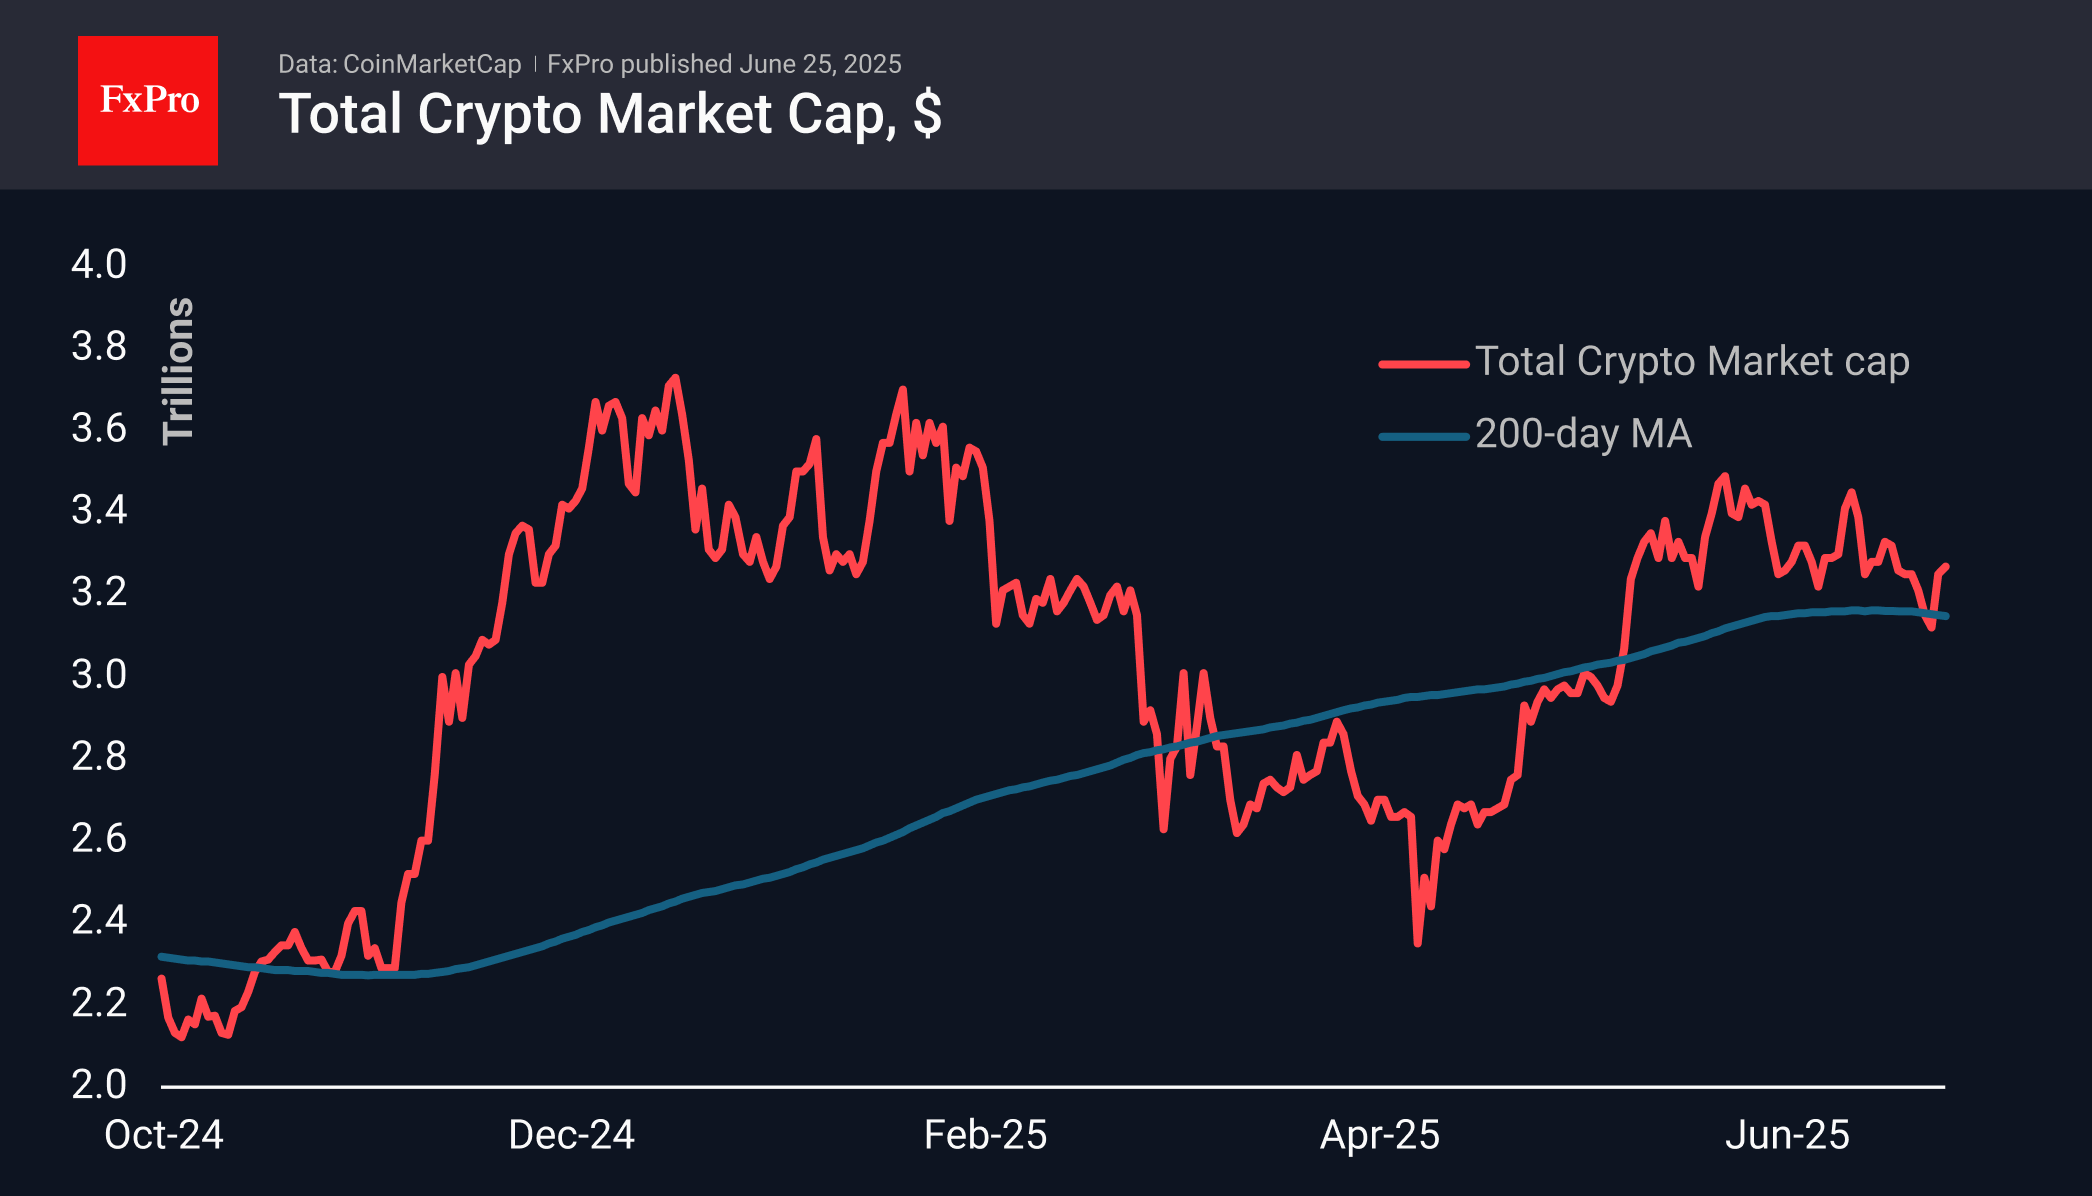
The crypto market capitalisation rose by 0.4% during the day to $3.27 trillion, stabilising near the levels we saw a week earlier. Technically, in recent days, the market has dipped below its 200-day moving average and rebounded sharply from it, confirming that it has turned from resistance to support.
Bitcoin is trading near $106K, returning to territory above the 50-day moving average, albeit very slightly. The dynamics of the last three days suggest a rapid assault on the highs. However, remaining almost 5% below its peak, the flagship cryptocurrency is behaving more cautiously than the Nasdaq 100, which updated its historical highs on Tuesday evening.
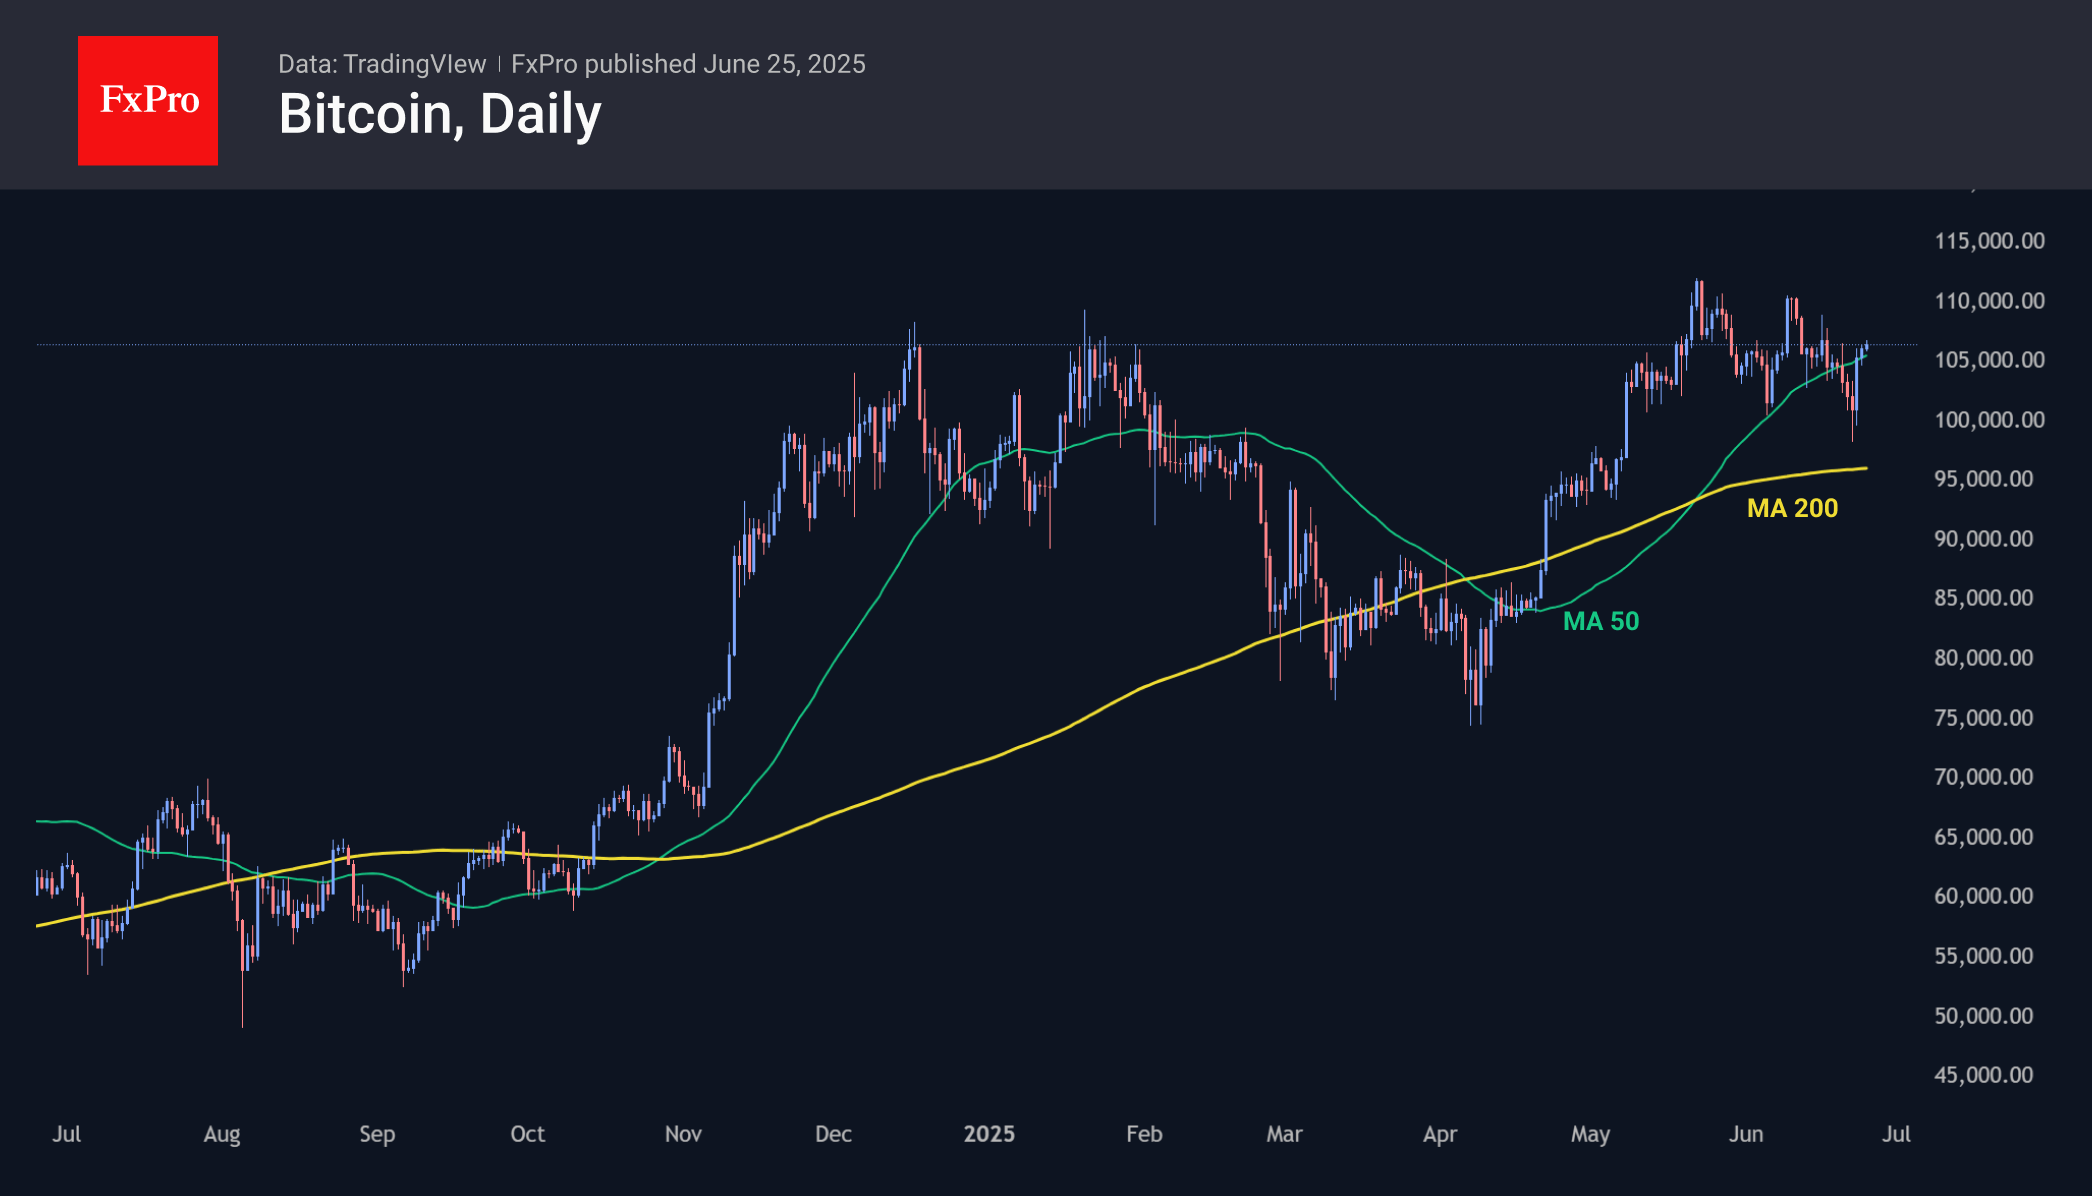
If the positive momentum in cryptocurrency stocks continues, they will soon catch up with traditional finance. In addition, the bulls managed to recapture important points, such as a rebound from the 200-day moving average for the entire market and a return above the 50-day moving average in BTC.
News Background
According to eToro, American private investors are actively increasing their investments in cryptocurrencies amid growing geopolitical tensions and a weakening dollar. About 58% of retail investors are actively adjusting their portfolios, increasing the share of cryptocurrencies.
Cryptocurrency company ProCap Financial, founded by Anthony Pompliano, has announced its entry into the US stock market through a merger with a public company. The deal will attract more than $750 million in investments in Bitcoin.
According to a Coinshares study, 80% of investors need advice on working with cryptocurrencies, but many doubt the competence of financial advisors. 75% of respondents are interested in the direction and are exploring the possibility of buying cryptocurrency. 89% of current holders plan to increase their investments in 2025.
EUR/USD Extends Rally as Risk Sentiment Improves
On Wednesday, EUR/USD climbed to 1.1621, marking its fifth consecutive session of gains with little interruption. The upward momentum reflects easing geopolitical tensions, which in turn have reduced the demand for traditional safe-haven assets.
The US-brokered ceasefire between Israel and Iran remains largely intact despite isolated incidents, while oil prices have retreated significantly from recent peaks. However, lingering uncertainties persist – reports suggest recent US missile strikes only partially damaged Iran’s critical nuclear facilities, merely delaying rather than halting its nuclear program.
Market attention remains fixed on Federal Reserve Chair Jerome Powell’s latest remarks. Reaffirming his commitment to curbing inflation, Powell signalled that interest rates are likely to stay on hold until the impact of trade tariffs on prices becomes clearer. Nevertheless, markets still price in a 20% probability of a rate cut as early as July.
Traders now await Powell’s upcoming Senate testimony and the latest US new home sales data for further direction.
Technical Analysis: EUR/USD
H4 Chart:
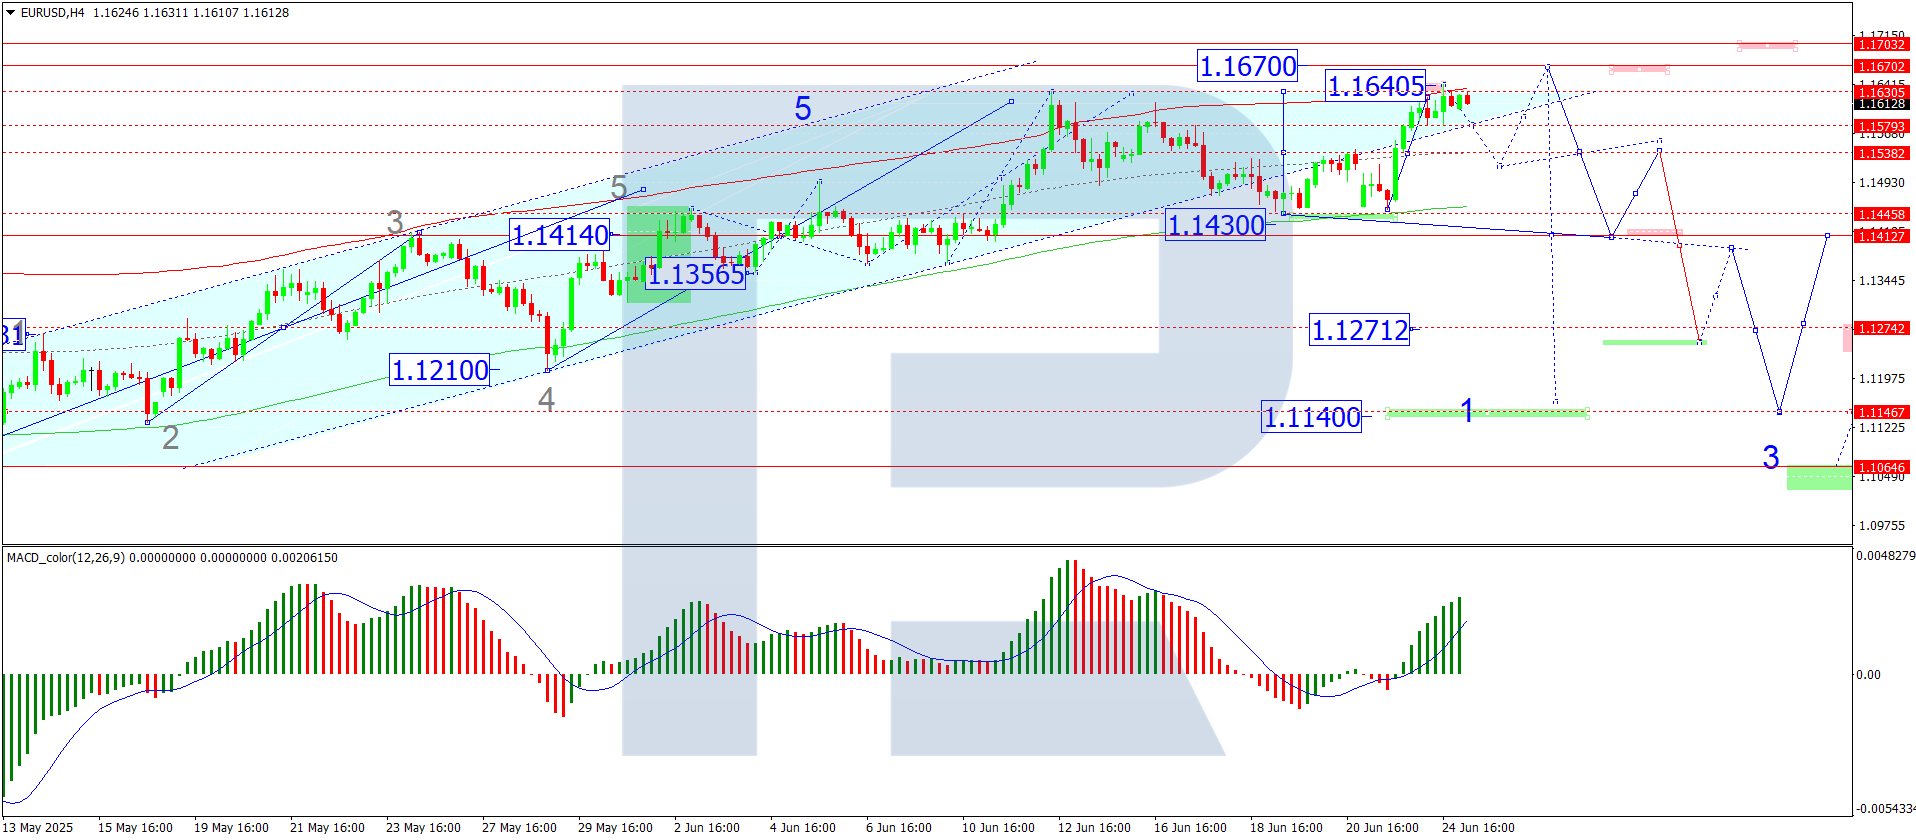
The EUR/USD breakout above 1.1540 propelled the pair towards 1.1640. Today, we anticipate consolidation below this level. A downside exit could trigger a retracement towards 1.1540, while an upward breakout may extend gains to 1.1670. Beyond this, we expect a potential downward wave targeting 1.1414, supported by the MACD indicator. The signal line, currently above zero and exiting the histogram zone, suggests a likely decline towards the baseline.
H1 Chart:
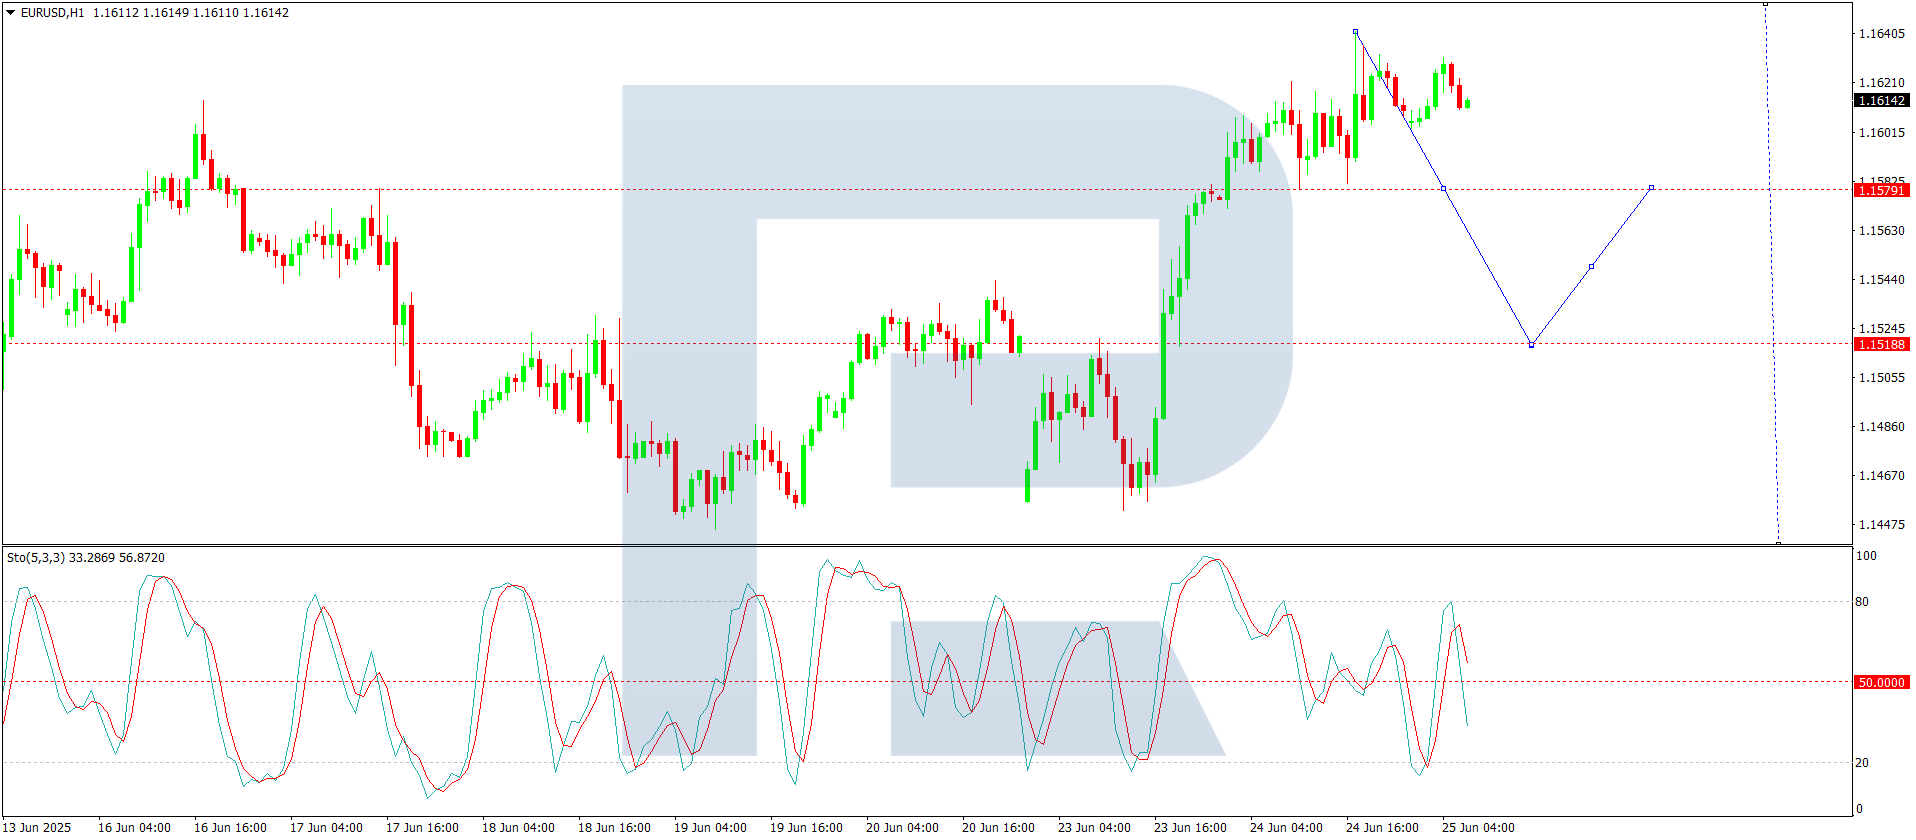
After finding support at 1.1518, the pair rallied to 1.1640, where a tight consolidation range is forming. A downward breakout appears probable – should 1.1580 give way, a decline towards 1.1518 may follow. This scenario is corroborated by the Stochastic oscillator, with its signal line below 80 and trending sharply downward towards 20.
Conclusion
The EUR/USD uptrend persists amid improving risk sentiment, though technical indicators suggest a potential pullback. Traders should monitor Powell’s testimony and US housing data for near-term catalysts.
Oil Price Falls Below Pre-Escalation Levels of Middle East Conflict
According to the XBR/USD chart:
→ Prior to Israel’s airstrikes on Iran on 13 June, the price of Brent crude was hovering around the $69.00 mark;
→ Following US bombings in Iran, the price spiked at the Monday market open, reaching a high of approximately $77.77 (as we reported on 23 June).
However, after President Trump announced a ceasefire between Iran and Israel — later confirmed by statements from both sides — oil prices dropped sharply. This morning, Brent is trading around $68, which is even lower than the level seen before the initial strikes.
Media outlets report that analysts broadly agree that fears have eased, even if the ceasefire appears fragile. Market participants seem to view the likelihood of the conflict escalating into a full-scale ground war — involving US troops and the closure of the Strait of Hormuz — as low. Shipping through the strait is reportedly returning to normal.
Technical Analysis of the XBR/USD Chart
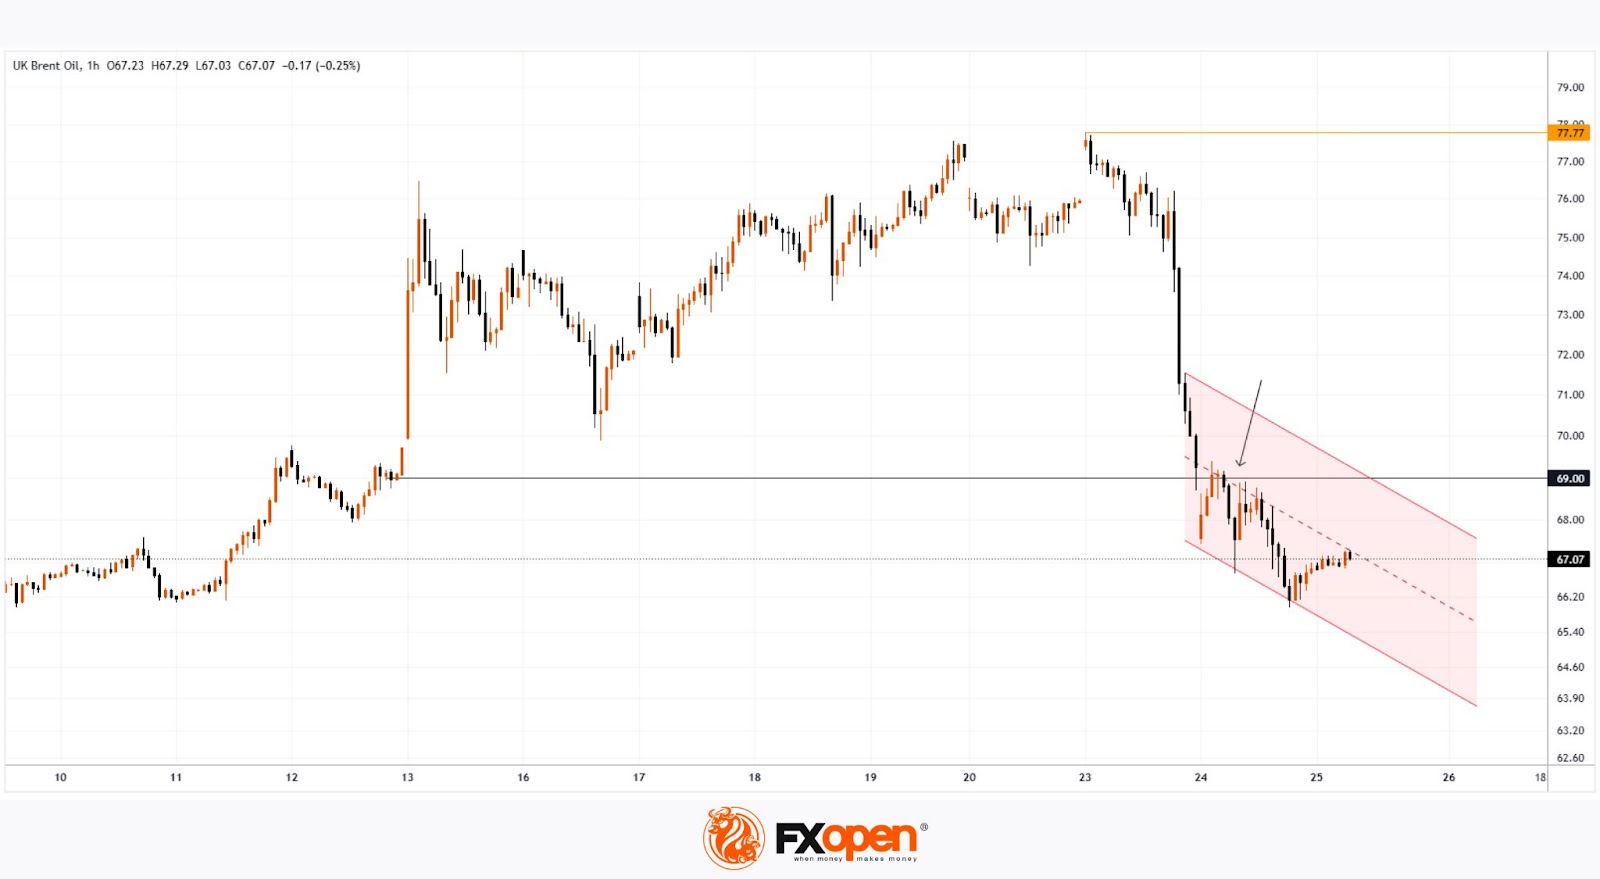
Interestingly, the $69 level — from which prices surged on 13 June — acted as resistance yesterday (as indicated by the arrow on the chart).
It can be assumed that the longer the ceasefire holds, the less relevant the fears that have served as bullish drivers. In that case, Brent crude prices may continue fluctuating within a downward channel, outlined in red, with the possibility of a short-term rise toward its upper boundary.
Nevertheless, the key drivers for oil prices will remain the fundamental backdrop and official statements regarding the situation in the Middle East and other geopolitical factors.
Start trading commodity CFDs with tight spreads. Open your trading account now or learn more about trading commodity CFDs with FXOpen.
This article represents the opinion of the Companies operating under the FXOpen brand only. It is not to be construed as an offer, solicitation, or recommendation with respect to products and services provided by the Companies operating under the FXOpen brand, nor is it to be considered financial advice.
GBP/JPY Daily Outlook
Daily Pivots: (S1) 196.90; (P) 197.32; (R1) 197.70; More...
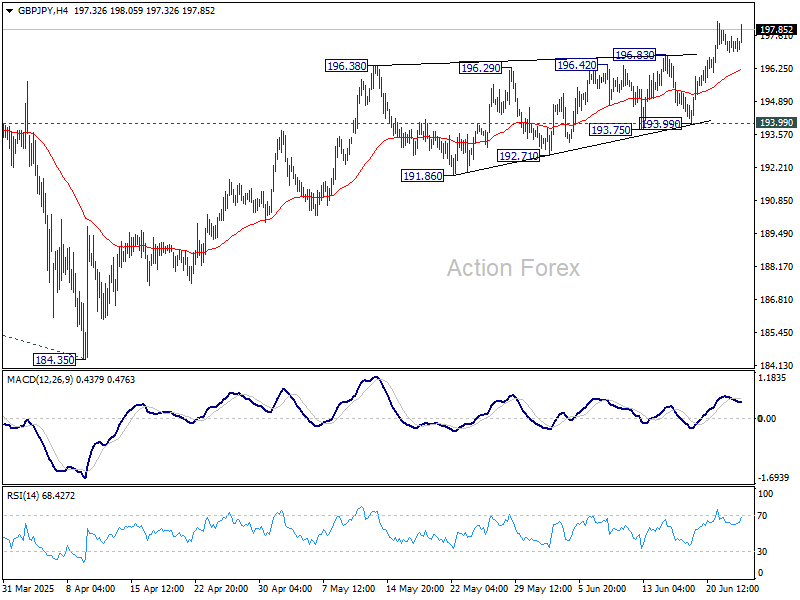
Intraday bias in GBP/JPY stays mildly on the upside at this point. Current rise from 184.35 should target 199.79 resistance. Break there will target 100% projection of 180.00 to 199.79 from 184.35 at 204.14. For now, near term outlook will stay bullish as long as 193.99 support holds, in case of retreat.
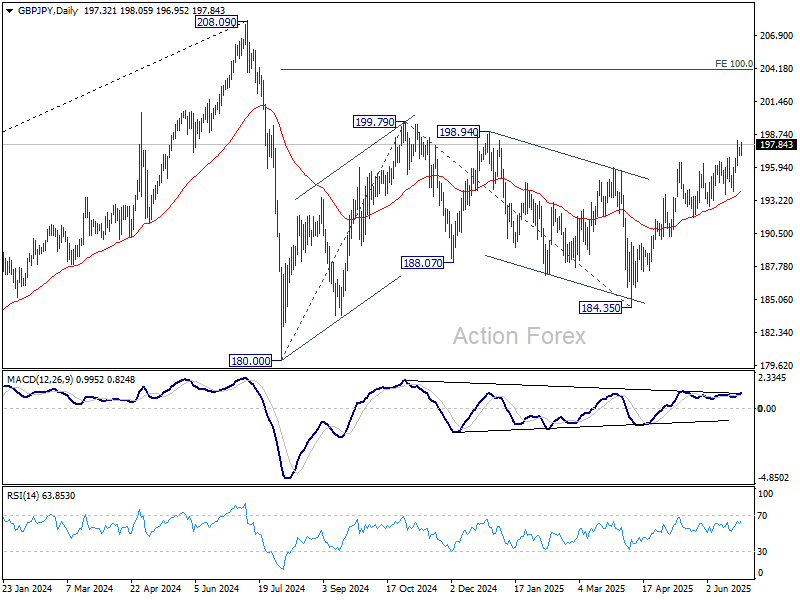
In the bigger picture, price actions from 208.09 are seen as a correction to rally from 123.94 (2020 low). Strong support should be seen from 38.2% retracement of 123.94 to 208.09 at 175.94 to contain downside. However, sustained break of 175.94 will bring deeper fall even still as a correction.
EUR/JPY Daily Outlook
Daily Pivots: (S1) 167.68; (P) 168.48; (R1) 169.06; More...
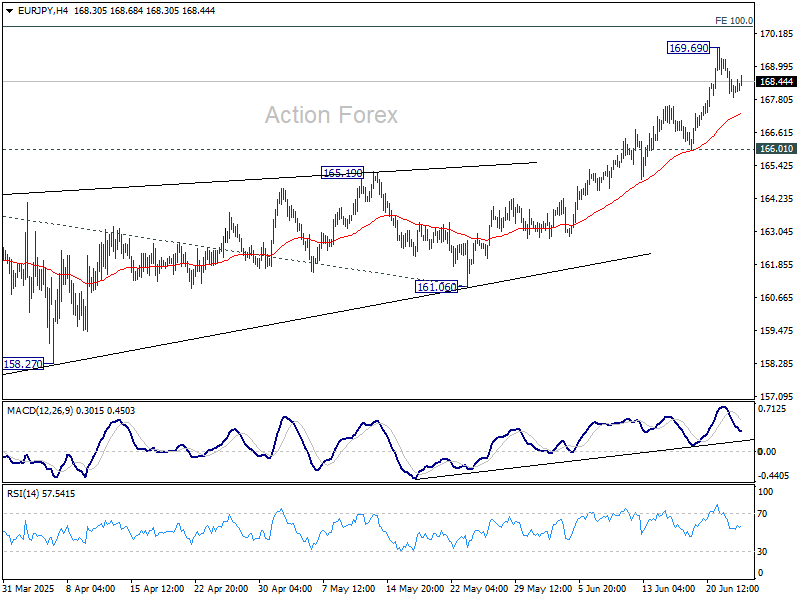
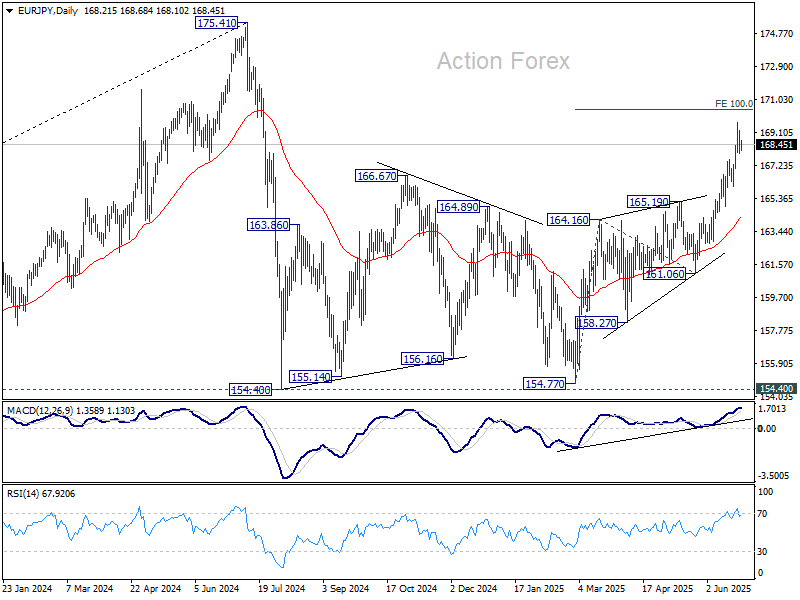
Intraday bias in EUR/JPY remains neutral and more consolidations could be seen below 169.69 temporary top. Further rally is expected as long as 166.01 support holds. Break of 169.69 temporary top will resume the rise from 154.77 and target 100% projection of 154.77 to 165.19 from 161.06 at 170.45.
In the bigger picture, price actions from 175.41 are seen as correction to up trend from 114.42 (2020 low). Strong support should be seen from 38.2% retracement of 114.42 to 175.41 at 152.11 to contain downside. However, sustained break of 152.11 will bring deeper fall even still as a correction.
EUR/AUD Daily Outlook
Daily Pivots: (S1) 1.7823; (P) 1.7878; (R1) 1.7943; More...
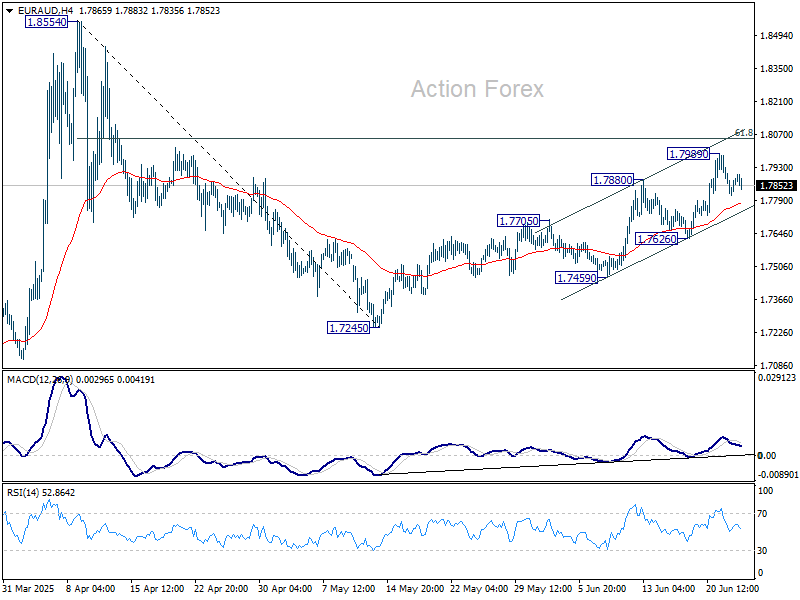
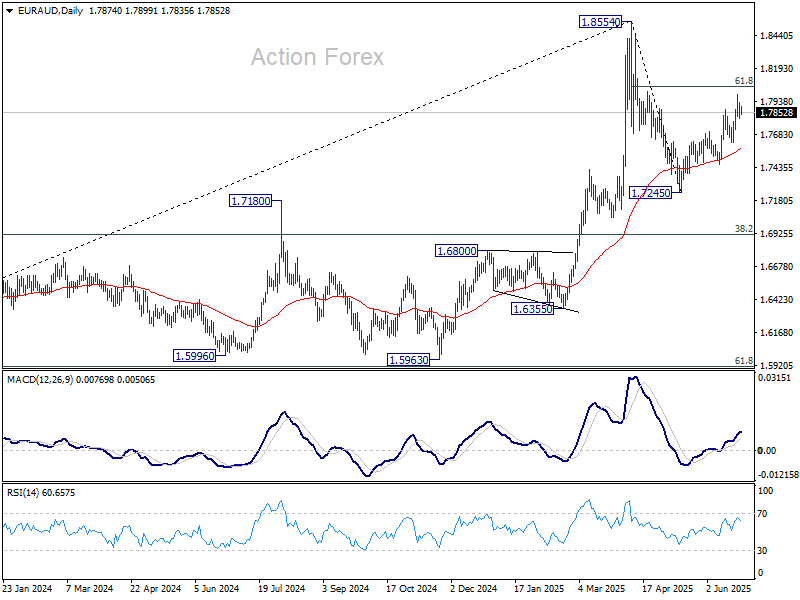
EUR/AUD is staying in consolidations below 1.7989 temporary top and intraday bias remains neutral. Further rise is expected as long as 1.7626 support holds. Above 1.7989 will target 61.8% retracement of 1.8554 to 1.7245 at 1.8054. Firm break there will pave the way to 1.8554.
In the bigger picture, price actions from 1.8554 medium term are currently seen as a corrective pattern. While deeper pullback might be seen, downside should be contained by 38.2% retracement of 1.4281 (2022 low) to 1.8554 at 1.6922 to bring rebound. Up trend from 1.4281 is expected to resume at a later stage.
EUR/CHF Daily Outlook
Daily Pivots: (S1) 0.9315; (P) 0.9372; (R1) 0.9404; More....
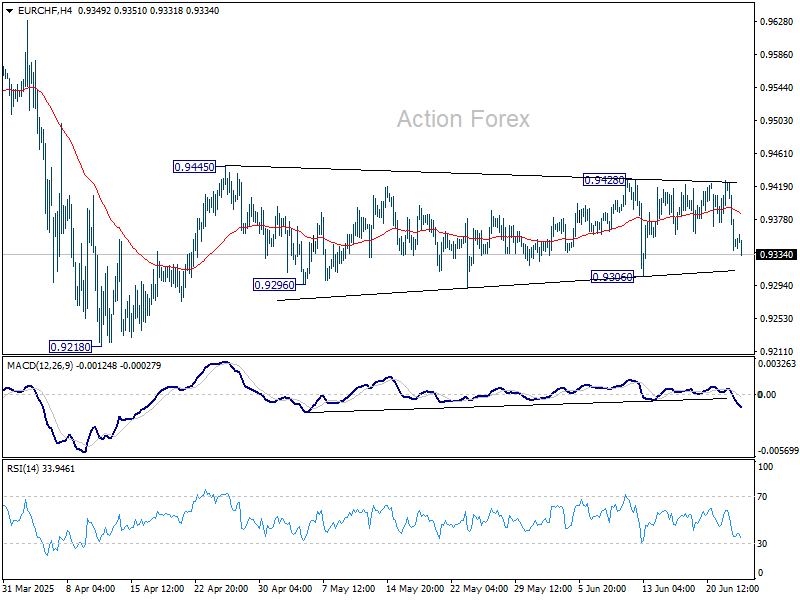
EUR/CHF fell steeply after rejection by 0.9248 resistance, but stays in established range. Intraday bias remains neutral first. On the upside, break of 0.9428/45 resistance zone will resume the rebound from 0.9218. However, break of 0.9306 will turn bias back to the downside for retesting 0.9218 low instead.
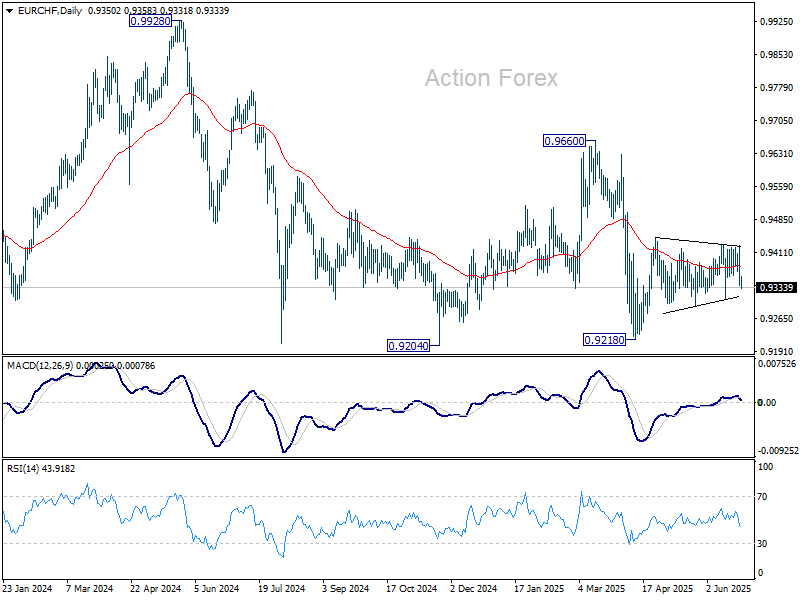
In the bigger picture, prior rejection by long-term falling channel resistance (now at 0.9511) retains medium term bearishness. That is, down trend from 1.2004 (2018 high) is still in progress. Firm break of 0.9204 (2024 low) will confirm resumption. This will remain the favored case as long as 0.9660 resistance holds.
AUD/USD Daily Report
Daily Pivots: (S1) 0.6453; (P) 0.6486; (R1) 0.6522; More...
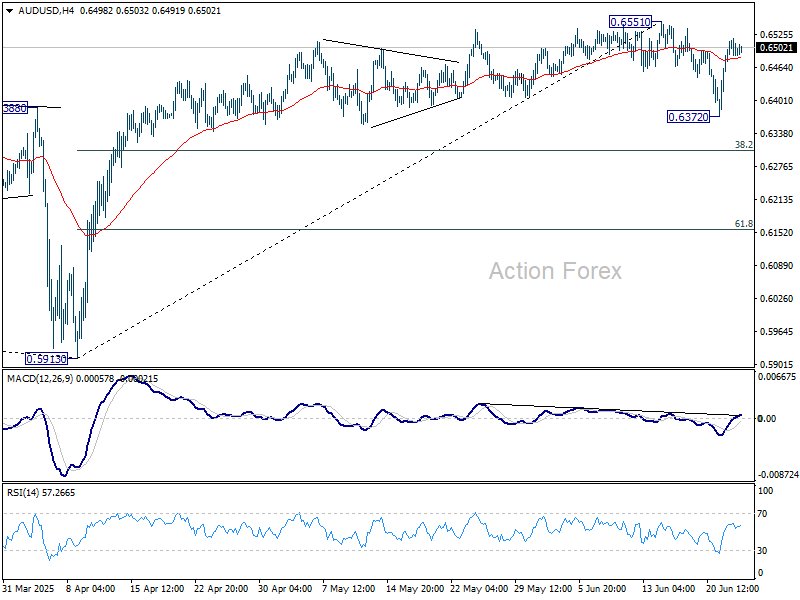
AUD/USD is staying in range below 0.6551 short term top and intraday bias remains neutral. Consolations could extend with another falling leg. But near term outlook will stay bullish as long as 38.2% retracement of 0.5913 to 0.6551 at 0.6307 holds. Firm break of 0.6551 will resume the rally from 0.5913.
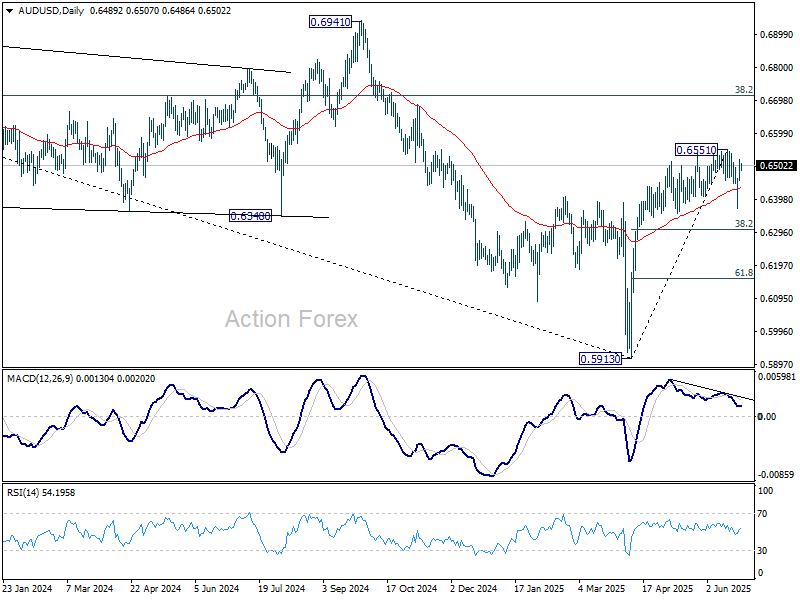
In the bigger picture, there is no clear sign that down trend from 0.8006 (2021 high) has completed. Rebound from 0.5913 is seen as a corrective move. While stronger rally cannot be ruled out, outlook will remain bearish as long as 38.2% retracement of 0.8006 to 0.5913 at 0.6713 holds. Nevertheless, considering bullish convergence condition in W MACD, even in case of another fall through 0.5913, downside should be contained above 0.5506 (2020 low).
Risk-on Continues, Fed Chair’s Dovish Hint Weakens the US Dollar Further, Gold Stabilizes
Geopolitical risk premium continued to unwind across global financial markets on Tuesday, as risk-on sentiment gained traction following signs that Israel and Iran are now respecting a ceasefire deal brokered late Monday by US President Trump, despite earlier breaches from both sides.
The de-escalation of the 12-day Israel-Iran conflict also drove a sharp bearish reversal in oil prices. WTI crude extended its losses from Monday, 14 June, registering a two-day decline of -15.3% to trade at US$66.05/barrel—effectively erasing the geopolitical premium and returning to pre-conflict levels.
Softer oil prices and Fed Powell’s dovish hint reinforced risk-on sentiment
The retreat in oil prices has helped ease stagflation concerns, providing a tailwind for global equities. With reduced inflationary pressures, central banks may now find more room to implement expansionary monetary policy if needed.
In his testimony before US Congress, Fed Chair Jerome Powell added to the dovish tone, stating, “If it turns out that inflation pressures do remain contained, then we will get to a place where we cut rates, sooner rather than later.” His comments echoed recent remarks by Fed Governors Waller and Bowman, who have hinted that rate cuts could begin as early as July, earlier than current expectations reflected in Fed funds futures, which price in a first cut at the September FOMC meeting (CME FedWatch tool).
Powell’s dovish comments reinforced the risk-on mood. Major US stock indices closed sharply higher, led by the high-beta Nasdaq 100, which surged 1.9% to retest its all-time intraday high of 22,222—despite a weaker-than-expected Conference Board Consumer Confidence print for May (actual: 93.0 vs consensus: 100.0, prior: 98.4).
The greenback drifted lower, with the US Dollar Index just a whisker away from a critical support level
The US dollar continued to weaken. The US Dollar Index recorded a second straight daily loss, falling -0.4% on Tuesday to close at 97.97 after rejecting its 50-day moving average. It now hovers just above a key long-term support at 97.40; a weekly close below this level could signal the start of a multi-month downtrend for the greenback.
In today’s Asian mid-session, the dollar remains under pressure. The high-beta New Zealand and Australian dollars are outperforming, up 0.3% and 0.1% respectively, followed by modest gains in the Swiss franc and euro.
Gold stabilizes at the 50-day moving average
Gold (XAU/USD) has started to stabilize after Tuesday’s 1.36% decline, which saw it close at US$3,323 following a breach of its 20-day moving average support at US$3,350. The yellow metal is currently up 0.3% intraday to US$3,333 after rebounding off its 50-day moving average at US$3,300, supported by a weaker US dollar and softer long-term Treasury yields.
Economic data releases
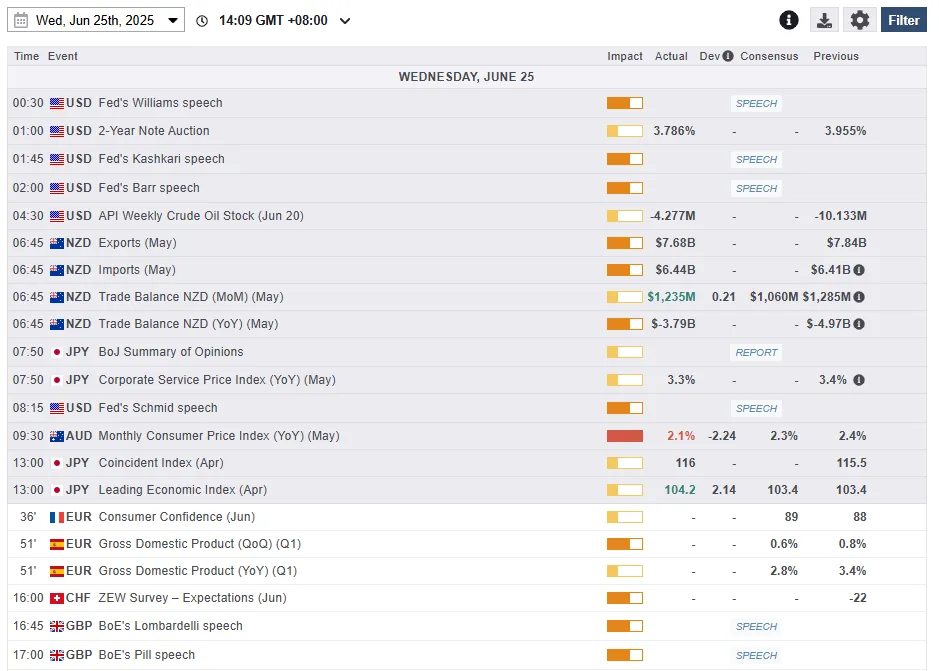
Fig 1: Key data for today’s Asia mid-session (Source: MarketPulse)
Chart of the day – Potential minor recovery for Gold (XAU/USD)
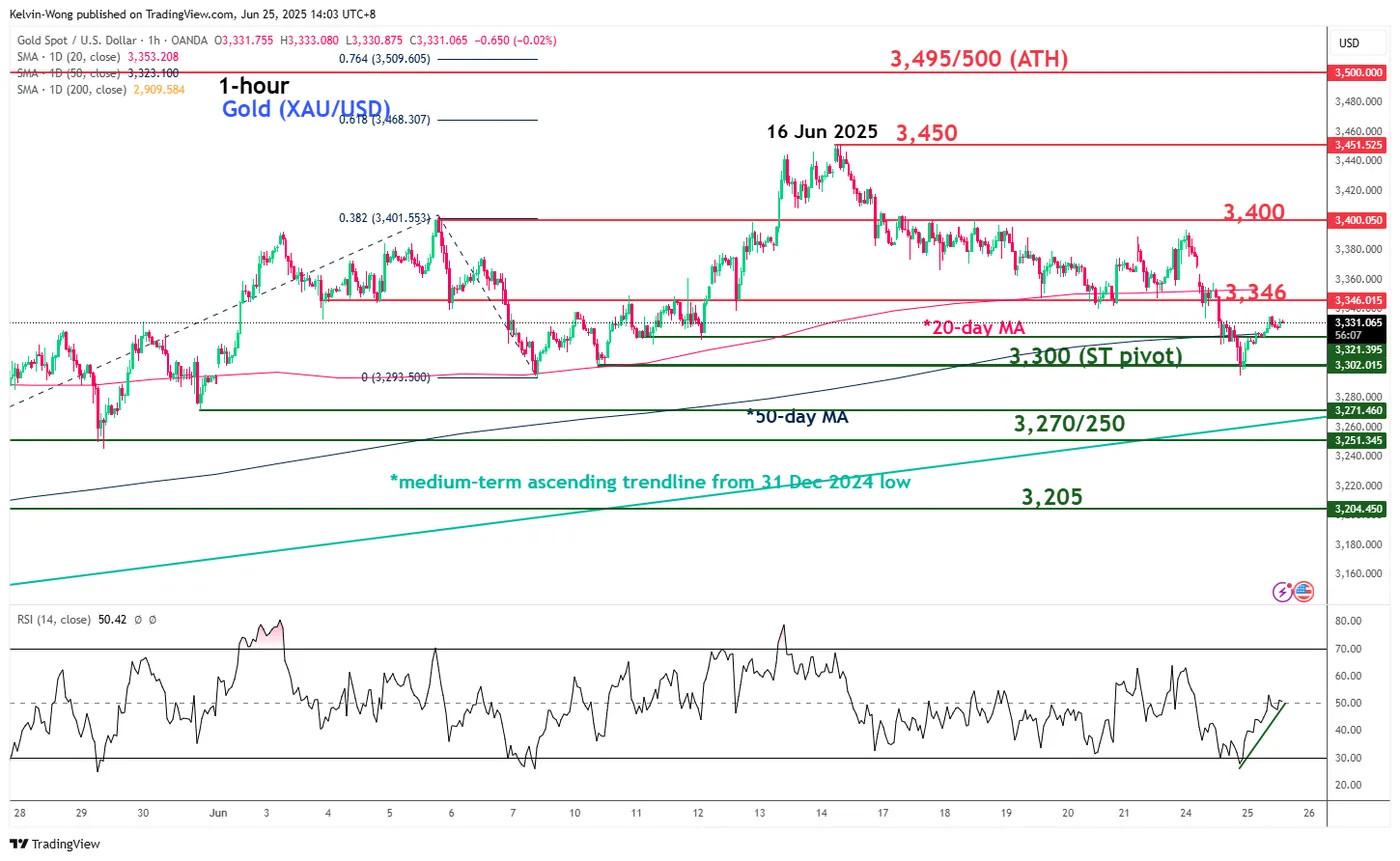
Fig 2: Gold (XAU/USD) minor trend as of 25 June 2025 (Source: TradingView)
The minor corrective decline of -4.5% seen in Gold (XAU/USD) from its 16 June 2025 high to Tuesday, 24 June 2025 low has stalled and reversed upwards from the 50-day moving average.
In addition, the hourly RSI momentum indicator has rebounded back above the 50 level after hitting its oversold region on Tuesday, which suggests a revival of bullish momentum at least in the short term.
Watch the US$3,300 key short-term pivotal support, and a clearance above the US$3,346 near-term resistance (also close to the 20-day moving average) sees the next intermediate resistances coming in at US$3,400 and US$3,450 (see Fig 2).
However, failure to hold at US$3,300 invalidates the recovery scenario to extend the corrective decline sequence towards the next intermediate support at US$3,270/3,250 (also the medium-term ascending trendline from 31 December 2024 low).