

Sample Category Title
US: Consumer Spending and Income Decline in May
Both consumer spending and income growth came in weaker than expected in May. Personal income decreased 0.4% month-over-month (m/m), well below the Bloomberg consensus of +0.3% m/m. Wages and salaries continued to grow at a solid pace, but transfer payments showed a sharp pullback, driven by a decrease in government Social Security payments due to the Social Security Fairness Act. Consumer spending was also soft, declining by 0.1% m/m. With income declining more than spending, personal savings rate fell to 4.5% (from 4.9% in April).
On an inflation-adjusted basis, spending declined by 0.3%. A sizeable drop in goods spending (-0.8% m/m) primarily drove this trend, as vehicle sales continued to cool in May following tariff-related frontloading in months prior. Services spending also softened, posting no growth in May.
Inflationary pressures picked up a bit, with core PCE – the Fed's preferred inflation gauge – rising by 0.2% m/m, up from the 0.1% pace seen over the previous two months. In annual terms, core PCE ticked up to 2.7% pace – from 2.6% the prior month.
Key Implications
Consumer spending was weak in May, as tariff front-loading eased, and services spending continued to cool. This broad-based slowdown has pushed our tracking of Q2 consumer spending growth to 1.3% (annualized), down from our earlier 1.7% projection.
Looking ahead, we expect consumer spending to remain weak in the third quarter as consumers tighten their purse strings amid some expected cooling in the labor market and lingering economic uncertainty. Prices on consumer goods are also expected to move higher through the summer as companies draw down on existing inventory stockpiles and higher input costs begin to squeeze profit margins.
USD/CHF Mid-Day Outlook
Daily Pivots: (S1) 0.7970; (P) 0.8012; (R1) 0.8044; More….
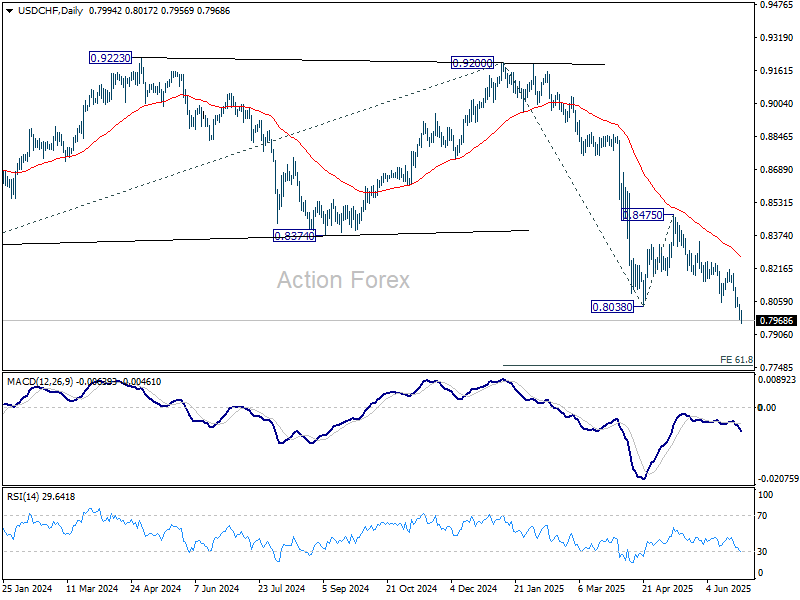
USD/CHF's decline is in progress and intraday bias stays on the downside. Current down trend should target 61.8% projection of 0.9200 to 0.8038 from 0.8475 at 0.7757 next. On the upside, above 0.8017 minor resistance will turn intraday bias neutral and bring consolidations. But recovery should be limited below 0.8214 resistance to bring another fall.
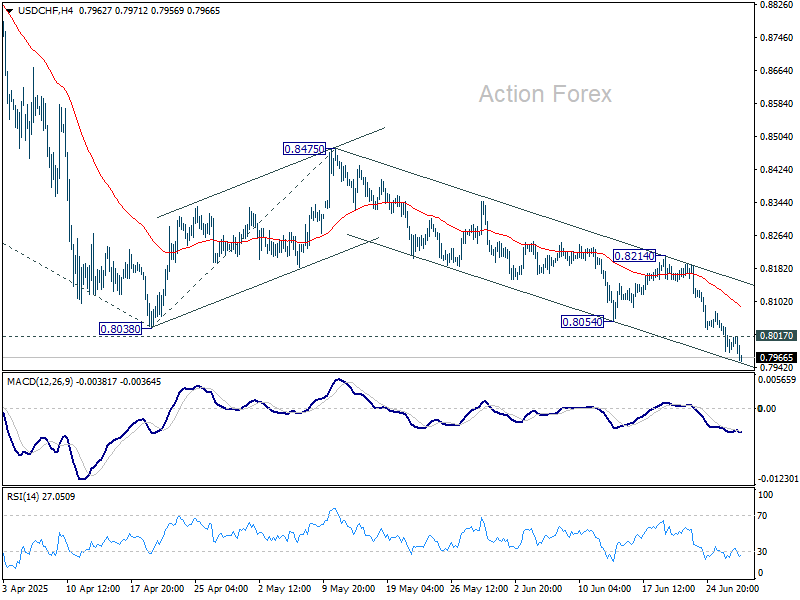
In the bigger picture, long term down trend from 1.0342 (2017 high) is still in progress. Next target is 100% projection of 1.0146 (2022 high) to 0.8332 from 0.9200 at 0.7382. In any case, outlook will stay bearish as long as 0.8475 resistance holds.
Dollar Stays Weak as Traders Weigh Hawkish PCE and Dovish Spending Signals
Dollar enters the US session mixed, as markets digest a batch of data offering signals to both sides of the policy debate. The greenback is seeing additional selling against Euro and Swiss Franc, but recovering modestly against commodity-linked currencies.
Core PCE inflation rose faster than expected in May, providing Fed hawks with further justification for holding off on rate cuts in the near term. But disappointing personal income and spending data, both of which declined on the month, bolster the case for rate reductions later in the year, particularly after tariff uncertainty resolves. With US futures holding firm, markets appear more inclined to focus on the soft demand data as a rationale for easier policy ahead.
On the trade front, China’s Ministry of Commerce confirmed a new framework agreement with the US aimed at easing tensions over tech restrictions and rare earth exports. The framework outlines mutual concessions: China will expedite export approvals under its control regime, while the US is set to roll back a swath of existing curbs. The announcement aligns with comments from US President Donald Trump on Thursday referencing a recently signed deal with Beijing, later clarified by White House officials as an implementation mechanism for the Geneva agreement.
Looking across currencies, Dollar still ranks at the bottom for the week, just ahead of the Canadian Dollar, which failed to gain traction after April and May GDP prints both surprised on the downside. Yen also underperforms, weighed by a sharper-than-expected drop in Tokyo’s inflation. Meanwhile, Swiss Franc tops the leaderboard, with Euro and Sterling also buoyant. Aussie and Kiwi are sitting in the middle of the pack, underperforming relative to the risk-on rally in equities this week.
In Europe, at the time of writing FTSE is up 0.48%. DAX is up 0.72%. CAC is up 1.30%. UK 10-year yield is up 4.483 at 0.006. Germany 10-year yield is up 0.01 at 2.580. Earlier in Asia, Nikkei rose 1.43%. Hong Kong HSI fell -0.17%. China Shanghai SSE fell -0.70%. Singapore Strait Times rose 0.70%. Japan 10-year JGB yield rose 0.012 to 1.436.
US Core PCE surprises to upside at 2.7% in May, but income and spending disappoint
US core PCE inflation accelerated to 2.7% yoy in May, above expectations of 2.6% yoy and up from an upwardly revised 2.6% yoy in April. The Headline PCE index also edged higher from 2.2% yoy to 2.3% yoy as expected. While the inflation print highlights persistent price pressures—particularly in core categories—consumption data painted a weaker picture.
Personal income unexpectedly dropped -0.4% mom, a steep miss versus forecasts for a 0.2% gain. Personal spending fell -0.1% mom against an expected 0.2% mom increase. The fall in spending was driven by a notable USD 49.2B pullback in goods purchases, only partially offset by a USD 19.9B rise in services spending.
Canada’s GDP contracts -0.1% mom in April, early data points to May decline
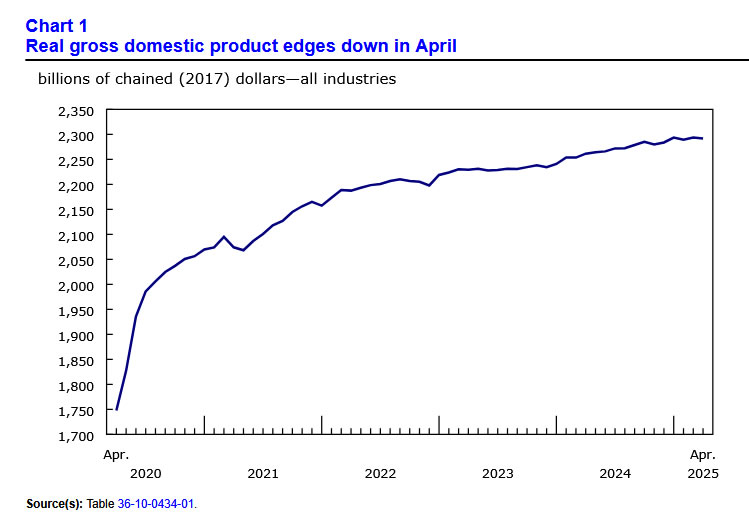
Canada’s GDP shrank by -0.1% mom in April, missing expectations of a flat print. Weakness was concentrated in goods-producing sectors, which fell -0.6% mom. Services sector offered a mild offset with a 0.1% mom gain. Just 10 of 20 industrial sectors posted growth, suggesting a broad-based soft patch.
Looking ahead, preliminary data indicates another -0.1% mom decline in real GDP for May. Mining, oil and gas extraction, public administration, and retail trade all weighed on activity, with only real estate and rental leasing providing a meaningful offset.
Eurozone economic sentiment falls to 94 in June as industry weakens
June’s economic data from the European Commission showed further erosion in business sentiment, with Economic Sentiment Indicator falling to 94.0 in both the EU and the Eurozone.
France (-3.4) posted the sharpest decline in sentiment among major EU members, followed by Spain (-1.4) and Germany (-0.8), while Poland (+1.0) saw a slight rebound.
The decline was led by deteriorating industry confidence, with retail also contributing. Confidence in services and among consumers held firm, while construction recovered.
Employment expectations, however, remained stable, with the EEI unchanged in the EU (97.5) and marginally higher in the Eurozone (97.1).
Tokyo core inflation slows to 3.1% in June, but food costs still surging
Tokyo’s core CPI (ex-fresh food) slowed more than expected in June, coming in at 3.1% yoy versus 3.6% yoy in May and below forecasts of 3.4% yoy. The decline was largely driven by the resumption of fuel subsidies and temporary reductions in utility charges. Core-core CPI, which strips out both fresh food and energy, also eased to 3.1% yoy from 3.3% yoy.
However, the figure masks ongoing strain on household budgets. Food prices (excluding volatile items) rose a sharp 7.2% yoy, accelerating from May's 6.9% yoy. Tokyo consumers paid nearly 90% more for rice and faced eye-watering increases in chocolate and coffee costs. Service prices edged down slightly but remained elevated at 2.1%.
On the labor side, Japan's May jobless rate held steady at 2.5%, while the job-to-applicant ratio slipped slightly to 1.24.
USD/CHF Mid-Day Outlook
Daily Pivots: (S1) 0.7970; (P) 0.8012; (R1) 0.8044; More….
USD/CHF's decline is in progress and intraday bias stays on the downside. Current down trend should target 61.8% projection of 0.9200 to 0.8038 from 0.8475 at 0.7757 next. On the upside, above 0.8017 minor resistance will turn intraday bias neutral and bring consolidations. But recovery should be limited below 0.8214 resistance to bring another fall.
In the bigger picture, long term down trend from 1.0342 (2017 high) is still in progress. Next target is 100% projection of 1.0146 (2022 high) to 0.8332 from 0.9200 at 0.7382. In any case, outlook will stay bearish as long as 0.8475 resistance holds.
Canada’s GDP contracts -0.1% mom in April, early data points to May decline
Canada’s GDP shrank by -0.1% mom in April, missing expectations of a flat print. Weakness was concentrated in goods-producing sectors, which fell -0.6% mom. Services sector offered a mild offset with a 0.1% mom gain. Just 10 of 20 industrial sectors posted growth, suggesting a broad-based soft patch.
Looking ahead, preliminary data indicates another -0.1% mom decline in real GDP for May. Mining, oil and gas extraction, public administration, and retail trade all weighed on activity, with only real estate and rental leasing providing a meaningful offset.
US Core PCE surprises to upside at 2.7% in May, but income and spending disappoint
US core PCE inflation accelerated to 2.7% yoy in May, above expectations of 2.6% yoy and up from an upwardly revised 2.6% yoy in April. The Headline PCE index also edged higher from 2.2% yoy to 2.3% yoy as expected. While the inflation print highlights persistent price pressures—particularly in core categories—consumption data painted a weaker picture.
Personal income unexpectedly dropped -0.4% mom, a steep miss versus forecasts for a 0.2% gain. Personal spending fell -0.1% mom against an expected 0.2% mom increase. The fall in spending was driven by a notable USD 49.2B pullback in goods purchases, only partially offset by a USD 19.9B rise in services spending.

Gold Once Again Approaches a Cliff Edge
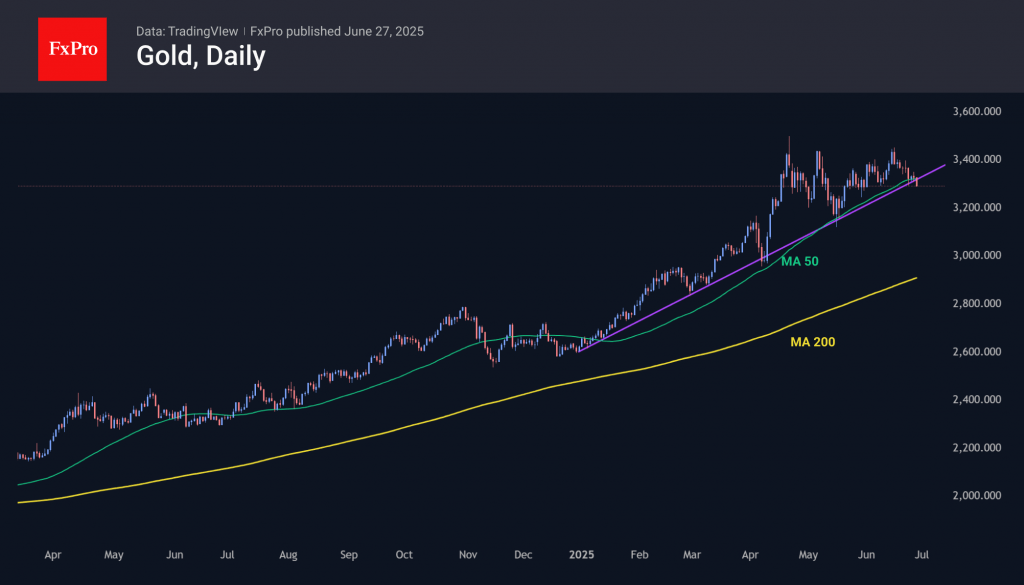
The Israel and Iran ceasefire has reduced demand for gold as a safe-haven asset. The precious metal failed to break out of the medium-term consolidation range of $3,100 to $3,400 per troy ounce and resume its upward trend. This signals weakness among bulls and allows Citigroup to predict a fall in prices below $3,000 in 2026. According to the bank, thanks to Donald Trump’s ‘big and beautiful’ tax bill, the acceleration of the US economy will push gold prices down. The decrease in geopolitical risks will also contribute to gold’s decline.
Goldman Sachs, on the other hand, maintains its forecast for the precious metal to rise to $4,000. It cites the insatiable appetite of central banks, the weakening dollar, and the fall in US Treasury bond yields. Indeed, the White House is keen on lower debt market rates and a weaker currency. A recent survey by the World Gold Council shows that 43% of central banks plan to increase their bullion purchases over the next 12 months, up from just 29% a year ago.
The recent de-escalation has once again tested gold’s support at its uptrend, marked by the 50-day moving average. On Friday, sellers pushed the price below this level, which passes through $3324, and are even attempting to stabilise below $3300. In May, a sharp movement managed to push the price back above this line. However, this metric is now turning downward, reflecting over two months of consolidation after reaching recent highs.
All signs indicate a potential repeat of the consolidation seen in November-December last year, which laid the groundwork for the subsequent rally. However, there is also a high probability that the failure to break through the $3500 level over the past two months signals a global trend reversal. We await whether this will mirror 2020, with a 20% correction in the next six months and a two-year sideways movement or resemble the nearly halving in gold prices from 2011 to 2015.
Nikkei 225 Index Rises Above 40,000 Points
As the chart shows, the Nikkei 225 stock index (Japan 225 on FXOpen) has risen above the psychological level of 40,000 points — for the first time in five months.
Bullish drivers include:
→ Reduced geopolitical risks. A ceasefire between Iran and Israel has boosted market sentiment, with stock indices rising both on Wall Street (yesterday the Nasdaq 100 hit a new all-time high) and in Japan.
→ Easing fears of a prolonged trade war. White House Press Secretary Karoline Leavitt noted that the timeline for implementing tariffs is flexible and could be extended.
→ Economic news. Recent data shows that inflation in Japan has slowed for the first time in four months: the core consumer price index fell to 3.1% from 3.6% in May.
Technical Analysis of the Nikkei 225 Chart
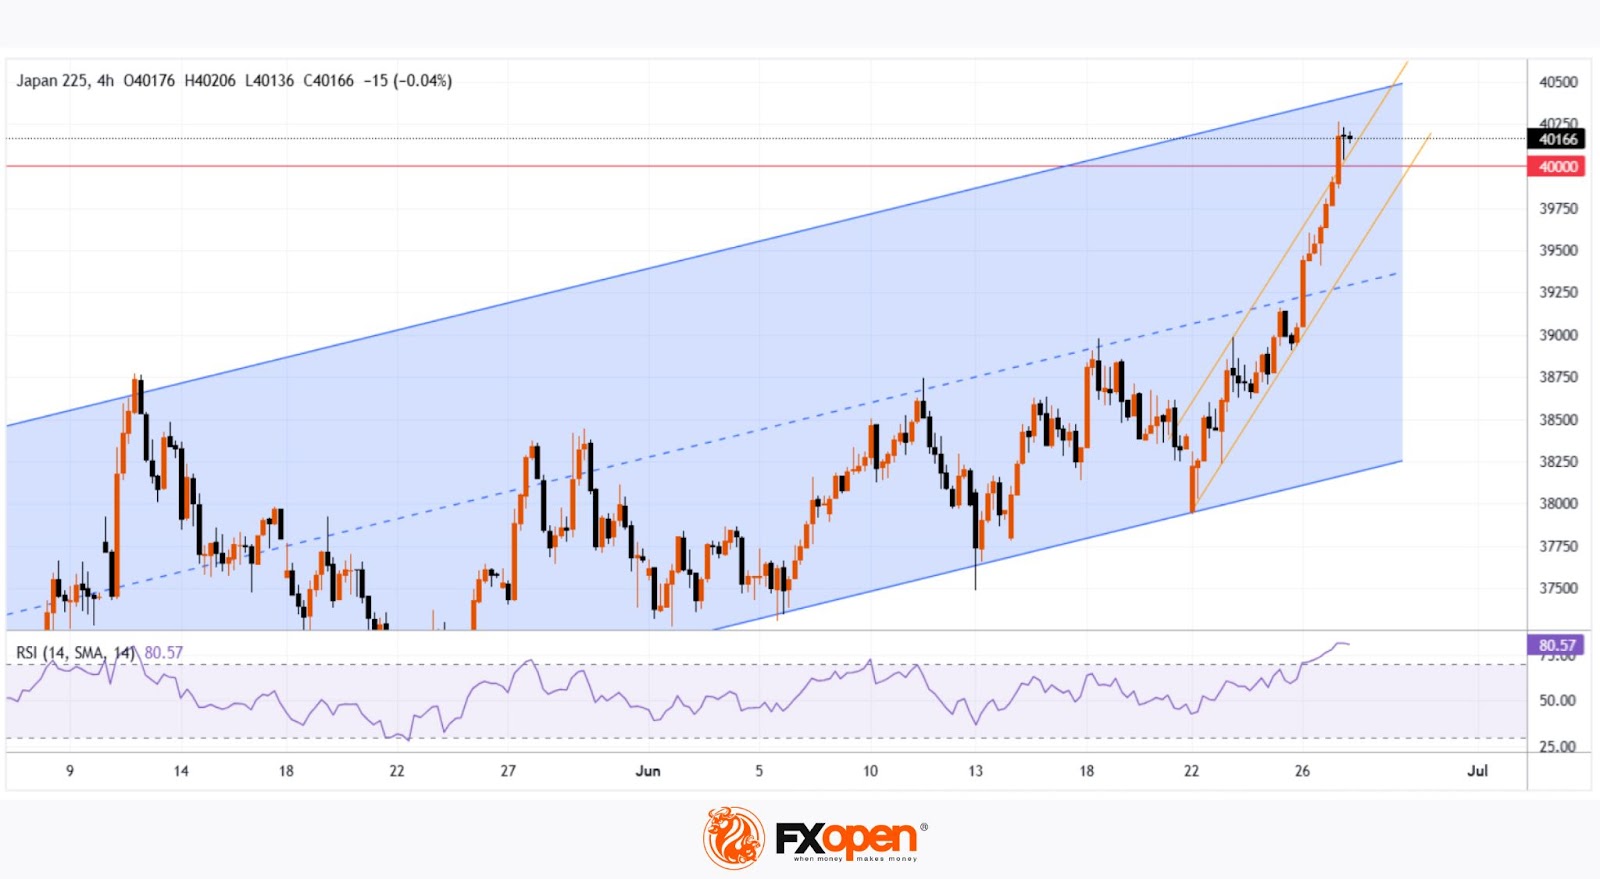
Price movements are forming an upward channel (highlighted in blue), but the market appears vulnerable to a pullback, as suggested by:
→ proximity to the upper boundary of the channel;
→ overbought conditions indicated by the RSI.
If a pullback develops, it will provide yet another example of how the price failed to hold above the psychological level of 40,000 — something we've seen repeatedly since October 2024, and we've been pointing out this pattern for quite some time.
Therefore, we might witness another false breakout above the 40K level on the Nikkei 225 (Japan 225 on FXOpen), followed by a retreat deeper into the blue channel — potentially towards its median line.
Trade global index CFDs with zero commission and tight spreads. Open your FXOpen account now or learn more about trading index CFDs with FXOpen.
This article represents the opinion of the Companies operating under the FXOpen brand only. It is not to be construed as an offer, solicitation, or recommendation with respect to products and services provided by the Companies operating under the FXOpen brand, nor is it to be considered financial advice.
Eurozone economic sentiment falls to 94 in June as industry weakens
June’s economic data from the European Commission showed further erosion in business sentiment, with Economic Sentiment Indicator falling to 94.0 in both the EU and the Eurozone.
France (-3.4) posted the sharpest decline in sentiment among major EU members, followed by Spain (-1.4) and Germany (-0.8), while Poland (+1.0) saw a slight rebound.
The decline was led by deteriorating industry confidence, with retail also contributing. Confidence in services and among consumers held firm, while construction recovered.
Employment expectations, however, remained stable, with the EEI unchanged in the EU (97.5) and marginally higher in the Eurozone (97.1).

EUR/USD Pair Hits Yearly High
Yesterday, the EUR/USD exchange rate rose above the 1.1700 level for the first time this year. The last time one euro was worth more than 1.70 US dollars was in autumn 2019.
The main driver behind the euro’s rise is the weakening dollar, largely due to decisions made by the Trump administration. This week alone, the EUR/USD pair has gained more than 2%, partly as a result of escalating tensions between the US President and the Chair of the Federal Reserve.
According to Reuters, Trump called Powell “terrible” and said he had three or four candidates in mind for the top job at the Fed. It was also reported that Trump had considered selecting and announcing a replacement for Powell by September or October (his current term officially runs until May 2026).
Technical Analysis of the EUR/USD Chart
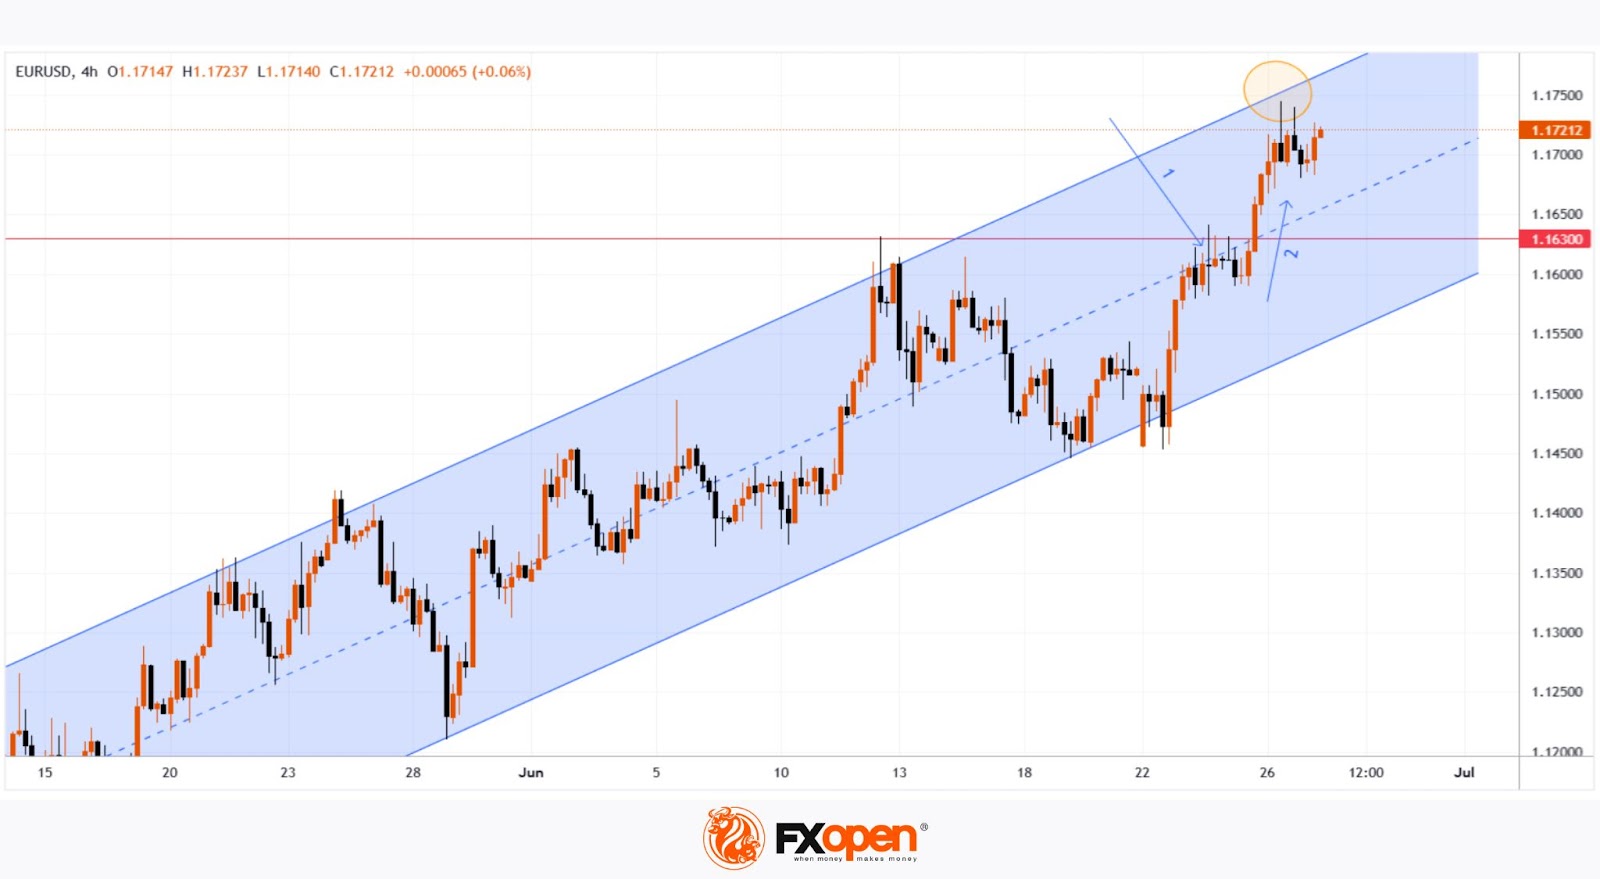
Price movements are forming an upward channel (highlighted in blue), with the following observations:
→ Midweek, the price consolidated around the channel’s median line (as indicated by arrow 1);
→ It then broke through the 1.6300 level with strong bullish momentum (shown by arrow 2), a level that had acted as resistance earlier in the month;
→ The long upper wicks on the candles forming yesterday’s highs (circled) suggest increased selling pressure near the upper boundary of the channel.
Given this, we could assume that in the short term, the price might form a new consolidation zone around the median line above the 1.6300 level. Significant fundamental catalysts would be required to break the developing upward trend.
Trade over 50 forex markets 24 hours a day with FXOpen. Take advantage of low commissions, deep liquidity, and spreads from 0.0 pips. Open your FXOpen account now or learn more about trading forex with FXOpen.
This article represents the opinion of the Companies operating under the FXOpen brand only. It is not to be construed as an offer, solicitation, or recommendation with respect to products and services provided by the Companies operating under the FXOpen brand, nor is it to be considered financial advice.
Gold Prices Decline as Risk Appetite Grows, Reducing Safe-Haven Demand
Gold has fallen to $3,296 per troy ounce, despite a weaker US dollar, as investors remain focused on the potential easing of Federal Reserve (Fed) policy.
Market expectations suggest that Donald Trump could announce his nominee for Fed chair as early as September or October, with the likely candidate favouring a more accommodative monetary stance.
Jerome Powell, the current Fed chair, has indicated that the absence of new trade duties is helping to curb inflation, potentially paving the way for multiple rate cuts, provided no aggressive tariffs are introduced after 9 July.
Recent Statdata revisions showed the US economy contracted by 0.5% in Q1 (final estimate), reinforcing expectations of a rate cut. However, this weak performance was partially offset by a drop in jobless claims, which fell to a five-week low, alongside an 11-year high in durable goods orders.
Investors are now awaiting the release of the PCE index, the Fed’s preferred inflation gauge.
Further pressure on gold stems from easing geopolitical tensions in the Middle East, reducing demand for safe-haven assets. Over the past five trading sessions, gold has remained on track for a second consecutive weekly decline.
Technical Analysis: XAU/USD
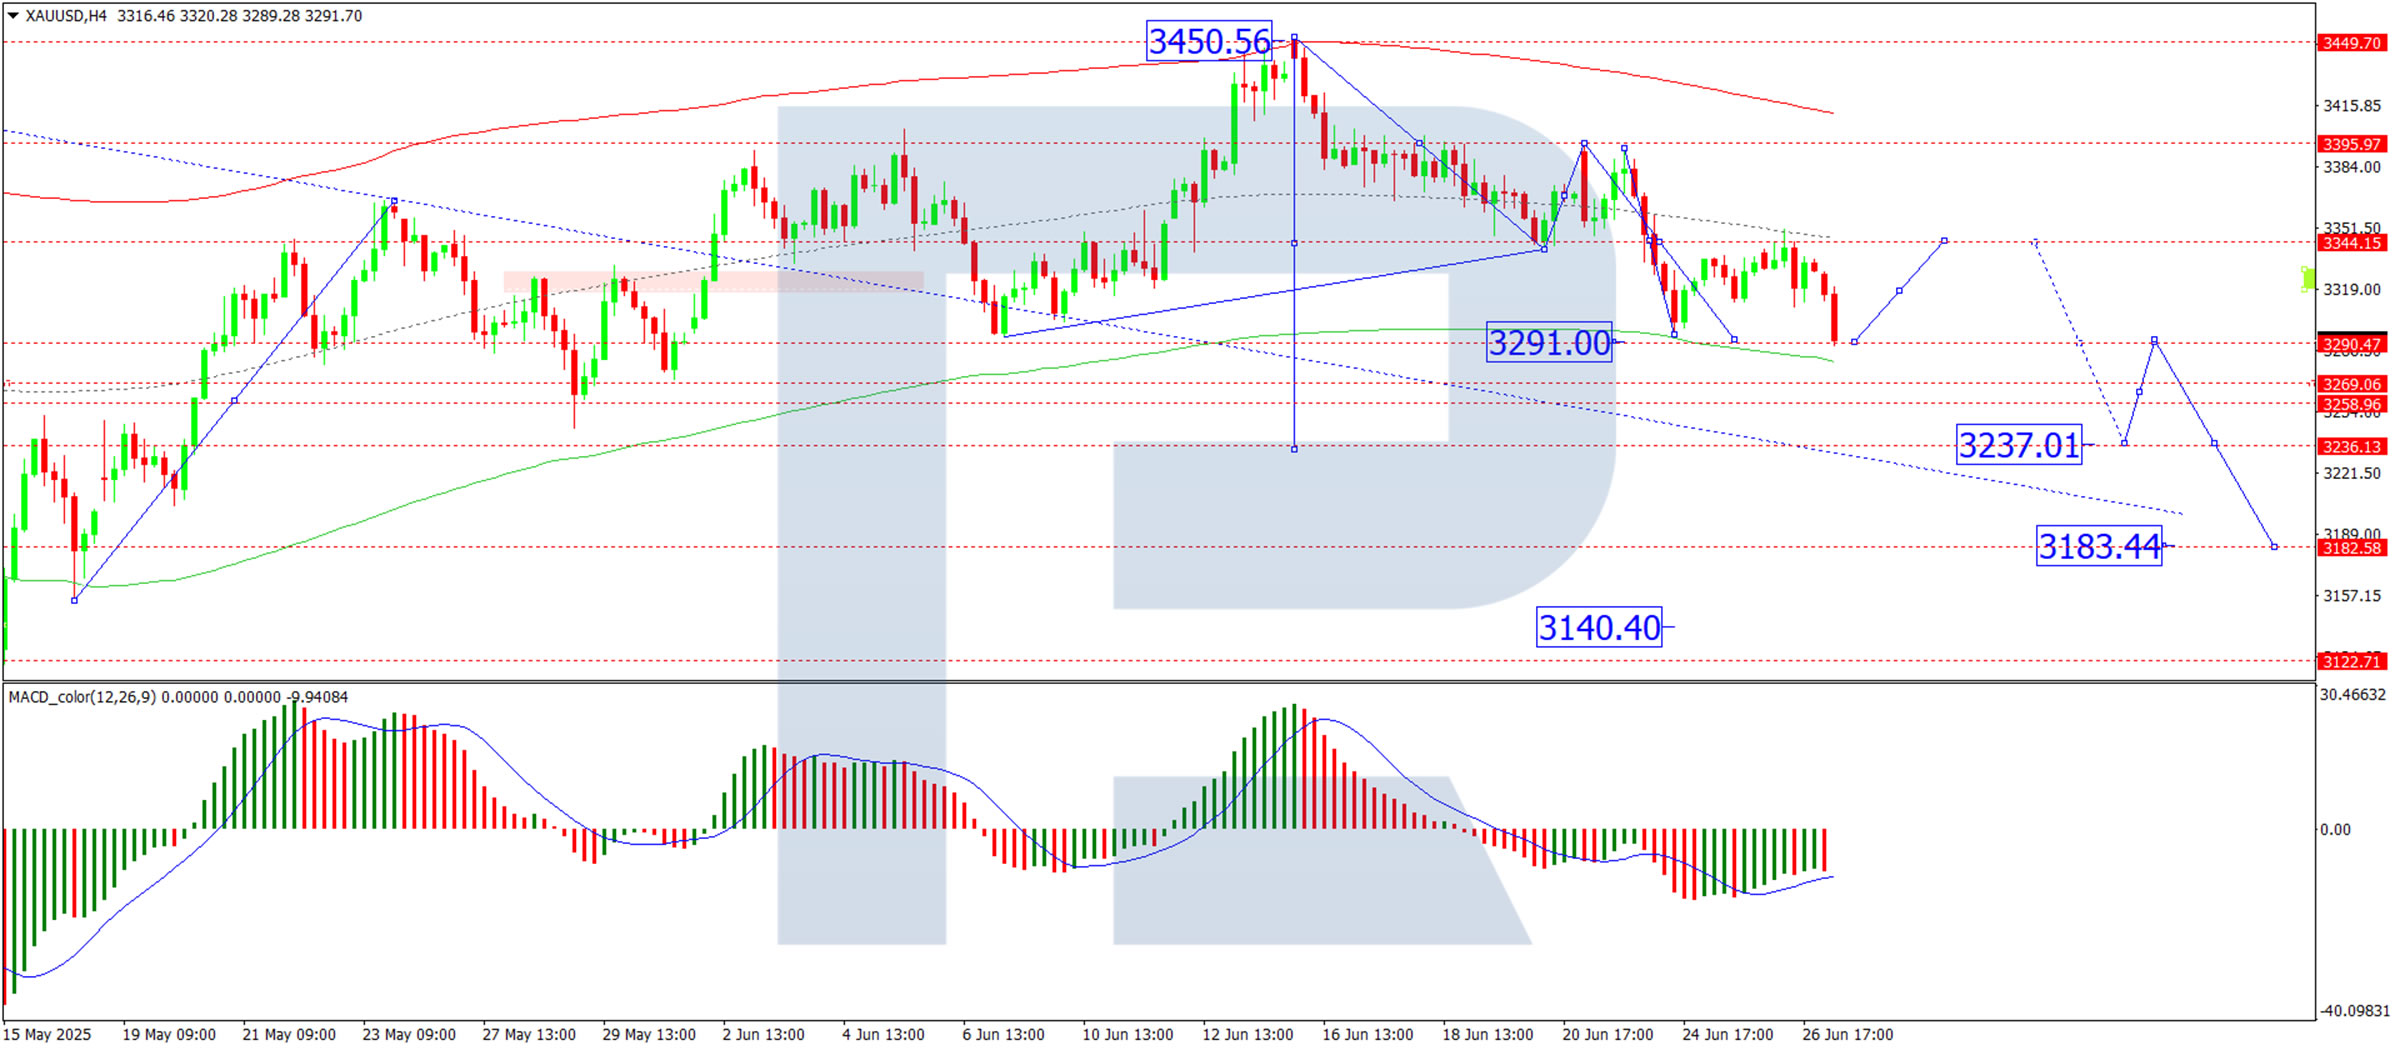
H4 Chart:
The market remains within a broad consolidation range around $3,344. Today’s downward extension reached $3,291, with the potential for a corrective rebound to retest $3,344 (from below) before a possible decline towards $3,237. This scenario is supported by the MACD indicator, with its signal line below zero but turning upward.
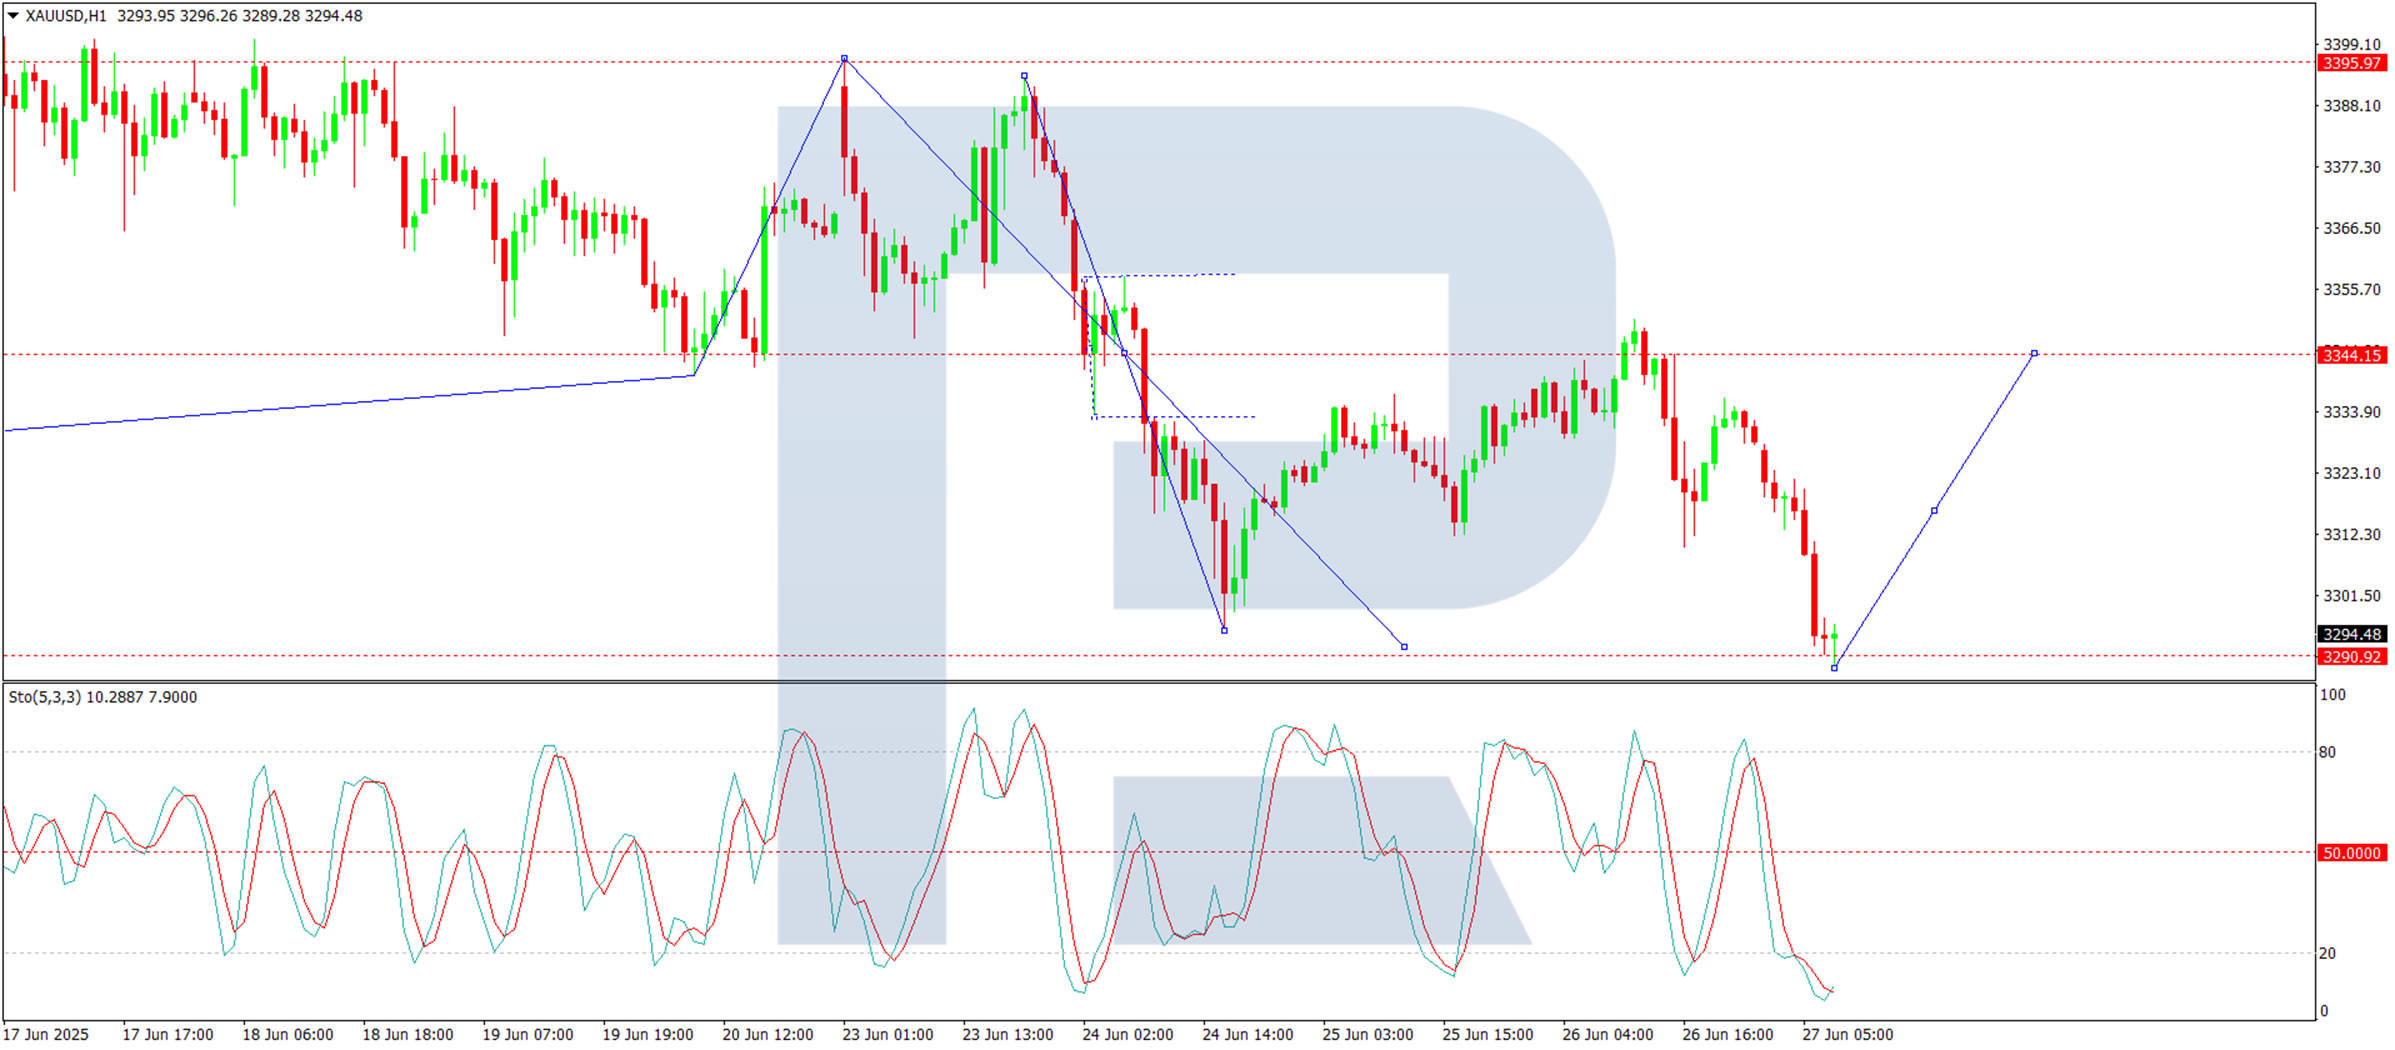
H1 Chart:
A downward wave structure has formed, reaching $3,290. A corrective upward move towards $3,344 is anticipated today, maintaining the consolidation range. A breakout below this range could open further downside potential, targeting at least $3,237. The Stochastic oscillator corroborates this outlook, with its signal line below 20 and rising sharply towards 80.
Conclusion
Gold remains under pressure amid shifting Fed expectations and reduced geopolitical risks, with technical indicators suggesting further volatility ahead.