Sample Category Title
Cracks in Gold Rally? Not Just Yet
- Gold loses ground but remains supported near key pivot point.
- Technical signals deteriorate, sideways pattern intact above 3,150.
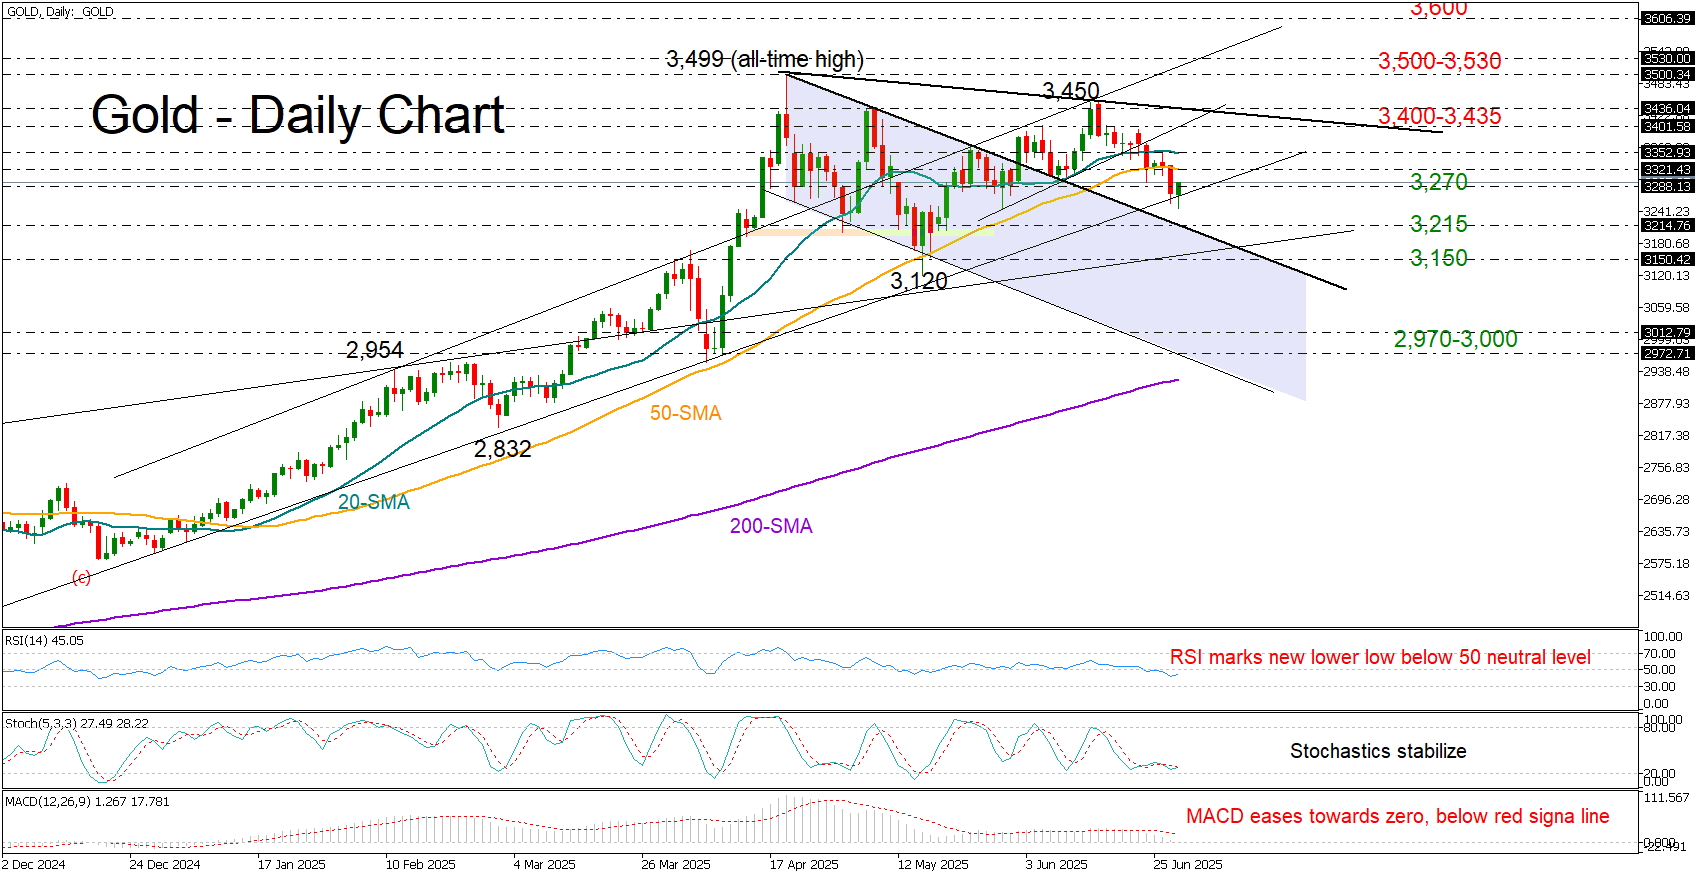
Gold extended its short-term decline below its 20- and 50-day simple moving averages (SMAs) after Federal Reserve Chair Jerome Powell questioned the case for a July rate cut during his semi-annual testimony before Congress last week. Additionally, recent U.S. data backed this narrative, revealing signs of rising inflationary pressures and a pullback in jobless claims.
Nevertheless, the support trendline drawn from December 2024 continues to act as a safety net around the 3,270 zone. This comes as the July 9 tariffs deadline approaches, with sticking points between the U.S. and its trade partners persisting – suggesting that agreements may take longer to finalize, or that quick solutions could leave key issues unresolved.
Technically, the risk remains tilted to the downside in the short-term picture given the weakening momentum in the RSI and MACD indicators. The RSI is printing new lower lows below its neutral 50 mark. If bearish pressure intensifies in the coming sessions, the price could retest the upper band of the former bearish channel at 3,215, followed by the rising support line from October 2024 at 3,150. A drop below that level could accelerate losses toward the psychological 3,000 mark, or even lower to 2,970.
On the upside, if strong catalysts push the precious metal back above its 20- and 50-day SMAs (currently at 3,320–3,350), the next challenge may pop up within the 3,400-3,435 area. A decisive close above that border could pave the way to 3,500, or test resistance near 3,530, before potentially targeting the 3,600 level.
In summary, gold has not completely lost its potential for a bullish reversal, despite the weakening technical indicators. Downside pressures may still encourage a "buy the dip" strategy, as long as the price holds within its sideways structure above 3,150.
S&P 500 Sets New All-Time High, Surges Above 6200
The S&P 500 index (US SPX 500 mini on FXOpen) started the week by reaching a fresh all-time high. As shown on the chart, the index hit 6,210 points earlier this morning.
In addition to a reduced risk of US involvement in a large-scale war in the Middle East, market optimism has been fuelled by:
→ Tariff-related news. Last week, the US President announced the signing of a trade deal with China, while Treasury Secretary Scott Bessent expressed hope that the US would conclude trade negotiations with over a dozen countries by early September.
→ Strong corporate performance. On Friday, Nike (NKE) shares led the stock market, rising by more than 15% following an earnings report that exceeded analysts’ expectations. This could be boosting investor sentiment ahead of the upcoming earnings season.
Technical Analysis of the S&P 500 Chart
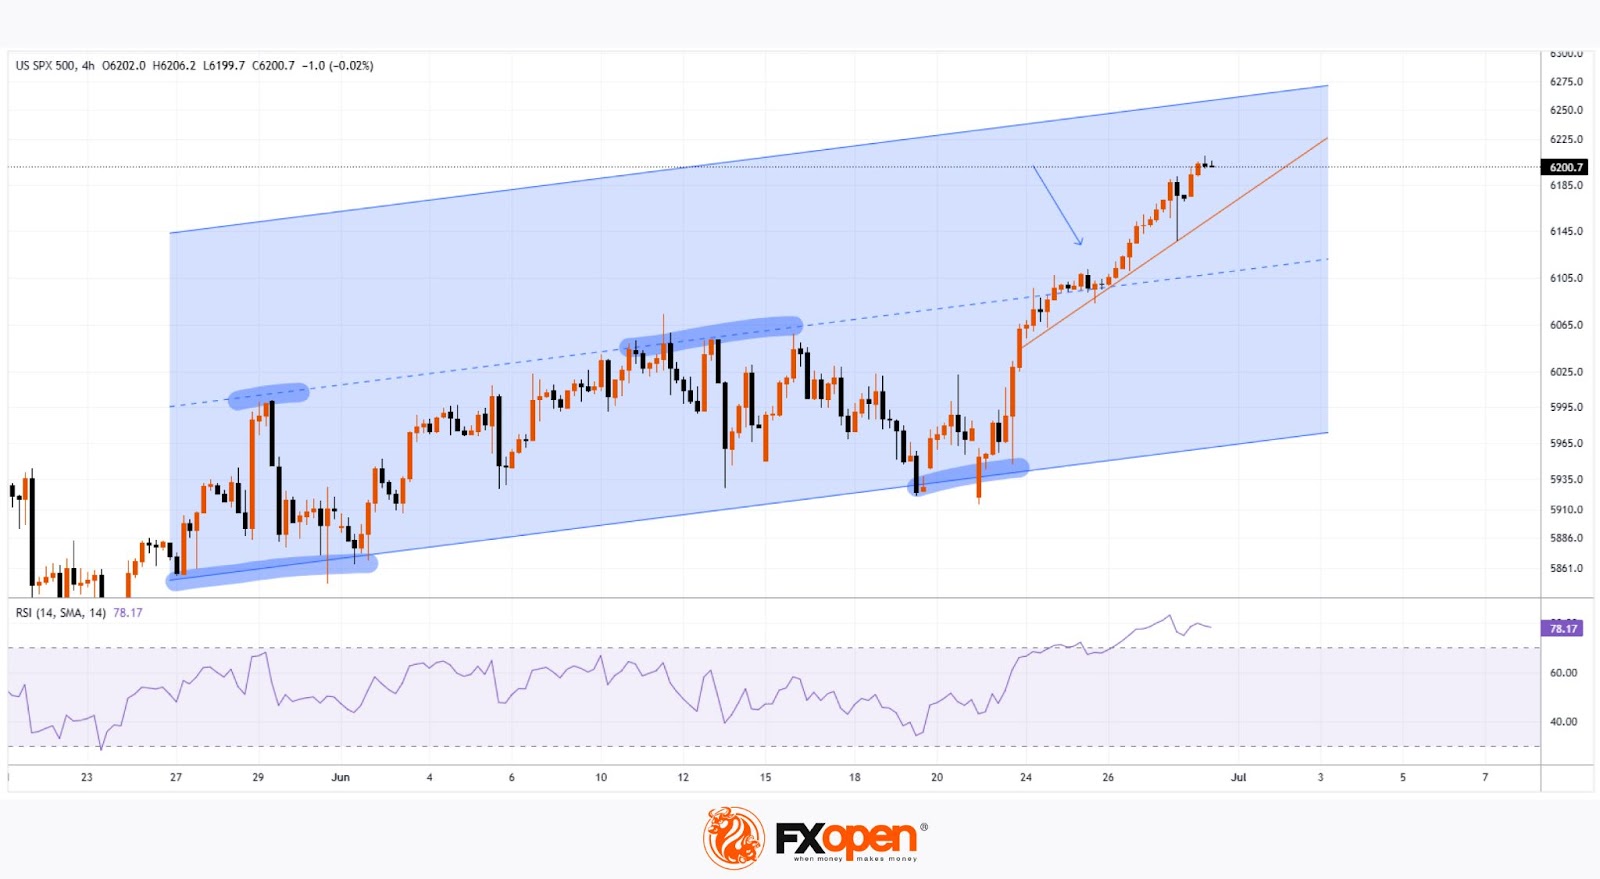
Evaluating the 4-hour chart of the S&P 500 index (US SPX 500 mini on FXOpen) in the context of June’s price movements reveals key reference points (marked on the chart) that outline an ascending channel. A consolidation zone, marked with an arrow, highlights a temporary equilibrium between supply and demand—after which buyers gained the upper hand, pushing the price upward.
It is possible that the ongoing bullish momentum could carry the price toward the upper boundary of the channel. However, attention should be paid to the RSI indicator, which suggests the market is heavily overbought; in fact, Friday’s reading marked the highest level of the year. In such conditions, a price correction cannot be ruled out—potentially back toward the local ascending trendline (shown in orange).
Trade global index CFDs with zero commission and tight spreads. Open your FXOpen account now or learn more about trading index CFDs with FXOpen.
This article represents the opinion of the Companies operating under the FXOpen brand only. It is not to be construed as an offer, solicitation, or recommendation with respect to products and services provided by the Companies operating under the FXOpen brand, nor is it to be considered financial advice.
XAU/USD Chart Analysis: Price Retreats to Monthly Low
In mid-June 2025, demand for gold surged following reports of exchanged strikes between Israel and Iran, along with US bombings of Iran's nuclear facilities. As a so-called safe-haven asset, gold prices climbed towards $3,430.
However, by the final day of June, the XAU/USD chart shows that gold had retreated to around $3,250, marking the lowest level in a month.
Why Is the Gold Price Falling?
On one hand, this reflects easing tensions in the Middle East, as a ceasefire—albeit fragile—between Israel and Iran remains in place.
On the other hand, the risk of trade wars is also diminishing. According to media reports:
→ President Donald Trump announced last week that the United States had signed a trade agreement with China and hinted that a “very major” deal with India would follow soon.
→ The US is also close to concluding agreements with Mexico and Vietnam, while negotiations with Japan and many other countries are ongoing.
Technical Analysis of the XAU/USD Chart
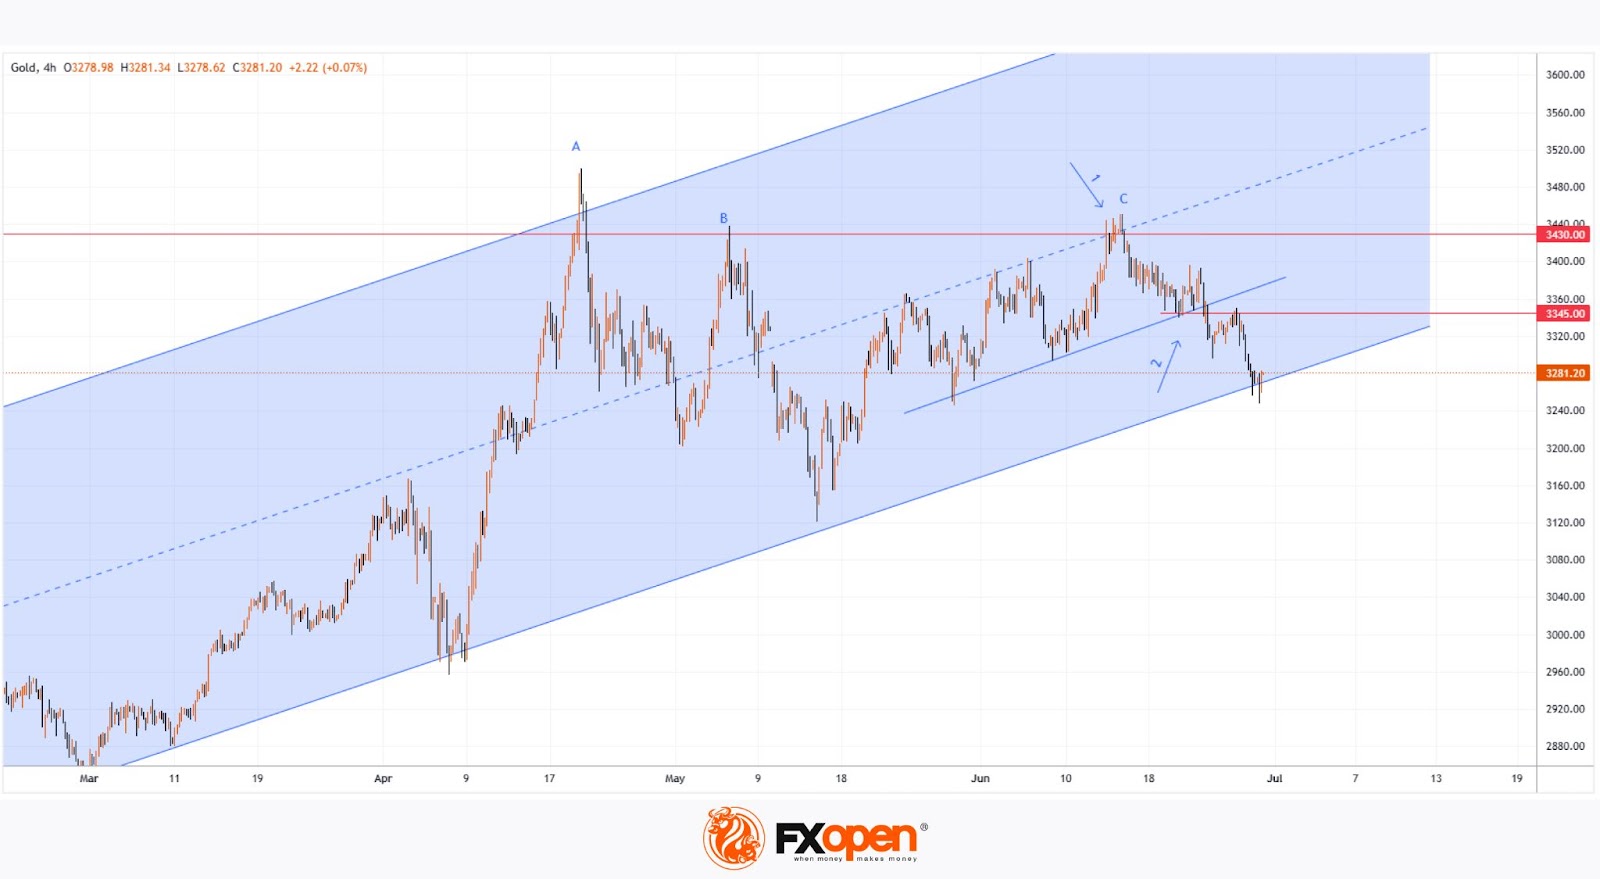
Looking at the broader picture, it is worth noting that gold prices in 2025 continue to move within a long-term upward channel (shown in blue), with the following key observations:
→ The channel’s median line acted as resistance (indicated by arrow 1);
→ The line dividing the lower half of the channel in half also showed signs of resistance (indicated by arrow 2).
Now, gold is trading near the lower boundary of the channel – a key support level within the multi-month uptrend. Demand may begin to strengthen here, with long lower wicks on candles on the lower timeframes supporting this view.
A rebound from the lower boundary is possible in early July, but how strong might it be? Note that bears have taken control of the $3,345 level (which has now flipped from support to resistance), and there are signs of a triple top pattern (A-B-C) forming near the $3,430 resistance. This raises the risk of a bearish breakout from the ascending channel.
Start trading commodity CFDs with tight spreads. Open your trading account now or learn more about trading commodity CFDs with FXOpen.
This article represents the opinion of the Companies operating under the FXOpen brand only. It is not to be construed as an offer, solicitation, or recommendation with respect to products and services provided by the Companies operating under the FXOpen brand, nor is it to be considered financial advice.
Gold Declines as Risk Appetite Improves
The price of gold fell to 3,280 USD per troy ounce on Monday, approaching its monthly low. The decline reflects reduced demand for safe-haven assets as geopolitical tensions ease and optimism grows over international trade developments.
Geopolitical tensions ease, trade optimism rises
In the Middle East, a fragile yet stable ceasefire between Israel and Iran remains in place, alleviating fears of a fresh escalation in regional conflict.
Meanwhile, trade sentiment improved after US President Donald Trump announced the conclusion of a trade agreement with China last week, alongside an upcoming major deal with India. Reports also indicate that Washington is nearing agreements with Mexico and Vietnam while negotiations continue with Japan and other countries. These developments have eased concerns about a deterioration in global trade relations, further dampening gold’s appeal.
Focus shifts to US economic data
Investor attention is now turning towards US macroeconomic indicators scheduled for release this week, including:
- Job vacancies data
- ADP employment report
- Non-farm payrolls index
These releases will offer insight into the Federal Reserve’s future monetary policy decisions.
Technical analysis of XAU/USD
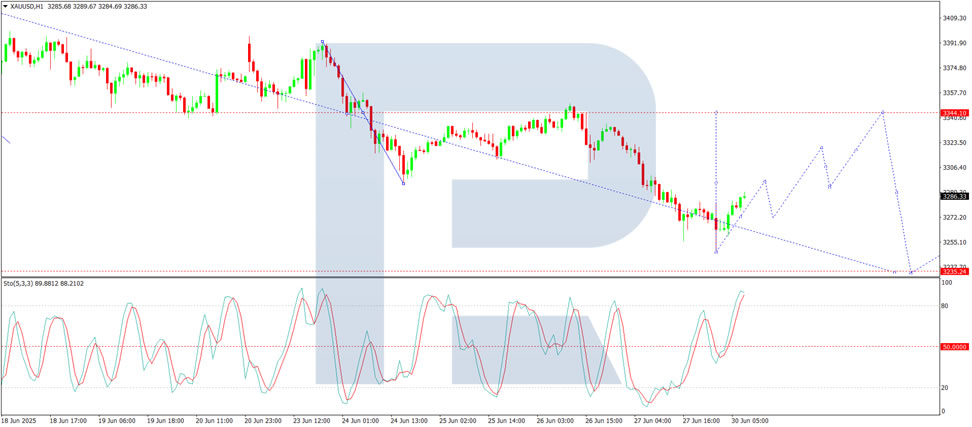
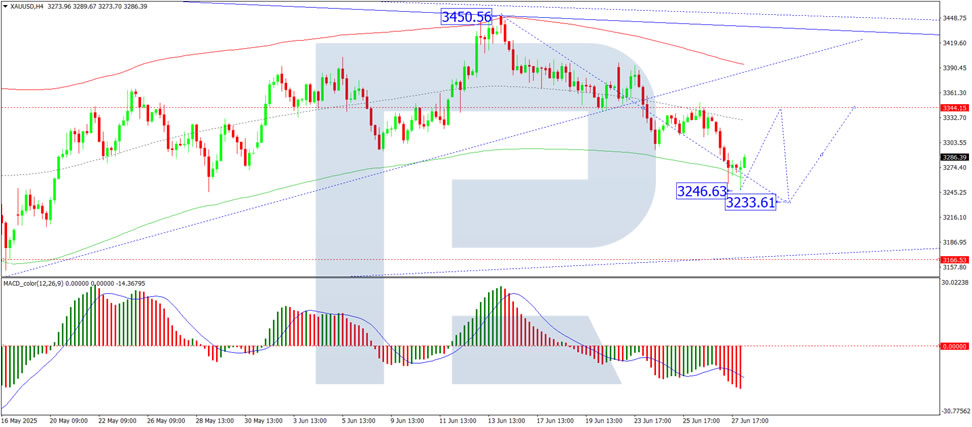
On the H1 chart, gold has begun a correction towards 3,297 USD. A subsequent drop to 3,270 USD cannot be ruled out. The market is forming a consolidation range around 3,270 USD. Should an upward breakout occur from this range, the correction could extend to 3,319 USD, with the upward wave potentially continuing towards 3,344 USD (testing from below). The Stochastic oscillator confirms this outlook, with its signal line above 50 and moving sharply towards 80, indicating short-term upward momentum within the correction phase.
Conclusion
Gold remains under pressure as geopolitical risks recede and trade optimism rises, diminishing its safe-haven appeal. Technical indicators suggest a likely correction towards 3,344 USD before further downside towards 3,233 USD. In the short term, market sentiment will remain tied to upcoming US employment data and its implications for the Fed’s policy trajectory.
GBP/JPY Daily Outlook
Daily Pivots: (S1) 198.02; (P) 198.42; (R1) 198.85; More...
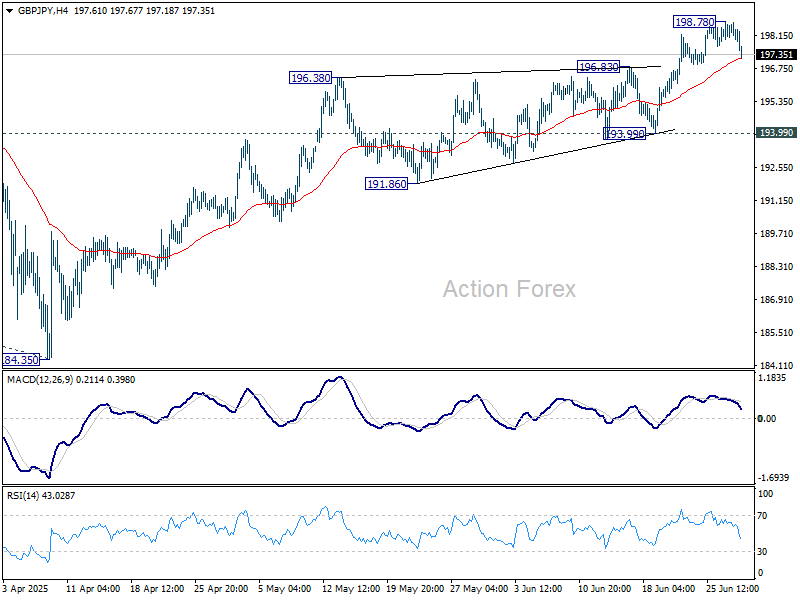
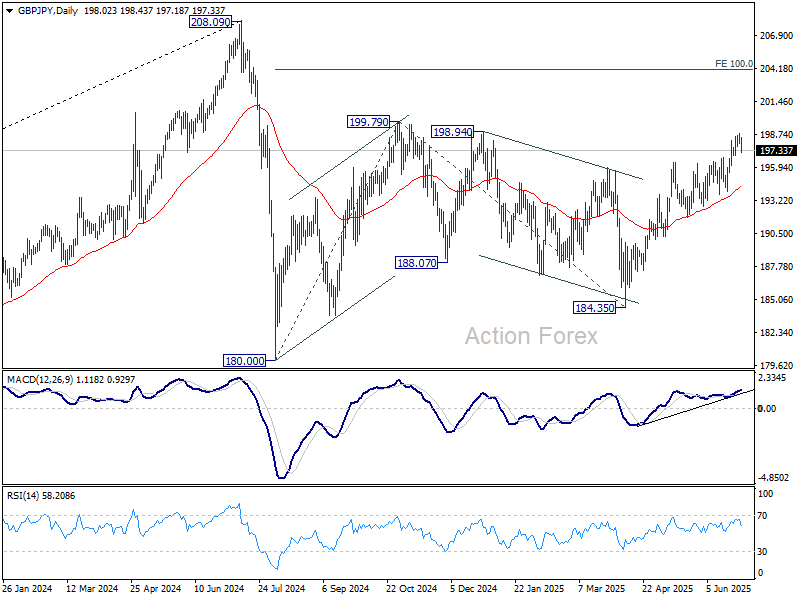
Intraday bias in GBP/JPY is turned neutral with current retreat and some more consolidations would be seen first. Near term outlook will stay bullish as long as 193.99 support holds. Above 198.78 will resume the rise from 184.35 to 199.79 resistance. Break there will target 100% projection of 180.00 to 199.79 from 184.35 at 204.14.
In the bigger picture, price actions from 208.09 are seen as a correction to rally from 123.94 (2020 low). Strong support should be seen from 38.2% retracement of 123.94 to 208.09 at 175.94 to contain downside. However, sustained break of 175.94 will bring deeper fall even still as a correction.
EUR/JPY Daily Outlook
Daily Pivots: (S1) 168.84; (P) 169.32; (R1) 170.02; More...
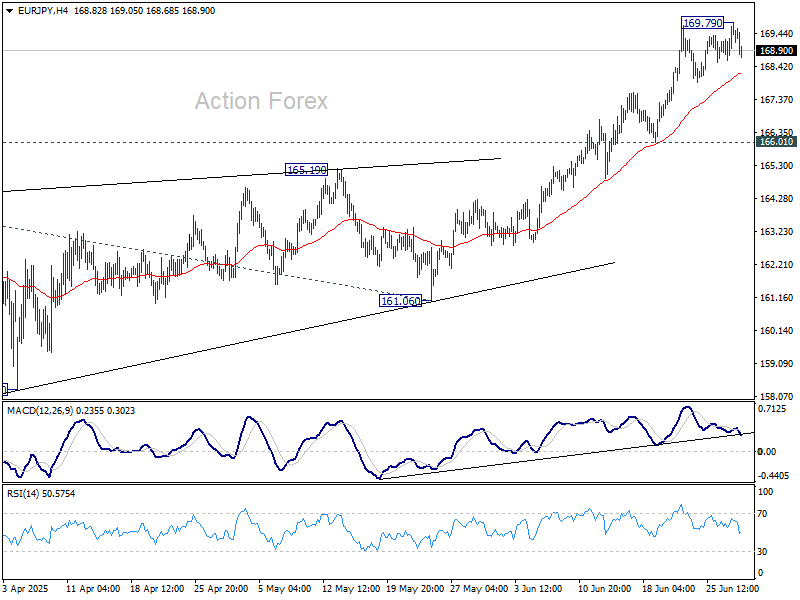
Intraday bias in EUR/JPY is turned neutral again with current retreat and some consolidations would be seen first. Downside should be contained well above 166.01 support to bring another rally. Above 169.79 will resume the rise from 154.77 to 100% projection of 154.77 to 164.16 from 161.06 at 170.45. Break there will target 138.2% projection at 174.03.
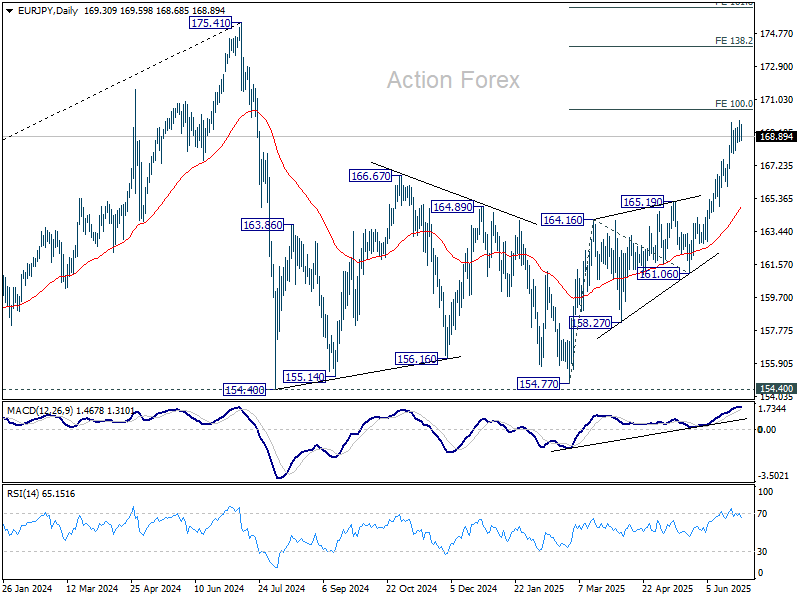
In the bigger picture, price actions from 175.41 are seen as correction to up trend from 114.42 (2020 low). Strong support should be seen from 38.2% retracement of 114.42 to 175.41 at 152.11 to contain downside. However, sustained break of 152.11 will bring deeper fall even still as a correction.
EUR/GBP Daily Outlook
Daily Pivots: (S1) 0.8516; (P) 0.8534; (R1) 0.8561; More...
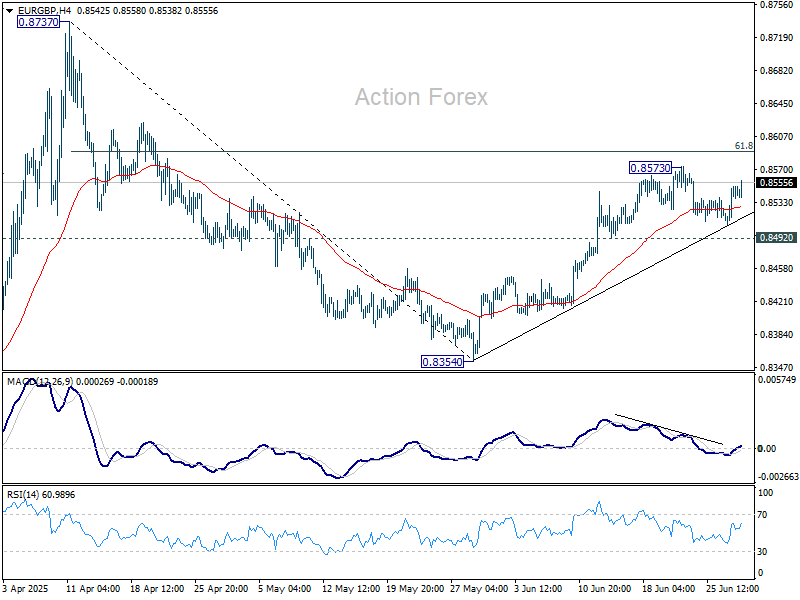
Intraday bias in EUR/GBP remains neutral and more consolidations could be seen below 0.8573. Further rally is expected as long as 0.8492 support holds. Above 0.8573 will target 61.8% retracement of 0.8737 to 0.8354 at 0.8591. Sustained break there will pave the way to 0.8737 resistance. However, firm break of 0.8492 will argue that rebound from 0.8354 has completed, and turn bias back to the downside.
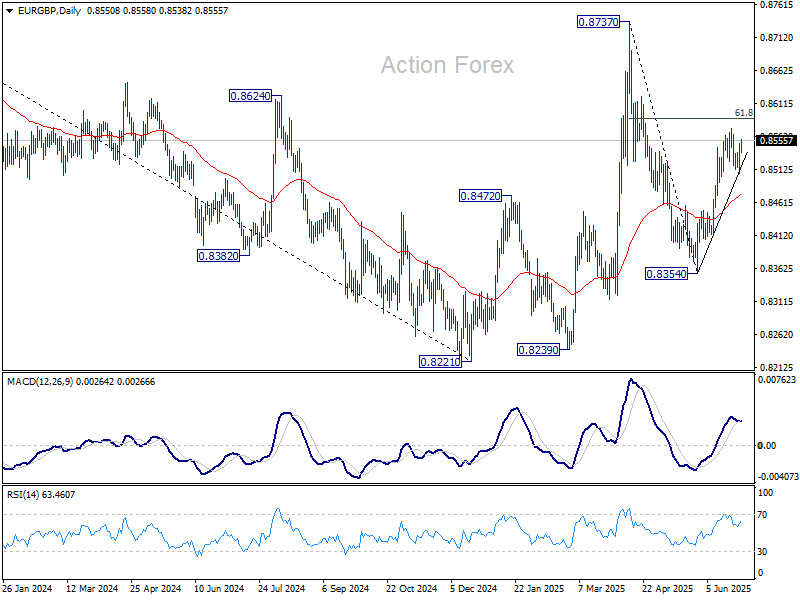
In the bigger picture, price actions from 0.8221 medium term bottom are seen as forming a corrective pattern to the down trend from 0.9267 (2022 high). Nevertheless, there is no clear momentum to break through 0.8201 key support (2022 low) yet. Hence, range trading is expected between 0.8221/8737 for now.
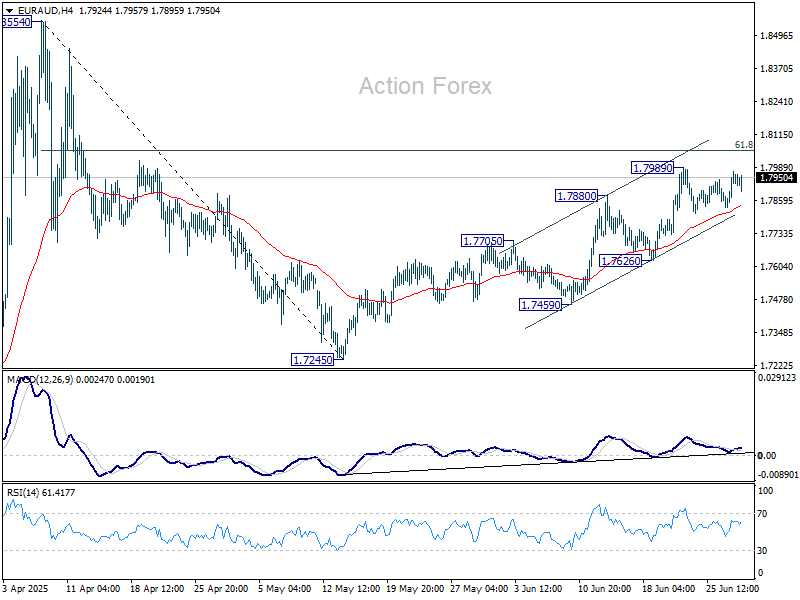
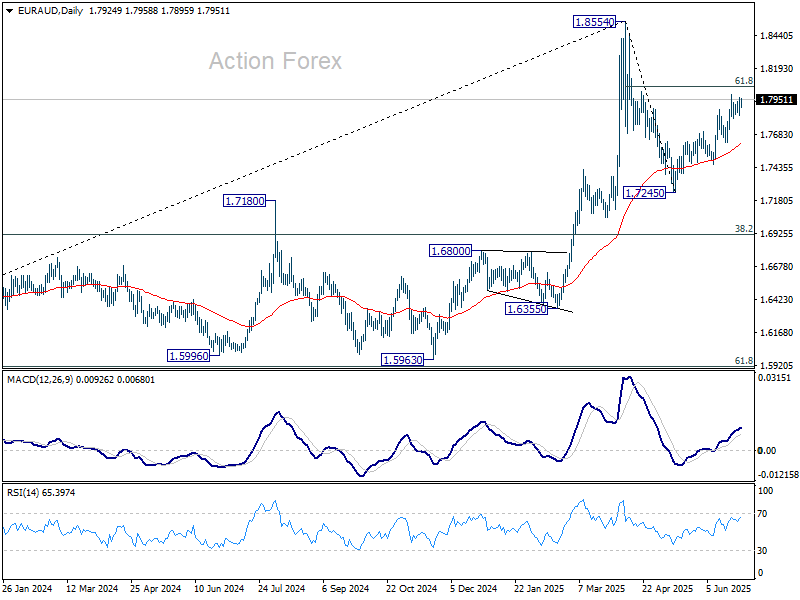
EUR/AUD Daily Outlook
Daily Pivots: (S1) 1.7858; (P) 1.7916; (R1) 1.7998; More...
Intraday bias in EUR/AUD remains neutral and more consolidations could be seen below 1.7989. Further rally is expected as long as 1.7626 support holds. Above 1.7989 will target 61.8% retracement of 1.8554 to 1.7245 at 1.8054. Sustained break there will pave the way to 1.8554.
In the bigger picture, price actions from 1.8554 medium term are seen as a corrective pattern. While deeper pullback might be seen, downside should be contained by 38.2% retracement of 1.4281 (2022 low) to 1.8554 at 1.6922 to bring rebound. Up trend from 1.4281 is expected to resume at a later stage.
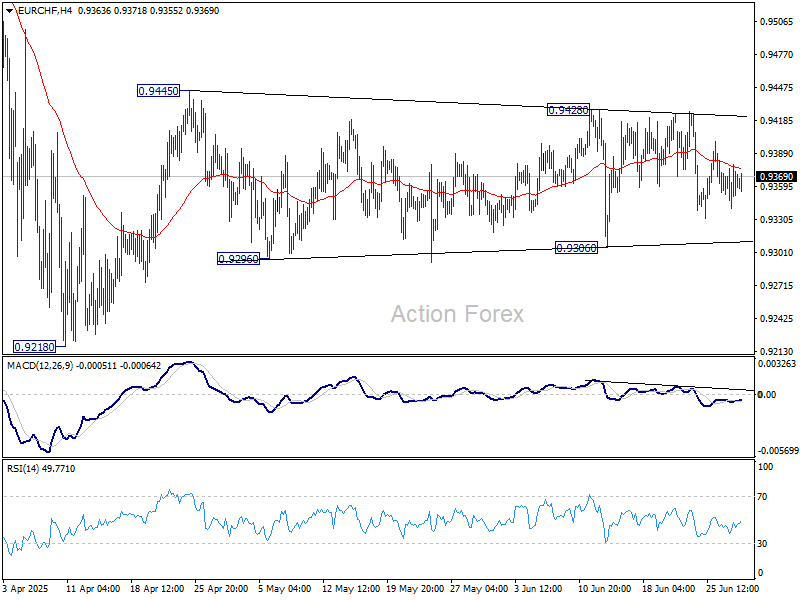
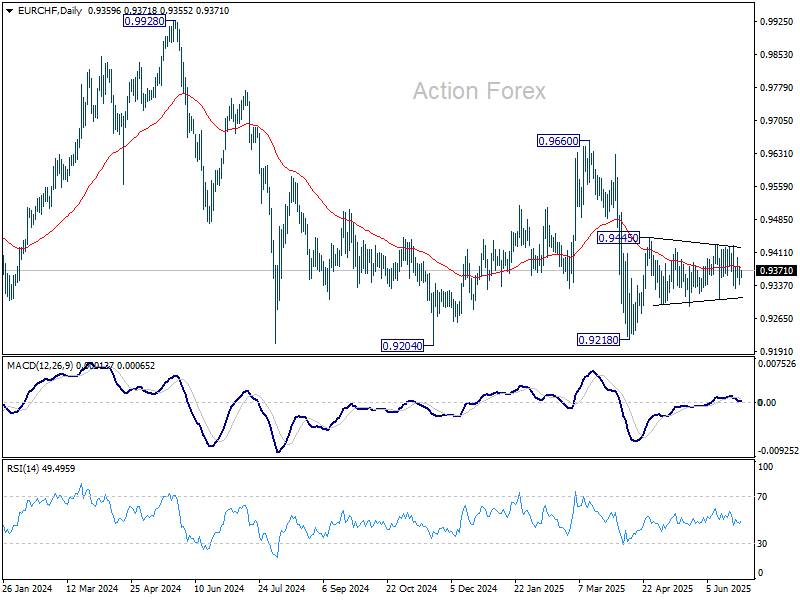
EUR/CHF Daily Outlook
Daily Pivots: (S1) 0.9342; (P) 0.9361; (R1) 0.9381; More....
EUR/CHF is still bounded in range of 0.9306/9428 and intraday bias stays neutral. Further rally is mildly in favor as long as 0.9306 support holds. On the upside, break of 0.9428/45 resistance zone will resume the rebound from 0.9218. On the downside, break of 0.9306 will bring retest of 0.9218 low instead.
In the bigger picture, while downside momentum has been diminishing as seen in W MACD, there is no sign of bottoming yet. EUR/CHF is still staying below 55 W EMA and well inside long term falling channel. Outlook will stay bearish as long as 0.9660 resistance holds. Break of 0.9204 (2024 low) will confirm resumption of down trend from 1.2004 (2018 high).
Platinum (PL) Soars, Kicking Off Fresh Bullish Rally
Platinum (PL) has broken out of its bearish channel this month, signaling strong bullish trend momentum. This article explores the latest long-term Elliott Wave technical outlook.
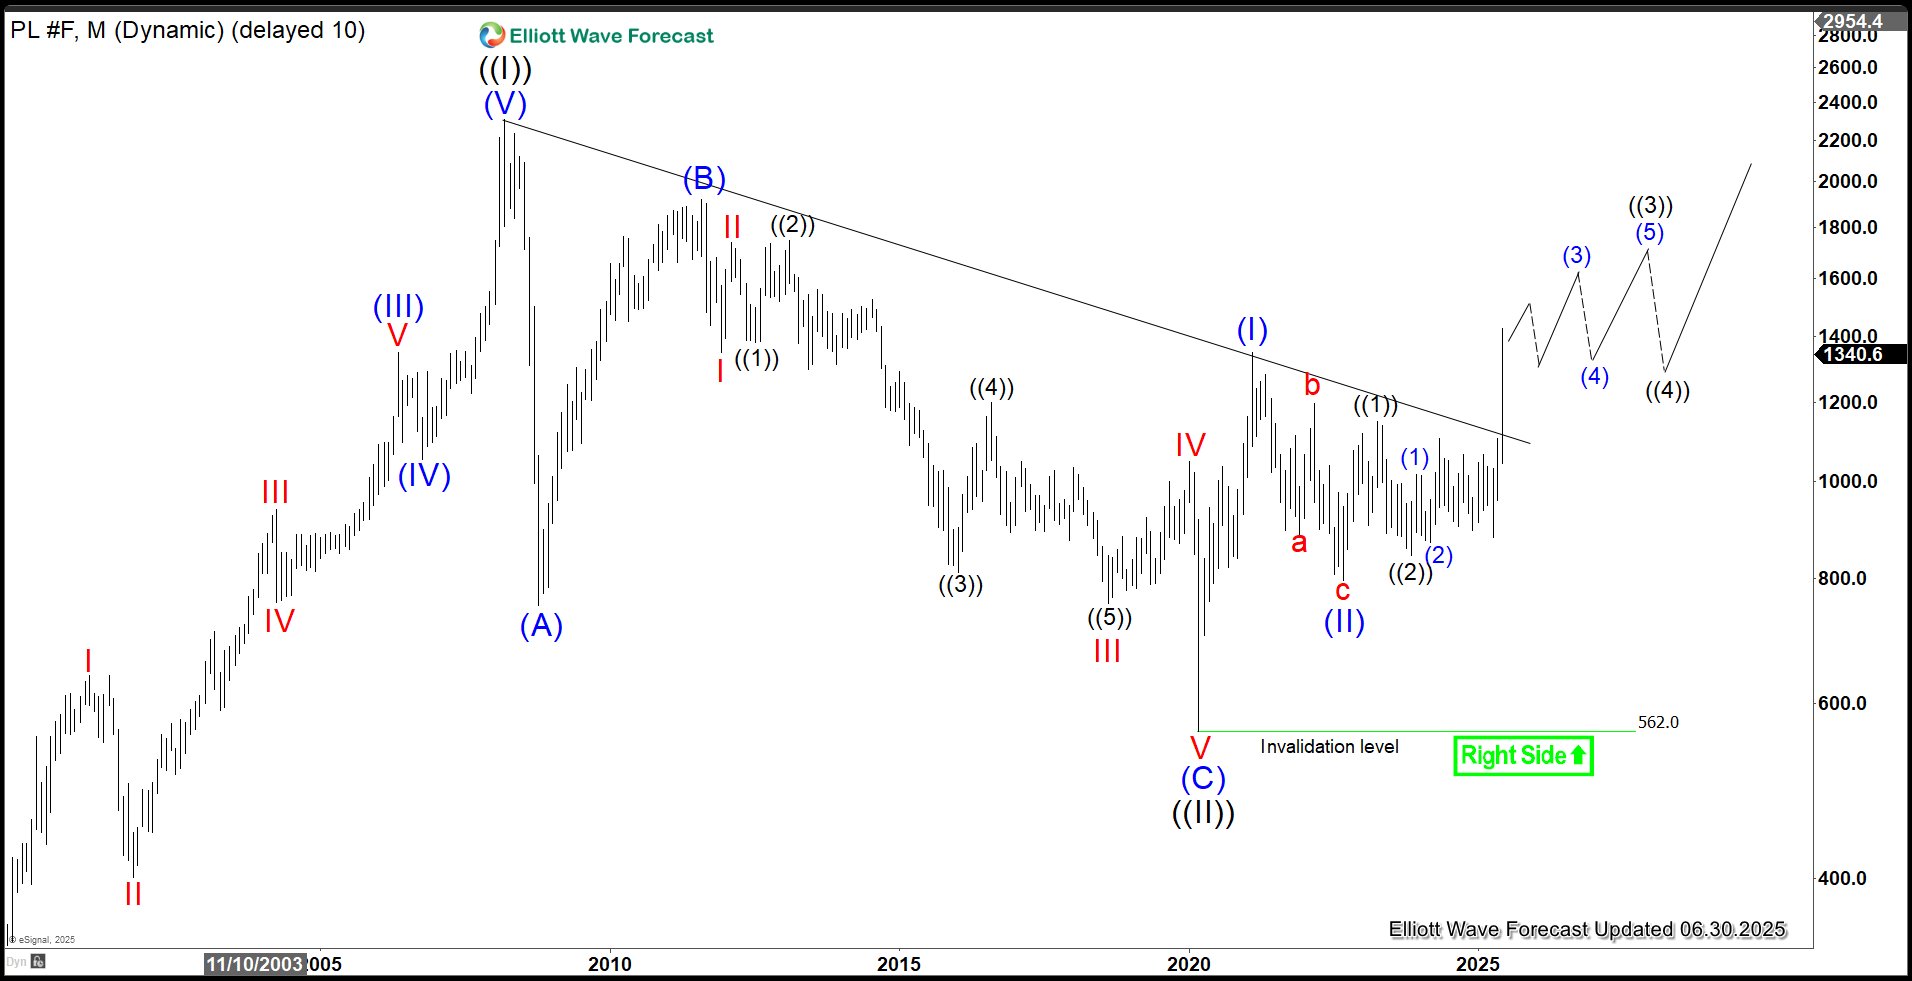
Platinum (PL) Monthly Elliott Wave Chart
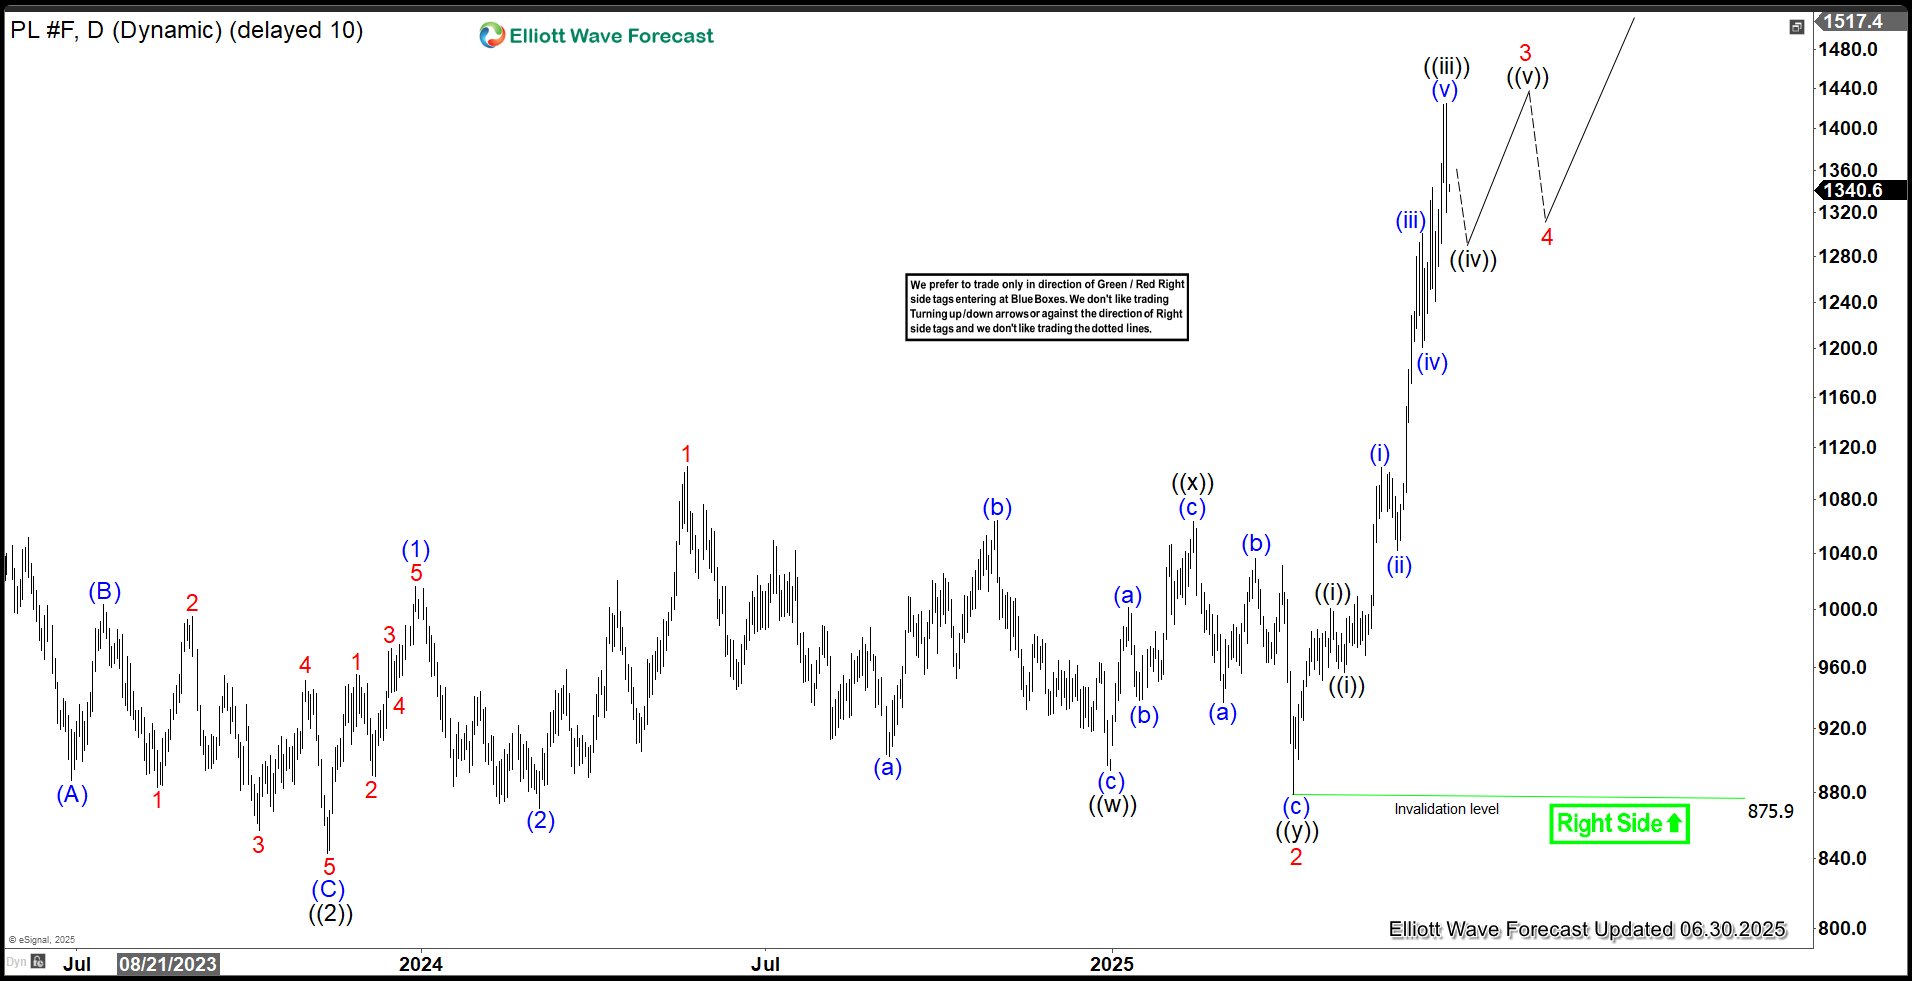
The monthly platinum chart indicates that the Grand Cycle wave ((II)) correction concluded at 562. The metal has since turned bullish, advancing in wave ((III)) with a nested impulse structure. From the wave ((II)) low, wave (I) of ((III)) peaked at 1348.2, followed by a pullback in wave (II) of ((III)) ending at 802.1. Platinum has since resumed its upward trajectory, breaking above the descending bearish trendline from the March 2008 peak, confirming a strong bullish shift. The metal is expected to continue rallying within its nested impulsive structure.
Platinum (PL) Daily Elliott Wave Chart
The daily platinum chart indicates that the wave ((2)) pullback concluded at 843.1. From there, wave 1 peaked at 1105, followed by a wave 2 pullback ending at 875.9. The metal has since resumed its ascent in wave 3. In the near term, as long as the price remains above 875.9, expect platinum to continue extending higher.