
Sample Category Title
USD/JPY Mid-Day Outlook
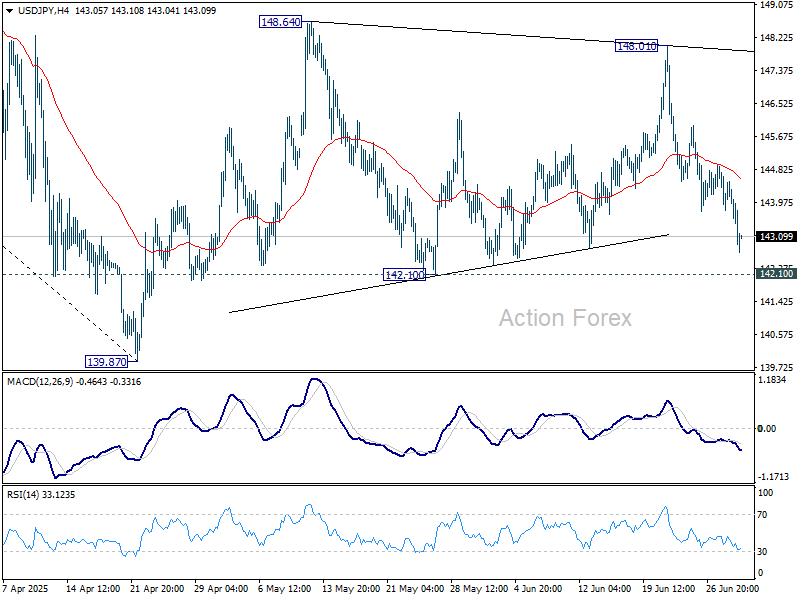
Daily Pivots: (S1) 143.62; (P) 144.19; (R1) 144.61; More...
USD/JPY's fall from 148.01 extended lower today but downside is contained above 142.10 support. Intraday bias stays neutral first On the upside, firm break of 148.01 resistance will resume the rise from 139.87 to 61.8% retracement of 158.86 to 139.87 at 151.22. However, break of 142.10 will bring deeper fall back to retest 139.87 low.
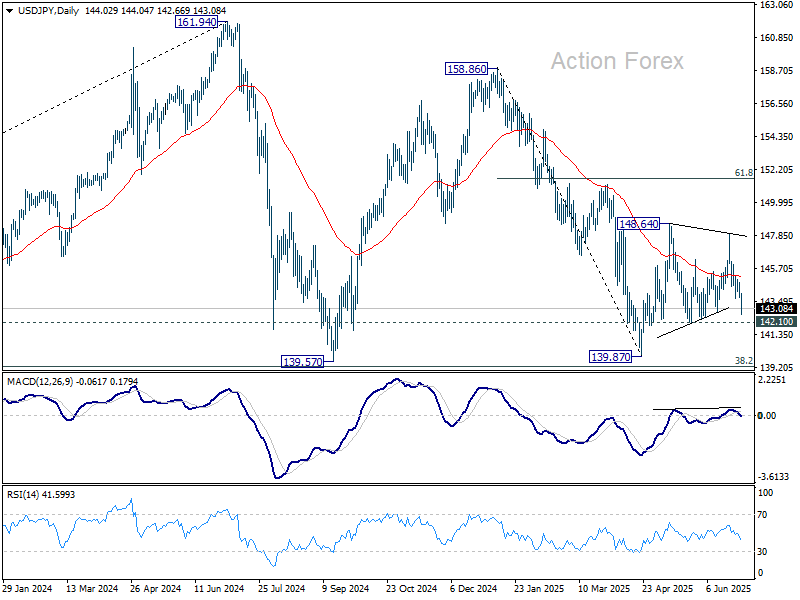
In the bigger picture, price actions from 161.94 are seen as a corrective pattern to rise from 102.58 (2021 low), with fall from 158.86 as the third leg. Strong support should be seen from 38.2% retracement of 102.58 to 161.94 at 139.26 to bring rebound. However, sustained break of 139.26 would open up deeper medium term decline to 61.8% retracement at 125.25.
USD/CHF Mid-Day Outlook
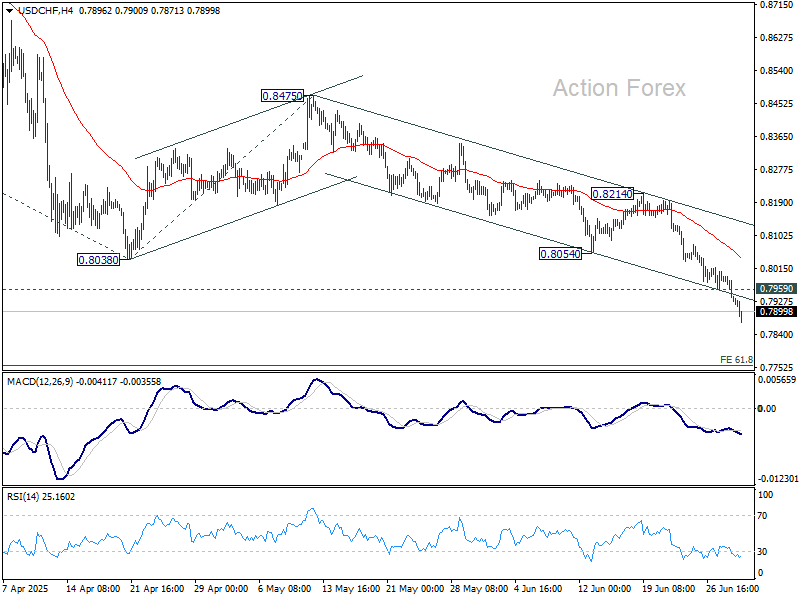
Daily Pivots: (S1) 0.7908; (P) 0.7951; (R1) 0.7974; More….
USD/CHF's decline is in progress and break of the near term falling channel suggests downside acceleration. Intraday bias stays on the downside for 61.8% projection of 0.9200 to 0.8038 from 0.8475 at 0.7757. Firm break there will pave the way to 100% projection at 0.7313 next. On the upside, above 0.7959 minor resistance will turn intraday bias neutral first. But recovery should be limited by 0.8054 support turned resistance to bring another fall.
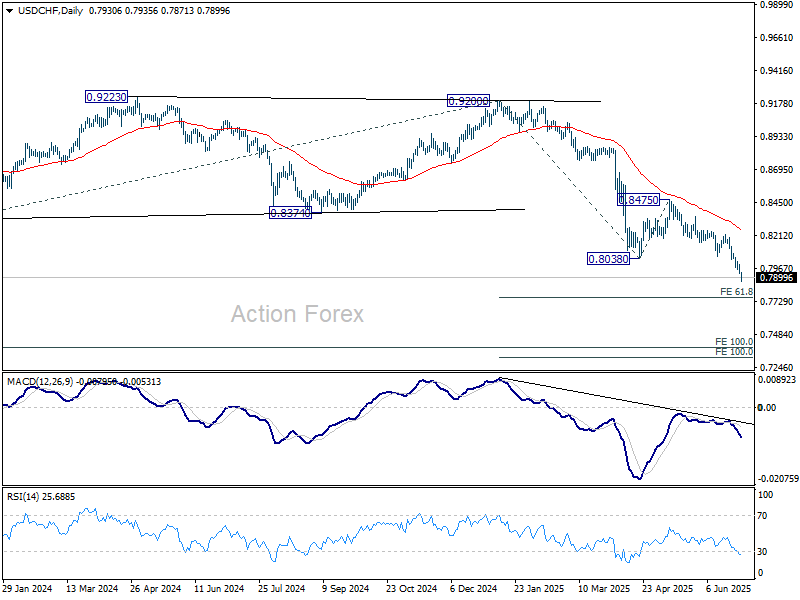
In the bigger picture, long term down trend from 1.0342 (2017 high) is still in progress. Next target is 100% projection of 1.0146 (2022 high) to 0.8332 from 0.9200 at 0.7382. In any case, outlook will stay bearish as long as 0.8475 resistance holds.
Dollar Extends Decline as Markets Starting to Embrace Three Fed Cuts in 2025
Dollar's slide deepened today as markets leaned harder into expectations of multiple Fed rate cuts in 2025. The move comes even before this week’s key economic data—ISM manufacturing, ISM services, and non-farm payrolls—hits the wires. The greenback’s decline is broad-based, with risk currencies like the New Zealand Dollar and safe havens such as Yen and Swiss Franc outperforming at the same time.
Goldman Sachs now forecasts three rate cuts this year, reversing its earlier call for a single reduction. The shift stems from what it described as “smaller-than-expected” impacts from US tariffs and stronger-than-expected disinflation. Analysts noted that some gauges of household inflation expectations had previously raised concerns, but early signs suggest those pressures may not warrant delaying cuts. The call aligns with market pricing, which now shows a over 96 chance of a September cut and around 65% odds of three total moves.
Alongside monetary policy, fiscal worries are creeping into investor sentiment too. The Senate is expected to vote today on US President Donald Trump’s expansive “Big Beautiful Bill,” a package of tax cuts and spending boosts that would widen the US fiscal deficit by US 3.3 trillion. Treasury Secretary Scott Bessent expressed optimism on the bill’s passage, but questions linger about its long-term economic sustainability, particularly in the context of slower growth and aggressive tariffs.
Markets are also digesting stalled trade negotiations, with the July 9 deadline for new tariffs approaching rapidly. Despite efforts, no breakthroughs have been achieved with key partners like Japan or the EU. Tensions remain high with risk undermining both investor confidence and trade flows.
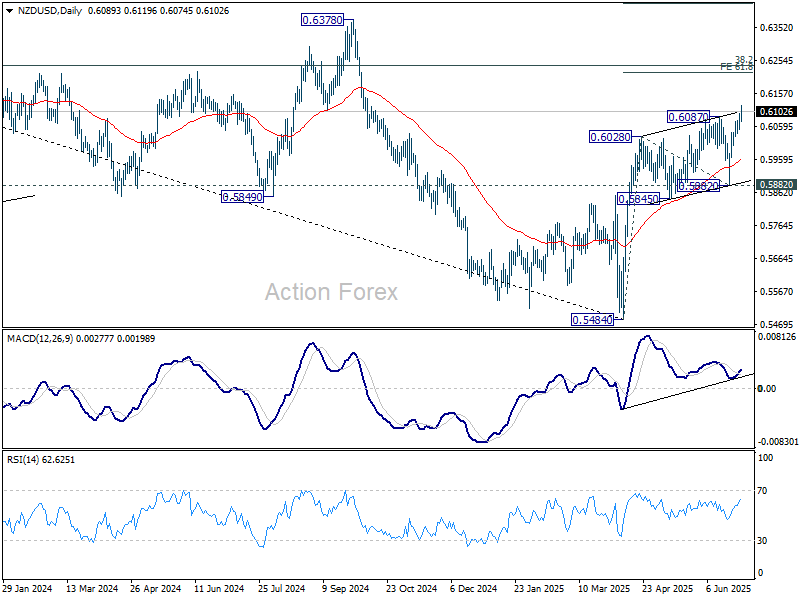
Technically, NZD/USD's rally from 0.5484 resumed this week by breaking through 0.6087 resistance. Further rise should be seen to 61.8% projection of 0.5484 to 0.6028 from 0.5882 at 0.6218. Outlook will stay bullish as long as 0.5882 support holds, in case of retreat.
In Europe, at the time of writing, FTSE is down -0.26%. DAX is down -0.65%. CAC is down -0.48%. UK 10-year yield is down -0.06 at 4.429. UK 10-year yield is down -0.056 at 2.552. Earlier in Asia, Nikkei fell -1.24%. Hong Kong was on holiday. China Shanghai SSE rose 0.39%. Singapore Strait Times rose 0.64%. Japan 10-year JGB yield fell -0.044 to 1.392.
Eurozone CPI rises to 2%, core steady at 2.3% in June
Eurozone headline CPI rose from 1.9% yoy to 2.0% yoy, in line with expectations. Core inflation (ex energy, food, alcohol & tobacco) held steady at 2.3% yoy.
The largest inflationary driver came from the services sector, where prices rose 3.3% annually, up from 3.2% in May. Food, alcohol, and tobacco also contributed, albeit slightly less than before, with prices up 3.1% compared to 3.2% the previous month.
Non-energy industrial goods inflation softened to 0.5% from 0.6%, while energy prices continued to fall, though at a slower pace, down -2.7% compared to May’s -3.6%.
ECB officials at Sintra keep slight dovish bias as easing cycle nears end
At the ECB’s annual forum in Sintra, policymakers reinforced that it's is nearing the end of its easing cycle, even though further rate cut cannot be ruled out.
Chief Economist Philip Lane emphasized that the “last cycle” of battling post-pandemic inflation is over, having brought price growth down from 10% to near the 2% target. Still, he clarified that being “done” with the previous cycle does not rule out additional moves if circumstances change, particularly as the eurozone faces lingering uncertainty from global trade tensions and weak growth.
Belgian central bank chief Pierre Wunsch echoed the sentiment, saying the “job is mostly done” on inflation but that risks are now tilted to the downside. Wunsch added that "“if we have to move more it probably will be to the downside, a further cut."
Latvian central banker Martins Kazaks added that any future moves would likely be small and designed as fine-tuning or “insurance cuts.” He cited Euro’s recent appreciation as a potential drag on inflation and exports, reinforcing the case for a cautious bias toward easing.
Vice President Luis de Guindos said that while the current EUR/USD exchange rate—hovering near 1.17—is not concerning, a rapid move beyond 1.20 would begin to pose challenges for inflation and competitiveness. "But 1.20 is perfectly acceptable."
Lithuania’s Gediminas Šimkus also leaned dovish, stating that any next move would “be down,” though he remained cautious about timing. He said September might be too early to decide. Simkus added: "I believe a move, if any, is more likely towards the end of the year."
Eurozone PMI manufacturing finalized at 49.5, divergences persist
Eurozone Manufacturing PMI was finalized at 49.5 in June, up slightly from 49.4 in May and marking the highest level in nearly three years. The data reflects gradual stabilization across the bloc’s industrial base, with output expanding for the fourth straight month and new orders showing signs of bottoming out. However, the headline figure remains below the 50-mark, signaling the sector is still technically in contraction.
Among individual economies, Ireland (53.7), Greece (53.1), Spain (51.4), and the Netherlands (51.2) led the pack with readings in expansion territory. In contrast, France (48.1), Italy (48.4), and Austria (47.0) continued to weigh on the region, posting multi-month lows. Germany, the bloc’s industrial engine, came in at 49.0—its best level in 34 months, but still shy of expansion.
Hamburg Commercial Bank’s Cyrus de la Rubia noted that longer delivery times and a stabilization in order books are early signs of a pickup in demand, despite ongoing macro risks from tariffs, the Middle East, and Ukraine. He added that if Germany returns to growth—helped by fiscal support from the new coalition—France, Italy, and Austria could follow, given their strong trade ties.
BoE's Bailey highlights labor weakness and investment hesitation
BoE Governor Andrew Bailey highlighted mounting signs of economic softness in a CNBC interview, pointing to a weakening labor market and subdued investment as key headwinds. “That increase in uncertainty and predictability is definitely coming through in terms of activity and growth,” he said, citing conversations with businesses delaying capital spending.
Bailey reiterated that interest rates are likely to fall “gradually,” offering no specific guidance on the Bank’s next move in August, saying only, “We’ll see.” His tone leaned more dovish, noting that the labor market is “softening” and that this weakness is becoming more visible. Although BoE continues to monitor for sticky inflation, Bailey placed stronger emphasis on downside risks to growth and investment sentiment.
UK PMI manufacturing finalized at 47.7, improving outlook still fragile
The UK manufacturing sector showed tentative "signs of stabilization" in June, with PMI Manufacturing index finalized at 47.7, its highest in five months.
While the reading remains in contractionary territory, the pace of decline in production, new orders, and employment all slowed. Business optimism improved to a four-month high, and the orders-to-inventory ratio — a key forward-looking indicator — surged to its strongest level since August 2024, raising hopes of a potential rebound in output.
Rob Dobson, Director at S&P Global Market Intelligence, noted that inflationary pressures are also easing, with both input costs and selling prices rising at slower rates. However, he warned that any recovery remains vulnerable to multiple external risks. These include ongoing geopolitical tensions, global demand weakness, tariff-related uncertainties, and domestic political shifts.
SNB's Zanetti says negative rates on the table if needed
SNB board member Atillio Zanetti signaled that policymakers are not ruling out a return to negative interest rates if economic conditions warrant it.
“It’s not an obvious step to go into negative rates,” Zanetti said, acknowledging the unconventional nature of such a move, “but I wouldn’t say that we don’t want to do that if that’s necessary.”
He emphasized that while negative rates remain a tool in the SNB’s arsenal, their effectiveness differs from conventional policy. “We are aware that the transmission of monetary policy with negative rates is different than in positive territory.”
BoJ Tankan signals resilience, keeps 2025 hike option alive
Japan’s Q2 Tankan survey showed business sentiment holding firm despite intensifying trade tensions. While today’s Tankan beat won’t trigger immediate action, it keeps the door open for a BoJ hike policy shift before year-end, especially if trade risks stabilize.
Large manufacturers posted a headline index of +13, beating expectations of 10, and reaching the highest level since December 2024. Their forward outlook for September came in at +12, also topping forecasts of 9. The services side was more mixed. Large non-manufacturers remained steady at +34, meeting expectations, but this marked a softening from prior readings, with the September outlook dipping to +27.
Still, capital expenditure plans surprised to the upside: large firms projected FY2025/26 capex to rise 11.5% (vs. 10.0% expected), while small firms were slightly less pessimistic than forecast. The investment data points to continued confidence in the domestic recovery.
Inflation expectations remained broadly stable. Firms anticipate CPI to rise 2.4% over both one-year and three-year horizons—unchanged to slightly lower from the previous survey.
Japan's PMI manufacturing finalized at 50.1, demand still fragile
Japan’s Manufacturing PMI was finalized at 50.1 in June, rising from 49.4 in May. While production and employment ticked higher, underlying demand remained weak.
According to S&P Global’s Annabel Fiddes, firms reported continued declines in both domestic and overseas sales, reflecting the lingering impact of global uncertainty—particularly around US tariff policy.
Despite soft demand, business sentiment improved, encouraging firms to boost output and hiring. However, Fiddes emphasized that a "renewed and sustained improvement in customer demand" is still needed to drive a broader recovery.
Price pressures also "picked up slightly", with both input costs and selling prices rising above their long-term averages, suggesting inflationary risks remain embedded in supply chains.
China Caixin PMI manufacturing rises to 50.4, but optimism fades
China’s Caixin PMI Manufacturing rose to 50.4 in June from 48.3, topping expectations of 49.0 and marking a return to expansion territory. However, Wang Zhe of Caixin Insight cautioned that job losses persisted, external demand remained weak, and price pressures were subdued.
While the latest figures point to near-term stabilization, underlying risks remain elevated. Wang stressed that domestic demand has yet to see a fundamental turnaround and that businesses have grown less optimistic. With logistics and purchasing activity still soft, and global uncertainty intensifying, the sustainability of June’s rebound remains in question unless further policy support or demand recovery materializes.
NZIER survey shows NZ business confidence rising, inflation pressures easing
New Zealand business confidence improved modestly in Q2, with a net 22% of firms expecting better conditions ahead, up from 19% in Q1, according to NZIER’s quarterly survey.
Inflationary pressure appears to be cooling. 1% of firms reported price cuts in Q2, a sharp turnaround from the 8% that raised prices in Q1.
The report pointed to a continued "divergence between firms experiencing weak demand and firms expecting a recovery in demand", underlining an uneven domestic outlook despite improved sentiment.
NZIER said the effect of interest rate cuts since last August has yet to fully feed through to real activity, despite supporting sentiment.
USD/CHF Mid-Day Outlook
Daily Pivots: (S1) 0.7908; (P) 0.7951; (R1) 0.7974; More….
USD/CHF's decline is in progress and break of the near term falling channel suggests downside acceleration. Intraday bias stays on the downside for 61.8% projection of 0.9200 to 0.8038 from 0.8475 at 0.7757. Firm break there will pave the way to 100% projection at 0.7313 next. On the upside, above 0.7959 minor resistance will turn intraday bias neutral first. But recovery should be limited by 0.8054 support turned resistance to bring another fall.
In the bigger picture, long term down trend from 1.0342 (2017 high) is still in progress. Next target is 100% projection of 1.0146 (2022 high) to 0.8332 from 0.9200 at 0.7382. In any case, outlook will stay bearish as long as 0.8475 resistance holds.
SNB’s Zanetti says negative rates on the table if needed
SNB board member Atillio Zanetti signaled that policymakers are not ruling out a return to negative interest rates if economic conditions warrant it.
“It’s not an obvious step to go into negative rates,” Zanetti said, acknowledging the unconventional nature of such a move, “but I wouldn’t say that we don’t want to do that if that’s necessary.”
He emphasized that while negative rates remain a tool in the SNB’s arsenal, their effectiveness differs from conventional policy. “We are aware that the transmission of monetary policy with negative rates is different than in positive territory.”
Eurozone CPI Rises Slightly to 2.0%, ECB Says It Will Remain Vigilant
The euro continues to rallly and has put together nine straight winning sessions. Earlier, the EUR/USD pushed above the 1.18 line for the first time since Sep. 2021. In the European session, EUR/USD is trading at 1.1820, up 0.29% on the day.
Eurozone CPI inches higher, core rate steady
Eurozone CPI rose slightly to 2.0% y/y in June, in line with the consensus. This was up from 1.9% in May, which marked an eight-month low. Monthly, CPI jumped 0.3%, up from 0% in May which was also the consensus.
Core CPI, which excludes food and energy, was unchanged at 2.3%, matching the market estimate. Services inflation, which has been stubbornly high, rose to 3.3% from 3.2% in May.
The European Central Bank will be encouraged by the inflation report, as well as Monday's German CPI data which showed inflation easing slightly. The ECB isn't expected to lower rates at the July 24th meeting, but the markets have priced in a final rate cut before the end of the year.
ECB policymakers are well aware that the inflation battle isn't over. Services inflation is well above the ECB's 2% inflation target and there are concerns that US tariffs could still send inflation higher.
ECB President Lagarde reiterated the Bank's cautious approach in remarks at the ECB Forum in Sintra. Lagarde said the Bank would need time to ensure that the "risks of above-target inflation have passed" and that the ECB would need to "remain vigilant".
US ISM Manufacturing PMI expected to contract for fourth successive month
US ISM Manufacturing PMI for June, which will be released later today, is expected to contract for a fourth straight time. The market estimate stands at 48.8, following 48.5 in May, which was the weakest reading since Nov. 2024. The manufacturing sector has been hit by growing economic uncertainty, in particular President Trump's erratic trade policies.
EUR/USD Technical
- EUR/USD has pushed above resistance at 1.1796. Above, there is resistance at 1.1826
- The next support levels are 1.1776 and 1.1746
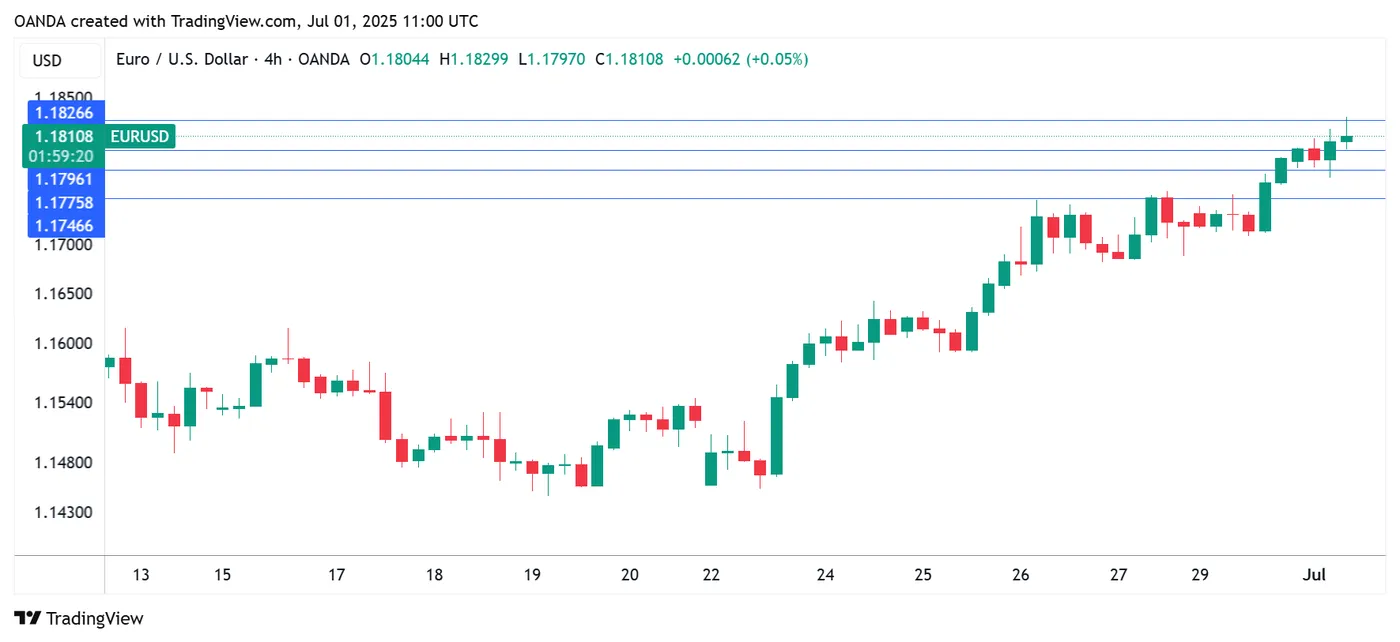
EURUSD 1-Day Chart, July 1, 2025
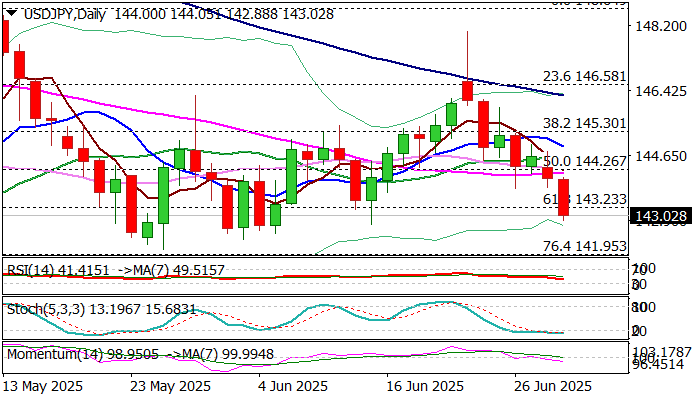
USD/JPY Outlook: Bears Accelerate
Bears accelerated on Tuesday and probe below 143 handle following breach of Fibo support at 143.23 (61.8% retracement of 139.88/148.64 uptrend.
The downtrend from June 23 spike high (148.02) remains firmly in play and keys supports at 142.30 (daily higher base) and 141.95 (Fibo 76.4%), guarding key supports at 140.00/139.88 (psychological/2025 low of Apr 22).
Daily studies are in full bearish configuration, with growing negative momentum and recent break below daily cloud, seen as highlights.
Today’s close below broken Fibo (143.23) to confirm bearish signal.
Meanwhile, oversold conditions on daily chart provide initial warning that bears may pause for consolidation/limited correction.
Extended upticks should stay below cloud base (144.35) to keep bears in play.
Res: 143.23; 143.75; 144.05; 144.26.
Sup: 142.79; 142.30; 141.95; 141.61.
BoE’s Bailey highlights labor weakness and investment hesitation
BoE Governor Andrew Bailey highlighted mounting signs of economic softness in a CNBC interview, pointing to a weakening labor market and subdued investment as key headwinds. “That increase in uncertainty and predictability is definitely coming through in terms of activity and growth,” he said, citing conversations with businesses delaying capital spending.
Bailey reiterated that interest rates are likely to fall “gradually,” offering no specific guidance on the Bank’s next move in August, saying only, “We’ll see.” His tone leaned more dovish, noting that the labor market is “softening” and that this weakness is becoming more visible. Although BoE continues to monitor for sticky inflation, Bailey placed stronger emphasis on downside risks to growth and investment sentiment.
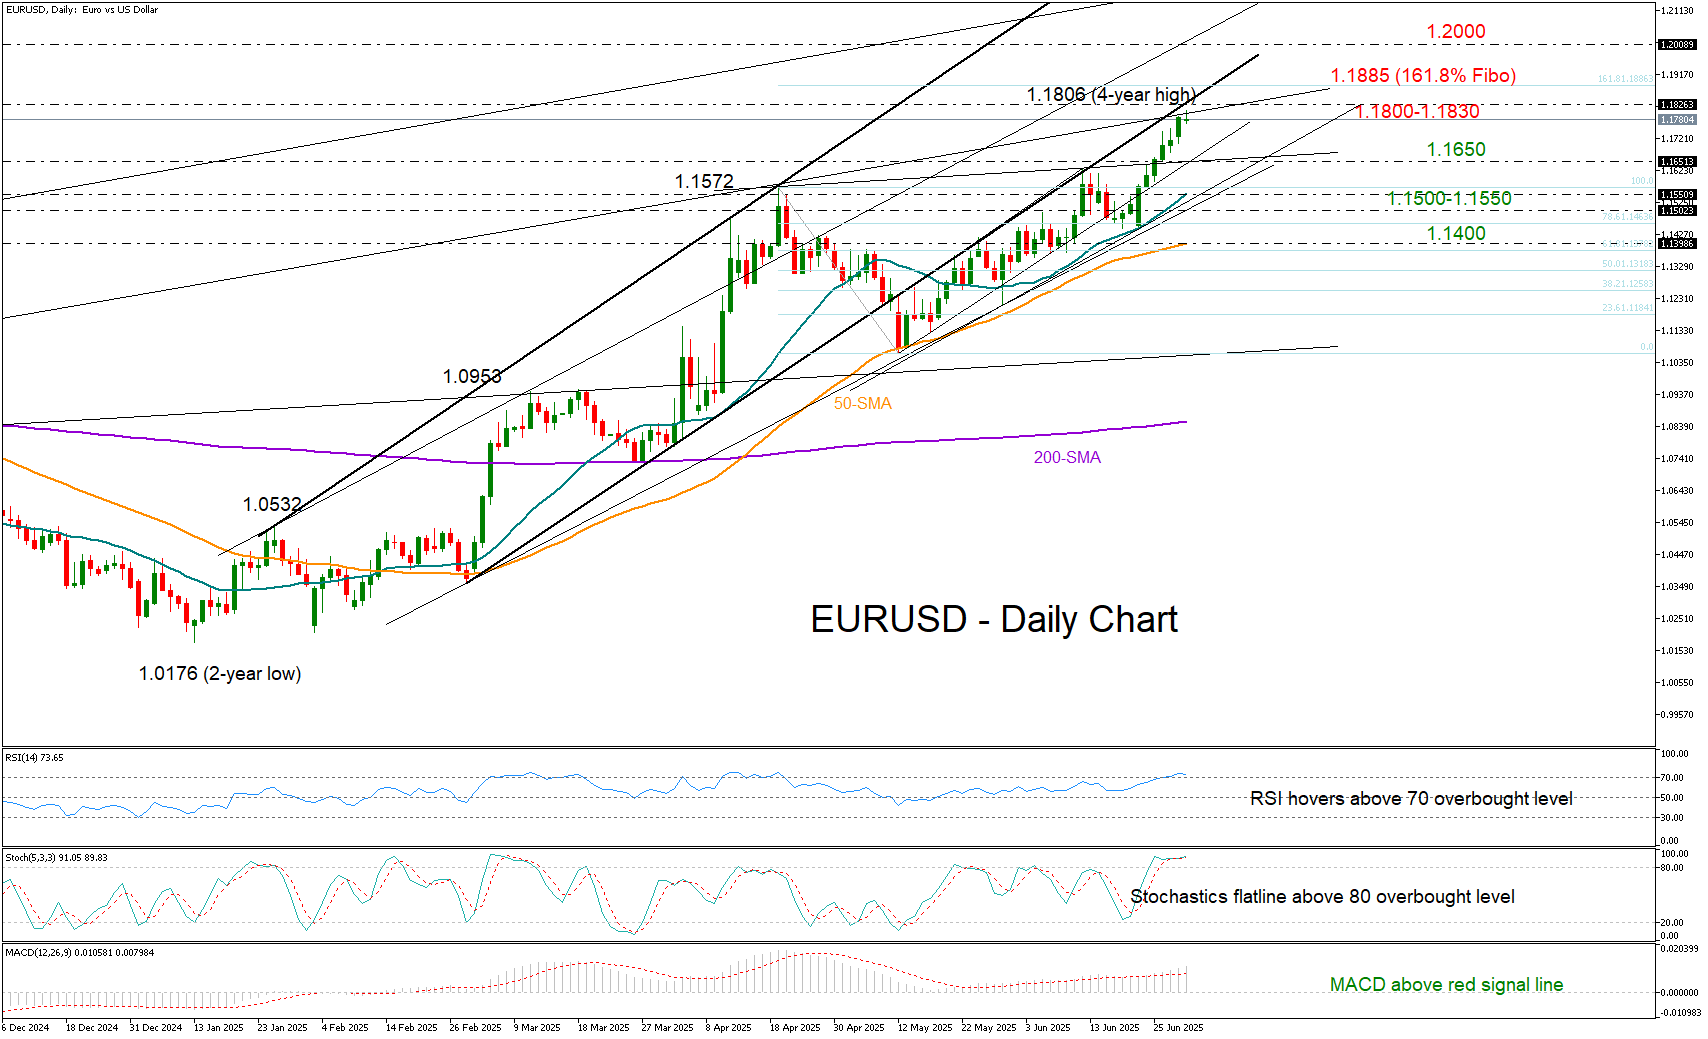
EUR/USD Hits Another Milestone
- EURUSD upgrades short-term outlook as non-stop rally reaches 1.1800.
- Technical picture reflects cooling buying interest.
EURUSD reached the 1.1800 level for the first time in nearly four years, supported by ongoing weakness in the US dollar and growing optimism that the EU may soon finalize a trade agreement with the US.
Following the impressive 7.0% rally from May's low of 1.1064, however, there is speculation that some stability could emerge in the short-term as the RSI and the stochastic oscillator are flattening in the overbought territory and the price is hovering near the critical support-turned-resistance trendline from June 2024.
Should bearish momentum build – particularly if eurozone CPI inflation continues to fall below the European Central Bank’s 2.0% target—the pair may flip backwards to test the 1.1650 support zone ahead of the 20-day simple moving average (SMA) at 1.1550. Additional declines below 1.1500 could stall near the 50-day SMA, while a break below this level may intensify selling pressure towards 1.1270.
On the other hand, a resurgence in inflation above 2.0% could lead ECB policymakers to maintain current interest rates for a longer period. This scenario could empower the bulls to push past the 1.1800–1.1830 resistance area, opening the door to 1.2000 – provided the 161.8% Fibonacci extension of the previous downtrend at 1.1885 and the 1.1950 resistance from August–September 2021 are cleared.
In summary, EURUSD has strengthened its bullish outlook, but with technical indicators signaling overbought conditions, a short-term slowdown or correction may be imminent.
Bitcoin Price Forms a Potentially Strong Bullish Pattern
Positive sentiment in the cryptocurrency market is currently being driven by:
→ The approval of a bill regulating the status of stablecoins;
→ Easing geopolitical tensions (a ceasefire in the Middle East and a trade agreement between China and the US);
→ Weakening US dollar, which increases the attractiveness of assets priced in USD.
These and other developments have contributed to a strong bullish impulse (indicated by the arrow) on the BTC/USD chart. According to media reports, $2.2 billion was invested in Bitcoin over the past week, signalling an acceleration in capital inflows. Since the beginning of 2025, nearly $17 billion has been invested. So, how might things unfold from here?
Technical Analysis of the BTC/USD Chart
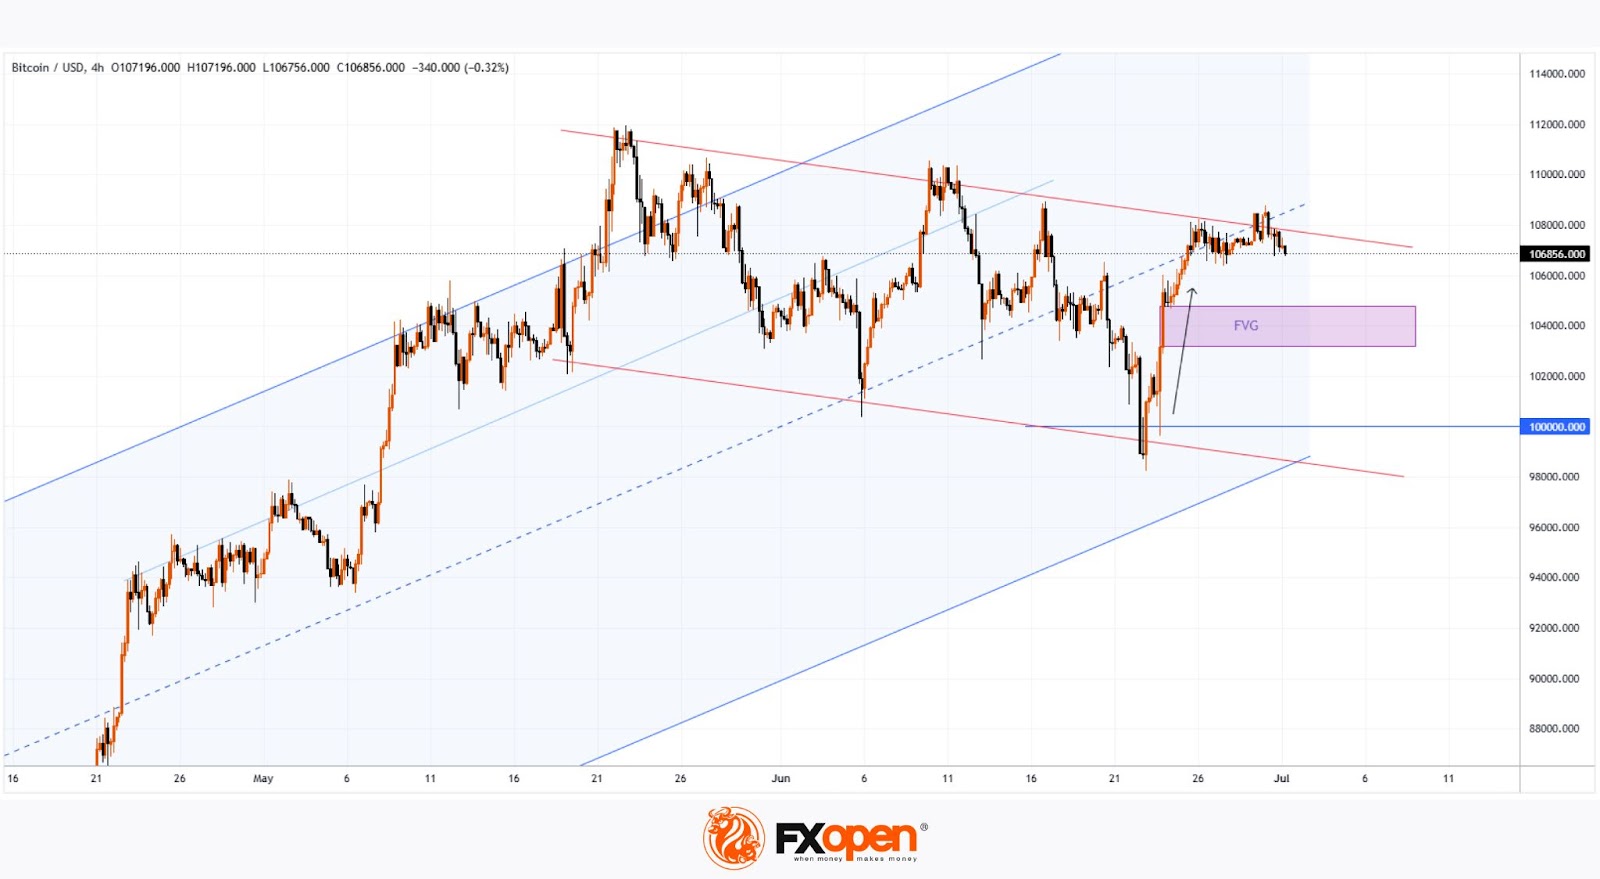
The chart shows that Bitcoin price movements have formed an ascending channel (highlighted in blue), with a strong rebound from the psychological $100k level (whose significance we discussed on 23 June) underscoring robust demand and casting doubt on the idea that Bitcoin might ever stabilise in the five-digit range again.
From a technical perspective, the setup resembles a Bull Flag pattern, forming (as marked by the red lines) within a long-term uptrend. This is a potentially powerful scenario, in which a breakout above the upper boundary of the pattern could lead to a continuation of the broader rally.
In the short term, bulls might encounter resistance along the red trendline; however, note the aggressive surge marked by the arrow. In Smart Money Concept terms, this could be interpreted as a Fair Value Gap pattern—indicating strong buyer dominance. It’s also worth noting that the broad area shaded in purple might act as a support zone for bulls attempting to break through the corrective structure.
FXOpen offers the world's most popular cryptocurrency CFDs*, including Bitcoin and Ethereum. Floating spreads, 1:2 leverage — at your service. Open your trading account now or learn more about crypto CFD trading with FXOpen.
*Important: At FXOpen UK, Cryptocurrency trading via CFDs is only available to our Professional clients. They are not available for trading by Retail clients. To find out more information about how this may affect you, please get in touch with our team.
This article represents the opinion of the Companies operating under the FXOpen brand only. It is not to be construed as an offer, solicitation, or recommendation with respect to products and services provided by the Companies operating under the FXOpen brand, nor is it to be considered financial advice.
USD/CHF Exchange Rate Falls to Multi-Year Low
According to the chart, the USD/CHF exchange rate has settled below the key psychological level of 0.8000. The rate hasn’t been this low since the financial crisis of 2008.
On one hand, the drop in USD/CHF is driven by weakness in the US dollar. The US dollar index has fallen to its lowest level in over three years, largely due to the conflicting trade policies pursued by the Trump administration. On the other hand, geopolitical instability has increased the appeal of the Swiss franc as a so-called safe-haven asset.
Technical Analysis of the USD/CHF Chart
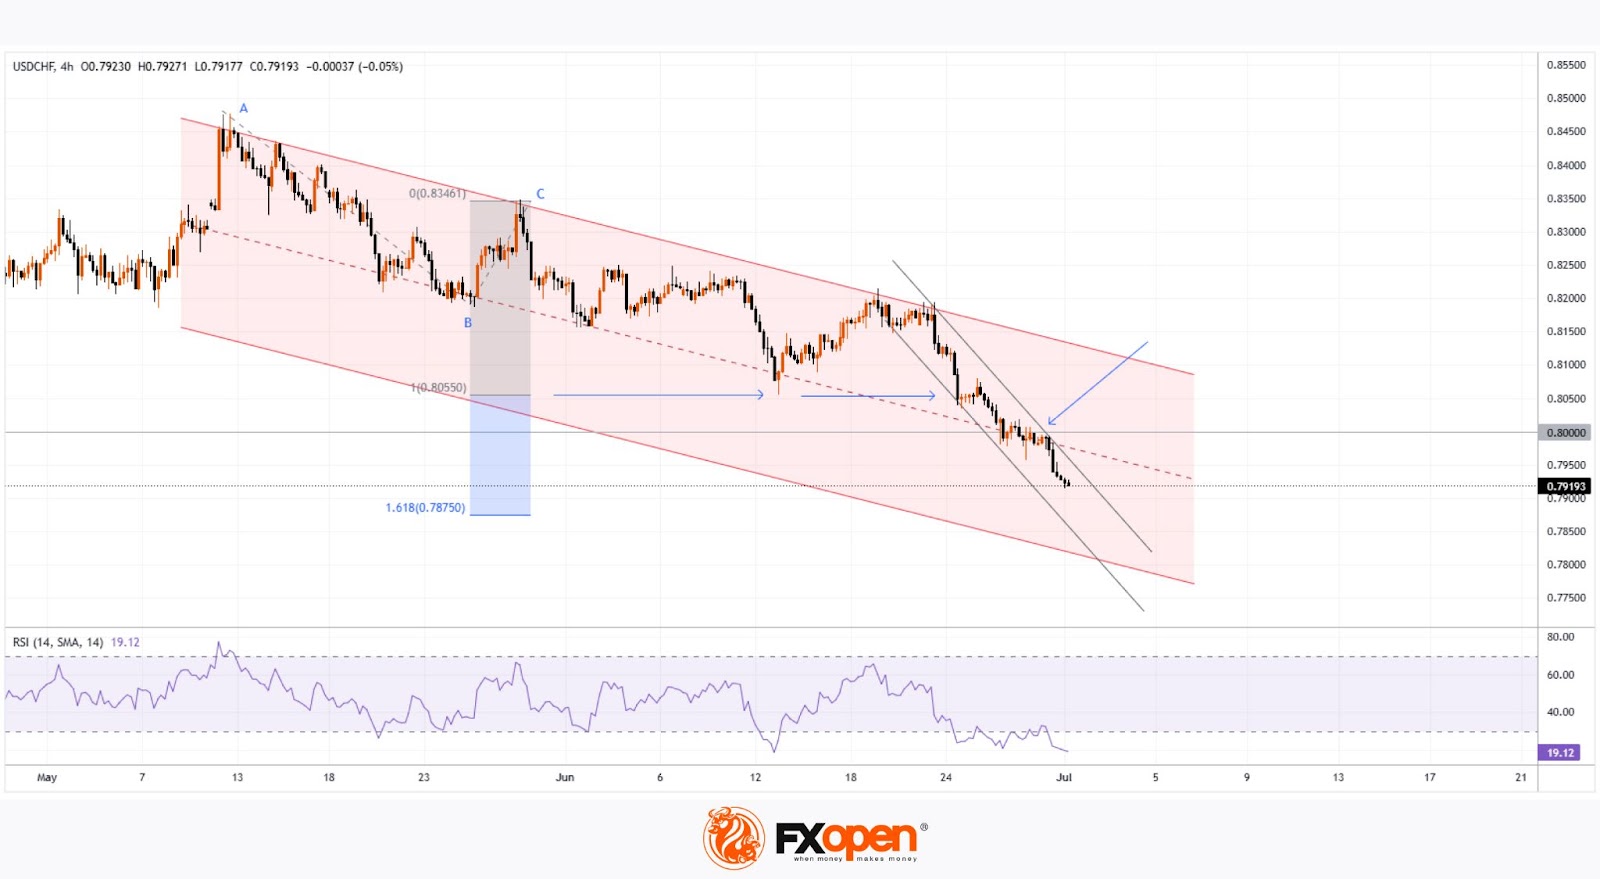
Since mid-May, price fluctuations have formed a downward channel (marked in red), and by the end of June the rate had stabilised around the psychological threshold of 0.8000 (indicated by an arrow) — right at the median of the channel.
However, this balance between supply and demand proved temporary, tipping in favour of sellers. As a result, we now see a decline in USD/CHF along a steep trajectory (marked in black), potentially targeting the lower boundary of the red channel — which suggests a possible move down to 0.7800 USD per franc. Along this path, support may come from the 1.618 Fibonacci extension level (0.7875); note how the 0.8055 level previously acted as support (marked with a blue arrow).
The RSI indicator confirms strong selling pressure — but will the bearish trend continue?
Much will depend on the broader fundamental context. As reported by the Wall Street Journal, the sharp strengthening of the franc against the dollar is causing growing concern at the Swiss National Bank (SNB), as an overly strong franc harms Swiss exporters. This suggests that the current market sentiment could shift dramatically if the SNB issues any relevant statements.
Trade over 50 forex markets 24 hours a day with FXOpen. Take advantage of low commissions, deep liquidity, and spreads from 0.0 pips. Open your FXOpen account now or learn more about trading forex with FXOpen.
This article represents the opinion of the Companies operating under the FXOpen brand only. It is not to be construed as an offer, solicitation, or recommendation with respect to products and services provided by the Companies operating under the FXOpen brand, nor is it to be considered financial advice.