Sample Category Title
Dollar Weakness is the Name of the Game
Markets
The US Senate pulled an all-nighter and squeaked through president Trump’s supersized bill. Vice-president Vance had to break the tie in favour of the bill with a nail-biting 51-50 vote. The Senate’s version of the OBBB now returns to the House, where a vote is expected today or tomorrow. Voting it down means both chambers need to look for a compromise but that’s going to scupper Trump’s unofficial July 4th deadline. Either way, after having come this far it’s safe to assume the bill will pass eventually, in any case before the end of they year. US deficits, debt and risk premia & therefore long-term yields will rise. The near-certain passing of OBBB redirects the short-term spotlights back to trade. When asked yesterday, Trump repeated he’s not considering to delay the July 9 deadline (end of the tariff pause). It’s unclear whether this is coming from growing frustration with Japan, which Trump seems to making an example out of for other trading partners, including the EU. It’s also conflicting with signals from the likes of USTS Bessent. In the end it could just simply be Trump upping the ante ahead of intensive trade talks in the coming days. The impact on markets was in any case limited. Stronger-than-expected US economic data turned out to be the more important driver instead. JOLTS job openings and the manufacturing ISM (although with mixed details) helped pull rates up to 5.3 bps higher at the front end of the curve. Bunds outperformed Treasuries and sent yields between 1.2 and 4.7 bps lower in a bull flattener. Yesterday’s Sintra panel conversation between ECB’s Lagarde, Fed’s Powell and BoJ’s Ueda offered nothing materially new. Data dependency remains the buzz word and for Powell that meant nothing is to be ruled out or in at any meeting, including (an in our view unlikely) cut in July. The most notable comments actually came on the sidelines of the ECB symposium from vice-chair de Guindos on the level of the common currency: 1.17 (EUR/USD) or even 1.20 can be overlooked at, he said, but “something beyond would be much more complicated” in terms of hitting the 2% inflation mark sustainably. Markets seem keen to test the ECB’s patience with the first EUR/USD close north of 1.18 since September 2021. The trade-weighted dollar dropped further to 96.82 after having gone as low as 96.37. Dollar weakness is the name of the game, despite a poor attempt to recover some ground this morning. The greenback stays vulnerable for the upcoming batch of data. It’s telling how USD failed to benefit yesterday even with yield differentials moving in its favour. The ADP job report for June is due today. Consensus expects employment to have grown by 98k after May’s meagre 35k. In the UK meanwhile, PM Starmer tried to save face with another policy reversal in what supposed to be his flagship welfare reforms. Risking a backlash from rebel Labour MPs, the government dropped the key cost-saving part of the bill. UK Chancellor Reeves’ Autumn Budget task is increasingly looking near-impossible. Her options are: cut spending, raise taxes or alter the fiscal rules for a second year straight.
News & Views
Headline inflation in South Korea printed at 0.0% M/M, raising the headline measure to 2.2%, up from 1.9%. Core inflation was unchanged at 2%. In a broader perspective, the data suggest that inflation is on track to hold near the 2% target of the Bank of Korea (BoK). The BoK cut the policy rate to 2.5% in May. Governor Rhee attending the Sintra-ECB forum yesterday indicated that Bank of Korea remains concerned about the impact for the tariffs on growth rather than about inflation risks. This suggests that the easing cycle will likely continue later this year. However, aside from the activity/inflation balance, the BoK is also keeping a close eye a the financial stability risks as house prices and household debt are again rising, suggesting the need for a gradual approach to further easing.
Retail sales in Australia in May again continued the lackluster momentum that is already in place since the end of last year. Sales grew at a 0.2% below consensus (0.5%) pace after a stabilization in April. Coming on the back of softer than expected May labour market data and a faster than expected easing of the May monthly inflation measure (published last week at 2.1% from 2.4%) today’s data support the case for the Reserve bank of Australia to further reduce the policy rate at the upcoming meeting on Tuesday next week. The RBA policy rate currently stands at 3.85% after a second 25 bps rate cut in the current cycle at the May meeting. Despite the prospect for further easing, the Aussie dollar remains well bid against an overall weak US dollar with AUD/USD near 0.658 currently testing the strongest levels since November last year.
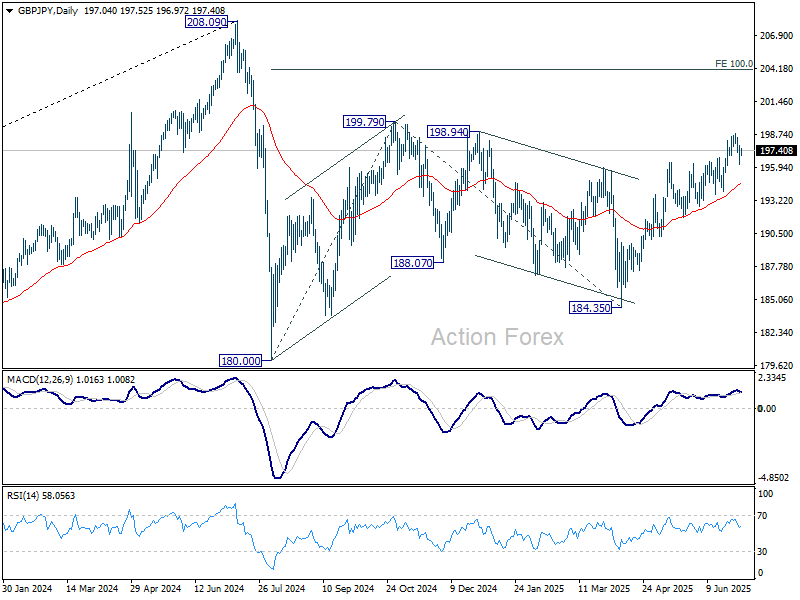
GBP/JPY Daily Outlook
Daily Pivots: (S1) 196.32; (P) 197.09; (R1) 197.90; More...
Intraday bias in GBP/JPY stays neutral as consolidations continues below 198.78. Near term outlook will stay bullish as long as 193.99 support holds. Above 198.78 will resume the rise from 184.35 to 199.79 resistance. Break there will target 100% projection of 180.00 to 199.79 from 184.35 at 204.14.
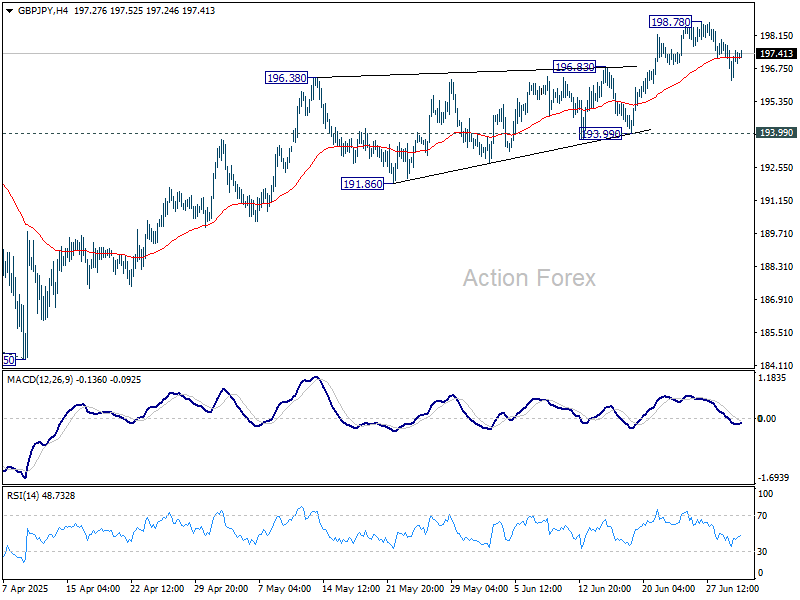
In the bigger picture, price actions from 208.09 are seen as a correction to rally from 123.94 (2020 low). Strong support should be seen from 38.2% retracement of 123.94 to 208.09 at 175.94 to contain downside. However, sustained break of 175.94 will bring deeper fall even still as a correction.
EUR/JPY Daily Outlook
Daily Pivots: (S1) 168.58; (P) 169.19; (R1) 169.93; More...
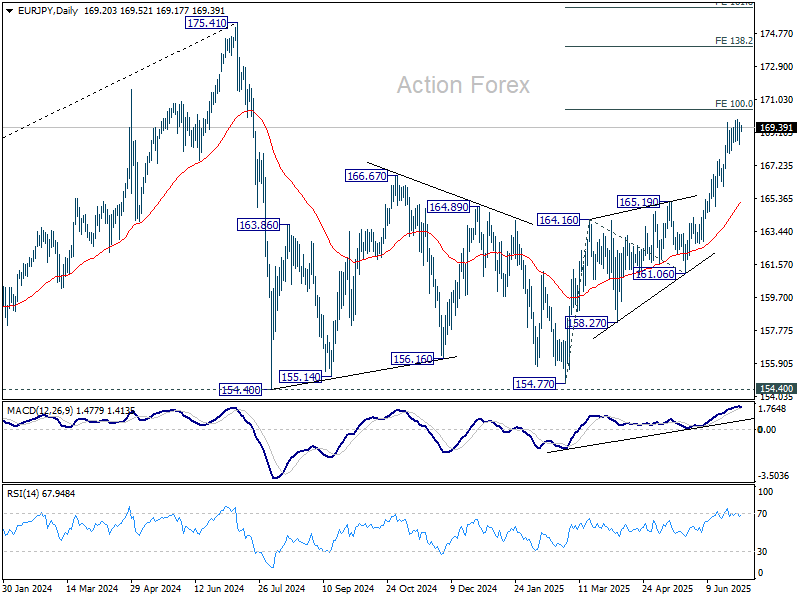
EUR/JPY staying in consolidations below 169.83 and intraday bias remains neutral. Deeper retreat might be seen but downside should be contained well above 166.01 support to bring another rally. Above 169.83 will resume the rise from 154.77 to 100% projection of 154.77 to 164.16 from 161.06 at 170.45. Break there will target 138.2% projection at 174.03.
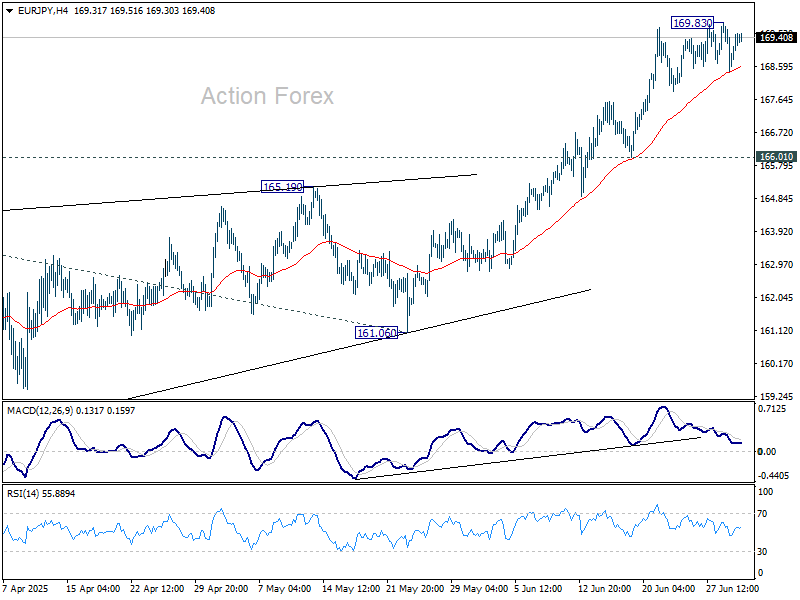
In the bigger picture, price actions from 175.41 are seen as correction to up trend from 114.42 (2020 low). Strong support should be seen from 38.2% retracement of 114.42 to 175.41 at 152.11 to contain downside. However, sustained break of 152.11 will bring deeper fall even still as a correction.
EUR/GBP Daily Outlook
Daily Pivots: (S1) 0.8565; (P) 0.8581; (R1) 0.8605; More...
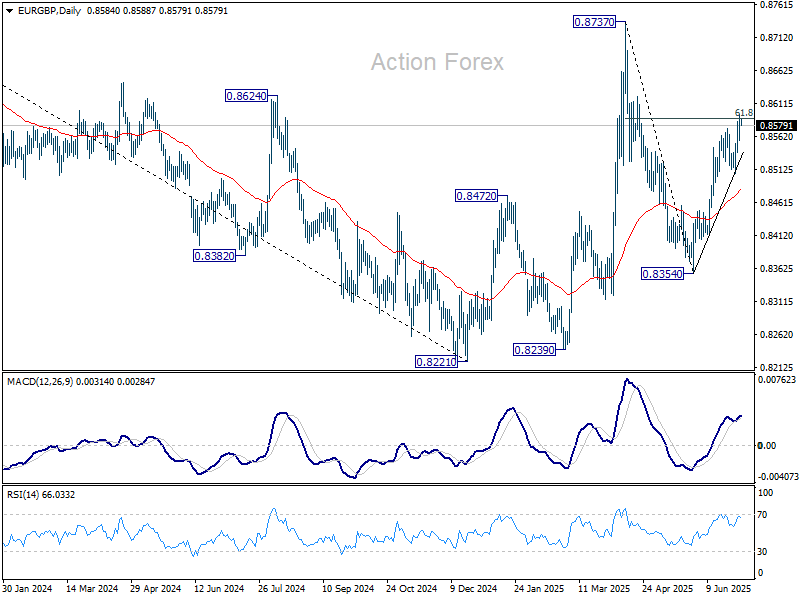
Intraday bias in EUR/GBP remains on the upside as rise from 0.8354 is in progress. Sustained trading above 61.8% retracement of 0.8737 to 0.8354 at 0.8591 will extend the rally from 0.8354 to 0.8737 high. However, firm break of 0.8506 support will suggest rejection by 0.8591, and turn bias back to the downside instead.
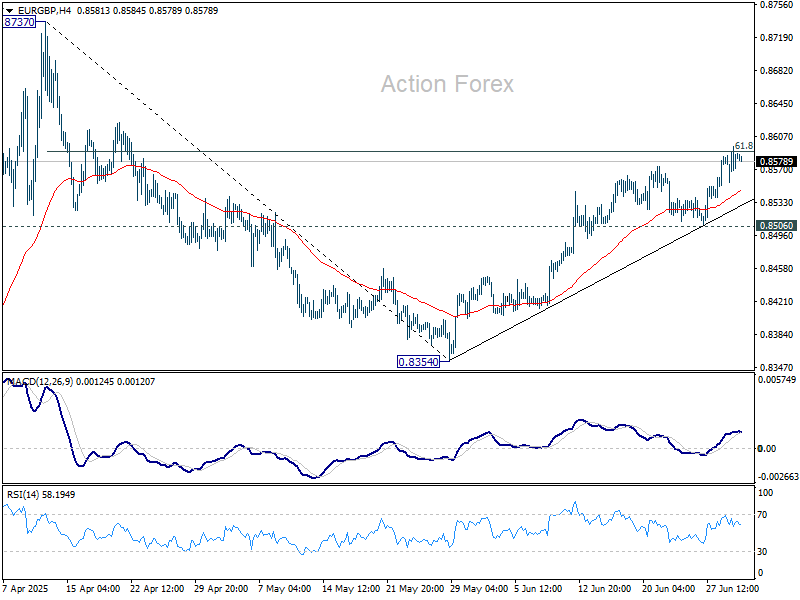
In the bigger picture, price actions from 0.8221 medium term bottom are seen as forming a corrective pattern to the down trend from 0.9267 (2022 high). Nevertheless, there is no clear momentum to break through 0.8201 key support (2022 low) yet. Hence, range trading is expected between 0.8221/8737 for now.
EUR/AUD Daily Outlook
Daily Pivots: (S1) 1.7889; (P) 1.7932; (R1) 1.7978; More...
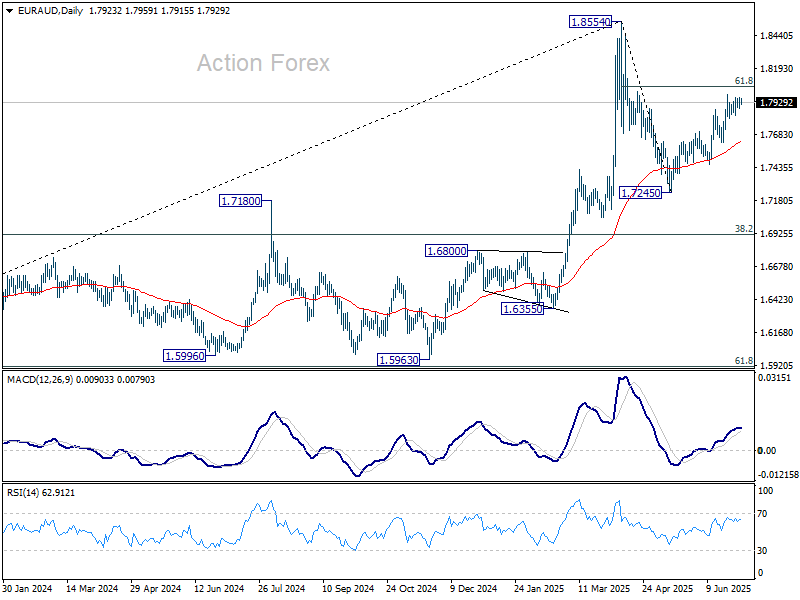
Intraday bias in EUR/AUD remains neutral as consolidations continue below 1.7989. Further rally is expected as long as 1.7626 support holds. Above 1.7989 will target 61.8% retracement of 1.8554 to 1.7245 at 1.8054. Sustained break there will pave the way to 1.8554.
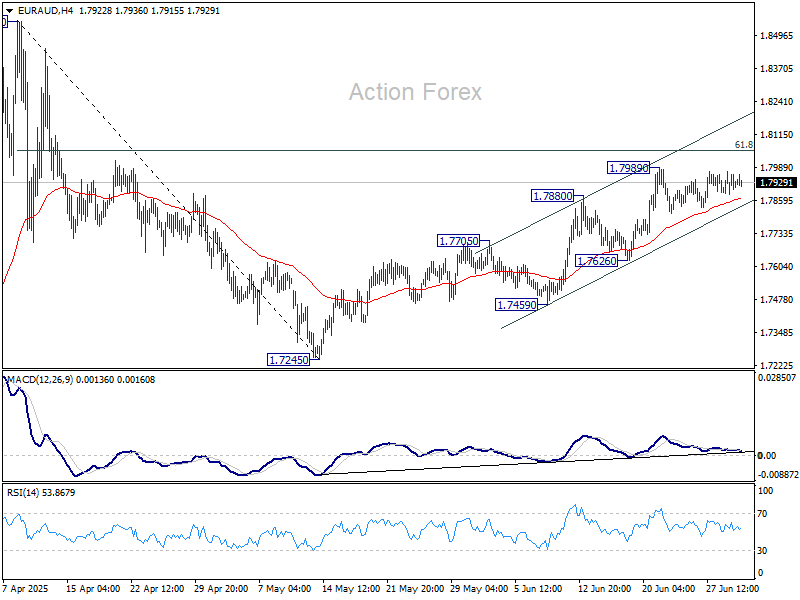
In the bigger picture, price actions from 1.8554 medium term are seen as a corrective pattern. While deeper pullback might be seen, downside should be contained by 38.2% retracement of 1.4281 (2022 low) to 1.8554 at 1.6922 to bring rebound. Up trend from 1.4281 is expected to resume at a later stage.
EUR/CHF Daily Outlook
Daily Pivots: (S1) 0.9314; (P) 0.9333; (R1) 0.9359; More....
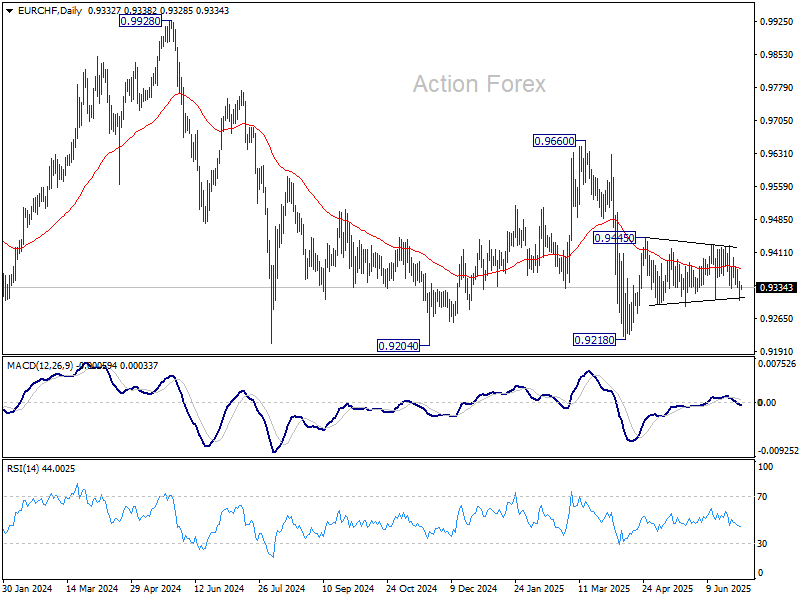
Intraday bias in EUR/CHF remains neutral first. On the downside, decisive break of 0.9306 support will turn bias to the downside for retesting 0.9218 low. On the upside, break of 0.9428/45 resistance zone will resume the rebound from 0.9218.
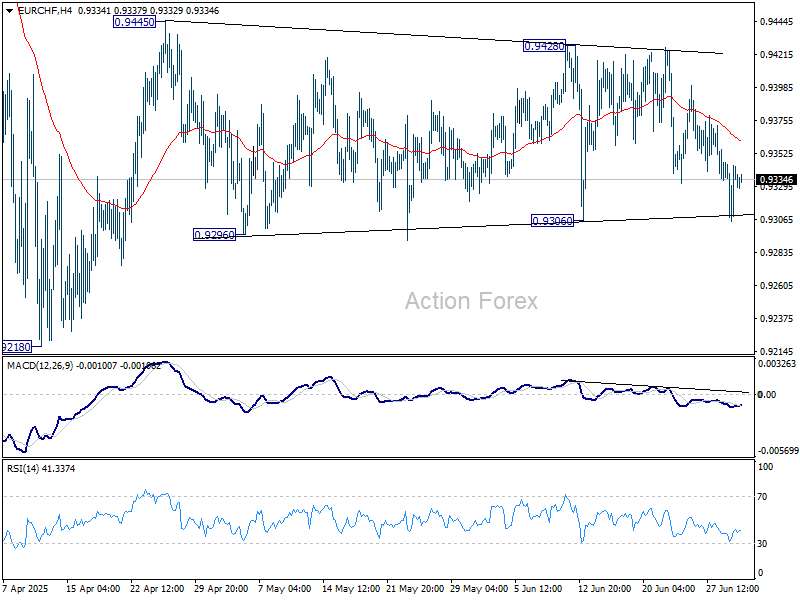
In the bigger picture, while downside momentum has been diminishing as seen in W MACD, there is no sign of bottoming yet. EUR/CHF is still staying below 55 W EMA and well inside long term falling channel. Outlook will stay bearish as long as 0.9660 resistance holds. Break of 0.9204 (2024 low) will confirm resumption of down trend from 1.2004 (2018 high).
From High Hopes to Hard Truths
Rally in most major indices across Europe and the US paused yesterday, as Trump-driven optimism began to sour under the rocky glare of the summer sun. Less-than-ideal news on both the trade and political fronts served as a sharp reminder that all is not rosy—that trade negotiations, and Trump’s friendships, can turn into onion soup faster than you can say ‘tariff’ or ‘DOGE.’
Japan is experiencing it big time. Trade negotiations appear to be stuck over Japan’s unwillingness to buy Uncle Sam’s rice. Tokyo now risks being slapped with 30–35% tariffs. Meanwhile, the EU seems willing to accept 10% tariffs in exchange for some exemptions—if that’s Trump’s will.
To top it off, yesterday’s US data did little to support those betting on an imminent Federal Reserve (Fed) rate cut. Most FOMC members still argue that cutting rates now would be a mistake, particularly as they expect inflation to rise due to tariffs in the coming months, and the labour market remains robust enough to wait. In fact, US job openings unexpectedly rose in May, the ISM Manufacturing Index showed slower contraction, and price pressures edged higher in June.
The combination of better-than-expected jobs and activity data with stronger-than-expected inflation reads like this in plain English: the Fed shouldn’t rush into rate cuts.
For now, the most reasonable scenario is that inflation will start to rise, and the data is pointing in that direction. That message is finally—if slowly—sinking in, even among some of the Fed doves. US 2-year yields rebounded after hitting the 3.70% mark, but the probability of a July cut, which looks increasingly unlikely, still stands at around 21% this morning. The base case remains two cuts from the Fed this year. That leaves room for a further hawkish adjustment, which could bring July cut expectations to zero and two-cut expectations to one. That, in turn, should push the 2-year yield higher and slow - or reverse - the equity rally heading into the earnings season.
Today, investors are focused on the US ADP employment report. The US is expected to have added 99,000 new nonfarm jobs in June. A weaker-than-expected figure could offer short-term support to the Fed doves, though arguably it shouldn’t. A stronger-than-expected print, on the other hand, could further demoralize the dovish camp and accelerate the long-overdue hawkish repricing in Fed expectations. And the bigger the gap between expectations and reality, the more violent the correction, and the sharper the potential selloff.
Other red flags
- US equity valuations have risen while earnings growth expectations are trending lower. While this may set the bar lower for beats, and the weaker US dollar could boost USD-denominated earnings, markets seem to be overlooking the risk that trade chaos may have caused deeper disruption to supply chains and production lines.
- US debt. Trump’s latest tax bill just scraped through the Senate with one vote and now heads to the House. It comes with a $3 trillion price tag—set to be financed on the backs of the bottom 20% losing benefits like Medicaid.
The more risks we sweep under the rug—and the wider the gap between valuations and fair value—the greater the size of a potential correction. And while seasoned traders know that markets rebound eventually, a big enough selloff could trigger margin calls and forced liquidations, leading to realized losses. In short, the risk of a selloff remains very real.
In individual stock news: Things got spicy. Tesla dropped more than 5% yesterday after Elon Musk criticized climate subsidies and publicly clashed with Trump, perhaps forgetting that while he may be an ex-friend, Trump is also the President. Trump fired back, claiming Tesla wouldn’t exist without subsidies and is reportedly reviewing Musk’s immigration status (he’s originally from South Africa and now a naturalized US citizen). It’s absurd on many levels—but also, sadly, not surprising.
As I’ve said before: Buying Tesla for Musk has never been a sound investment thesis. His souring relations with the White House could also hit Tesla’s robotaxi ambitions, as these depend on regulatory flexibility—something the administration may be less willing to offer in a political spat.
Meanwhile, competitors like BYD are capitalizing. The Chinese EV maker posted its best month of car sales this year, pushing H1 volumes past 2 million. BYD’s stock is hovering just below its 100-DMA, and the PE ratio stands at 21. The company remains a compelling addition to a globally diversified equity portfolio.
EUR/USD Daily Outlook
Daily Pivots: (S1) 1.1768; (P) 1.1799; (R1) 1.1837; More...
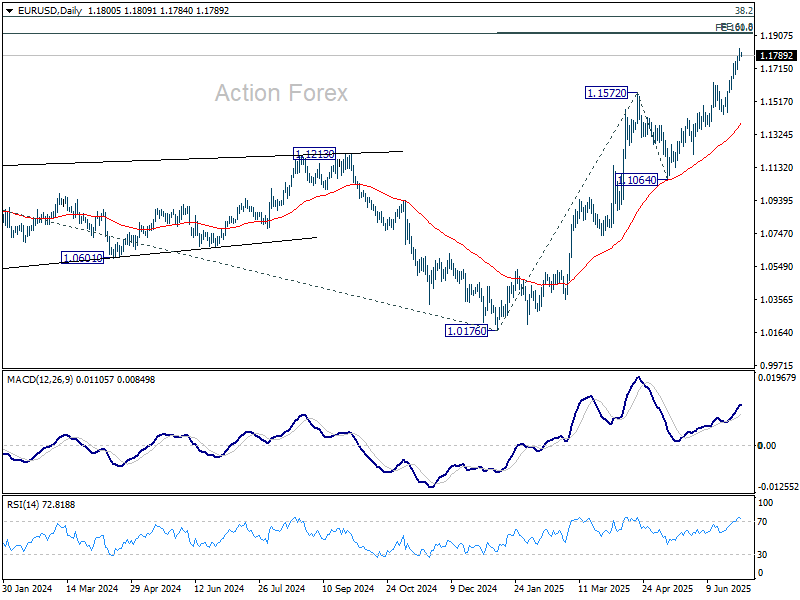
Intraday bias stays in EUR/USD on the upside for 61.8% projection of 1.0176 to 1.1572 from 1.1064 at 1.1927. On the downside, below 1.1709 minor support will turn intraday bias neutral and bring consolidations. But downside should be contained above 1.1452 support to bring another rally.
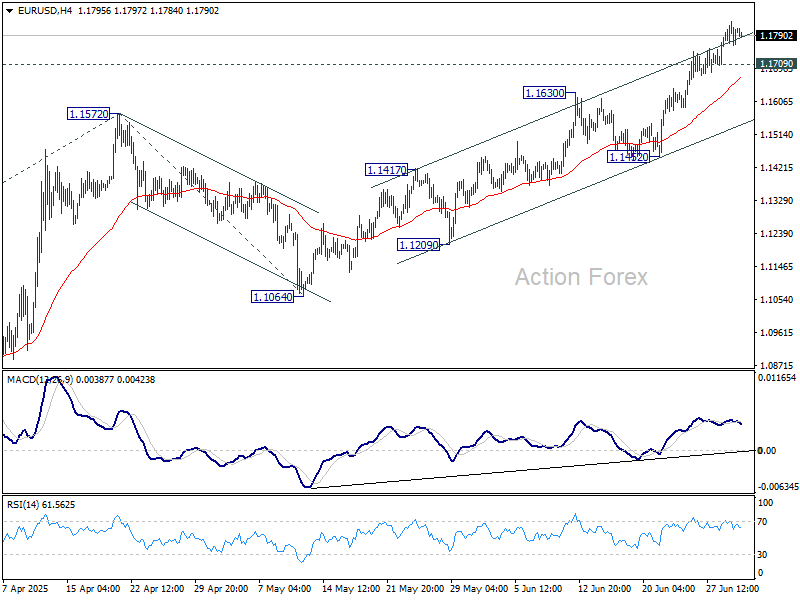
In the bigger picture, rise from 0.9534 long term bottom could be correcting the multi-decade downtrend or the start of a long term up trend. In either case, further rise should be seen to 100% projection of 0.9534 to 1.1274 from 1.0176 at 1.1916. This will now remain the favored case as long as 1.1604 support holds.
USD/JPY Daily Outlook
Daily Pivots: (S1) 142.64; (P) 143.45; (R1) 144.23; More...
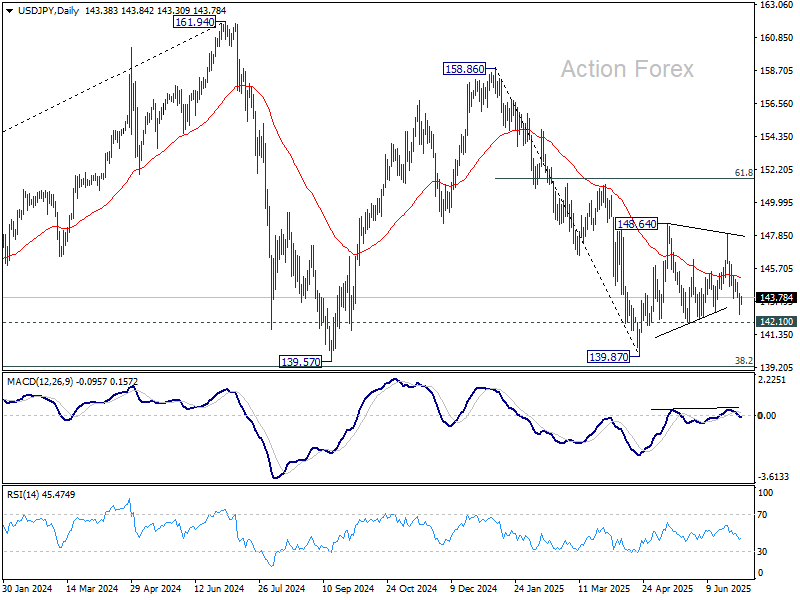
USD/JPY is still bounded in range of 142.10/148.01 and intraday bias stays neutral. On the upside, firm break of 148.01 resistance will resume the rise from 139.87 to 61.8% retracement of 158.86 to 139.87 at 151.22. However, break of 142.10 will bring deeper fall back to retest 139.87 low.
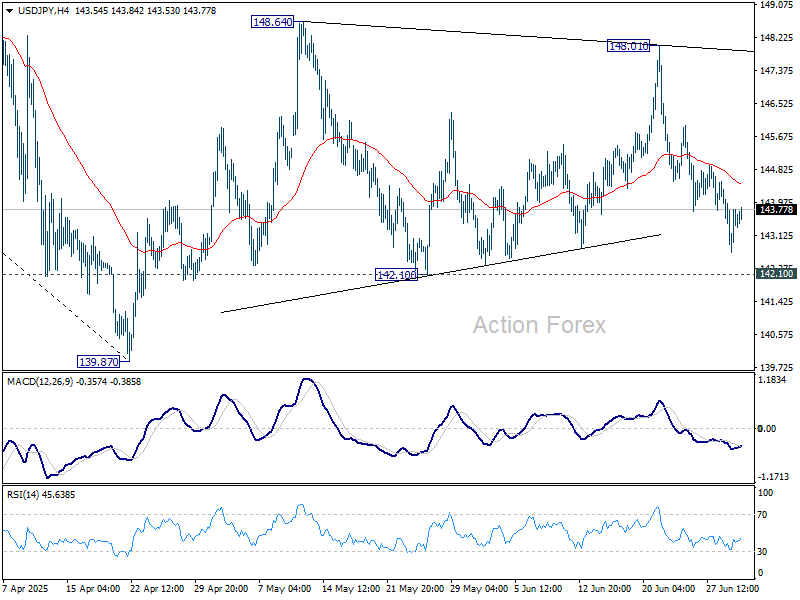
In the bigger picture, price actions from 161.94 are seen as a corrective pattern to rise from 102.58 (2021 low), with fall from 158.86 as the third leg. Strong support should be seen from 38.2% retracement of 102.58 to 161.94 at 139.26 to bring rebound. However, sustained break of 139.26 would open up deeper medium term decline to 61.8% retracement at 125.25.
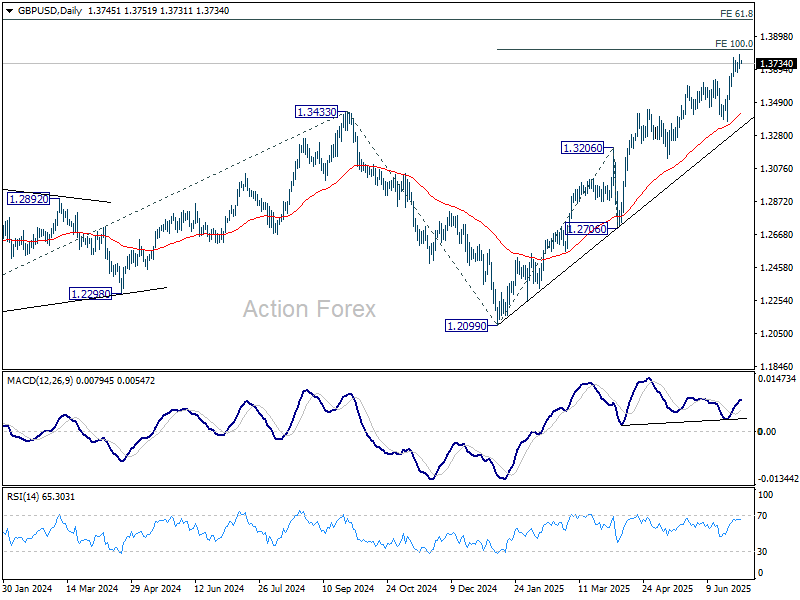
GBP/USD Daily Outlook
Daily Pivots: (S1) 1.3704; (P) 1.3746; (R1) 1.3789; More...
Intraday bias in GBP/USD stays mildly on the upside for 100% projection of 1.2099 to 1.3206 from 1.3138 at 1.3813. Firm break there will target 1.4004 projection level next. On the downside, below 1.3673 will turn intraday bias neutral again. But retreat should be contained above 1.3369 support to bring another rally.
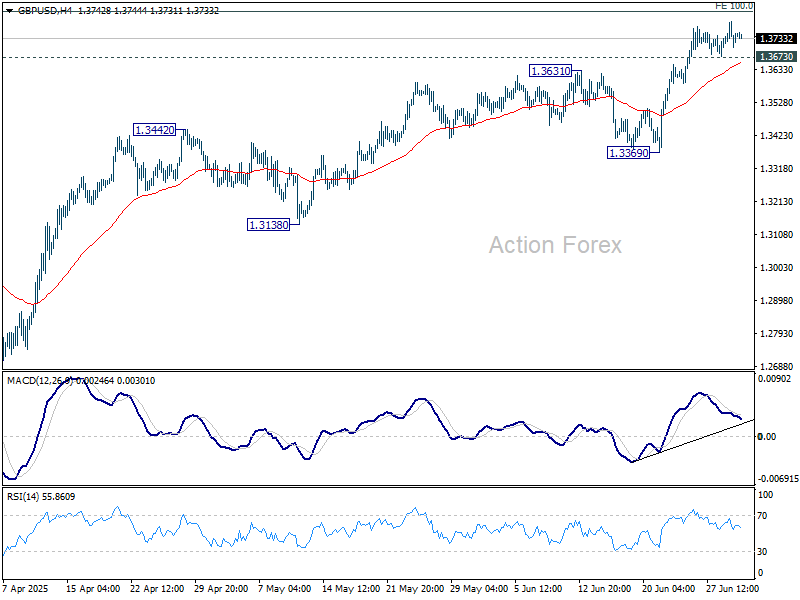
In the bigger picture, up trend from 1.3051 (2022 low) is in progress. Next medium term target is 61.8% projection of 1.0351 to 1.3433 from 1.2099 at 1.4004. Outlook will now stay bullish as long as 55 W EMA (now at 1.2960) holds, even in case of deep pullback.