
Sample Category Title
Sunset Market Commentary
Markets
Today was expected to bring market interludium with investors looking forward to the key US payrolls report to be released tomorrow, the One Big Beautifull Bill Act (OBBBA) now being debated for approval in the US House of Congress and first trade agreements between the US and trading partners expected/hoped of to be struck before the July 9 deadline. However trading wasn’t as quite as one could have expected. The approval of the OBBBA in the Senate (admittedly with the thinnest majority possible), after recent bond rally apparently was a good reason for markets to again give some bigger weight to the rising probability of big unsustainable US deficit spending and even higher debt ratios. At the start of US dealings, US ST yields briefly dropped as the ADP job report indicated that the US private sector in June lost 33k jobs, the first negative reading since July 2020. The report temporarily made markets reconsider when the Fed would be able/forced to resume its easing cycle. However, the decline in yields was limited and short-lived. US yields are currently rising between 0.5 bps (2-y) and 7.0 bps (30-y). The German curve follows this broader move with yields rising between 1.5 bp (2-y) and +8.0 bps (30-y; 10-y +9.0 bps includes a benchmark change). Some dovish ECB members (Rehn, Centeno) mentioned the risk of inflation undershooting the target, but for now a wait-and-see approach remains the preferred line of communication. On FX markets, the euro this time doesn’t profit from the softer than expected ADP. ECB comments on a (too) fast rise of the single currency maybe caused a short-term breather on the recent EUR/USD rally. Even so, we still see few reason for a U-turn in the overall USD decline of the dollar (EUR/USD currently near 1.177). DXY also rebounds slightly but just below 97, the technical picture remains fragile going into tomorrow’s payrolls report.
Drama and tears in the UK House of Commons and on UK (bond & FX) markets. UK yields are jumping between 6 bps (2-y) and 20+ bps (30-y) as speculation is growing whether UK Chancellor of the Exchequer will be able to politically survive after the government scrapped deficit-reducing welfare spending cuts, making it impossible for the UK Chancellor to meet her self-imposed budget rules. It also consumes the room for an active growth supportive policy. At the Prime Minister’s questions in Parliament this afternoon, Starmer initially failed to explicitly support his Chancellor, who clearly turned emotional. Whatever her political fate, current developments are a high profile reminder of the fragility of UK public finances, even with some (market) reminiscences to the September 2022 Truss-Kwarteng bond sell-off. Sterling also shows ‘emotional weakness’ with EUR/GBP surpassing the 0.8650 area.
News & Views
Head of the IMF’s European Department Alfred Kammer said the ECB should keep its main policy rate at the current 2% unless new shocks materially change the inflation outlook. Kammer said they are not seeing anything of such magnitude. What they do see instead are two-sided inflation risks, which warrants a cautious monetary approach. They also expect price pressures to be stronger next year than the ECB (1.9% vs 1.6%), in part due to a different view on energy prices. The IMF view contrasts with that of the market, which expects one more cut to 1.75% by the end of the year.
The recently appointed Hungarian central bank (MNB) vice governor Zoltan Kurali was clear as crystal in an interview with news agency Reuters: as long as inflation exceeds the MNB’s tolerance band (3% + 1ppt), rate cuts are off the table. That hasn’t been the case since December 2024 and isn’t pencilled in in the June forecast for all of 2025 either. And even if it would in the near term, for example due to government price caps on food and forcing other sectors including telecom to forego planned fee hikes, Kurali said that there needs to be a sustained – not a single – return towards the 3% midpoint target. Evidence from earlier such caps furthermore suggests that it hits like a boomerang when companies are allowed to adjust prices again. Kurali blamed elevated inflation expectations for price pressures being too strong despite the economy stagnating. A relatively stable forint in the past few weeks should dampen inflation and inflation expectations, he added. EUR/HUF recently returned sub 400 for the first time since March.
EUR/USD Mid-Day Outlook
Daily Pivots: (S1) 1.1768; (P) 1.1799; (R1) 1.1837; More...
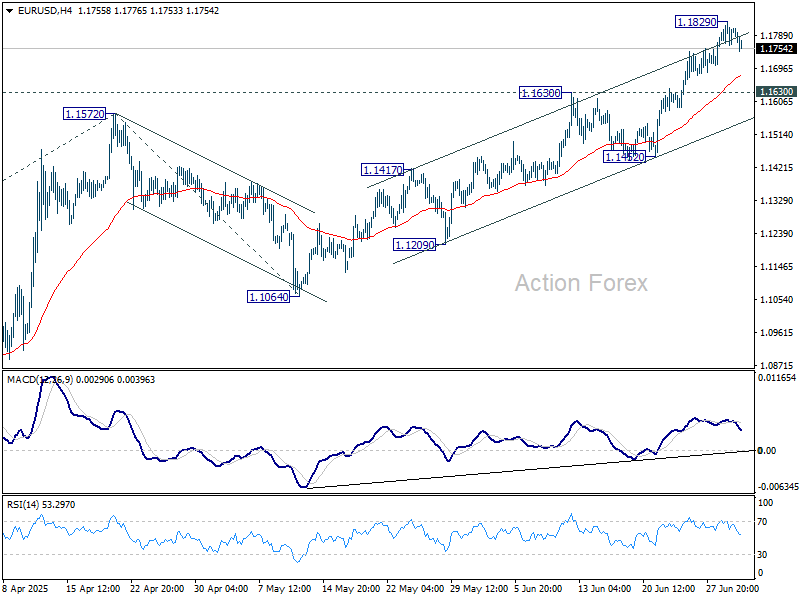
Intraday bias in EUR/USD is turned neutral with current retreat, and some consolidations could be seen below 1.1829 temporary top. Downside of retreat should be contained by 1.1630 resistance turned support to bring another rally. On the upside, break of 1.1829 will target 61.8% projection of 1.0176 to 1.1572 from 1.1064 at 1.1927.
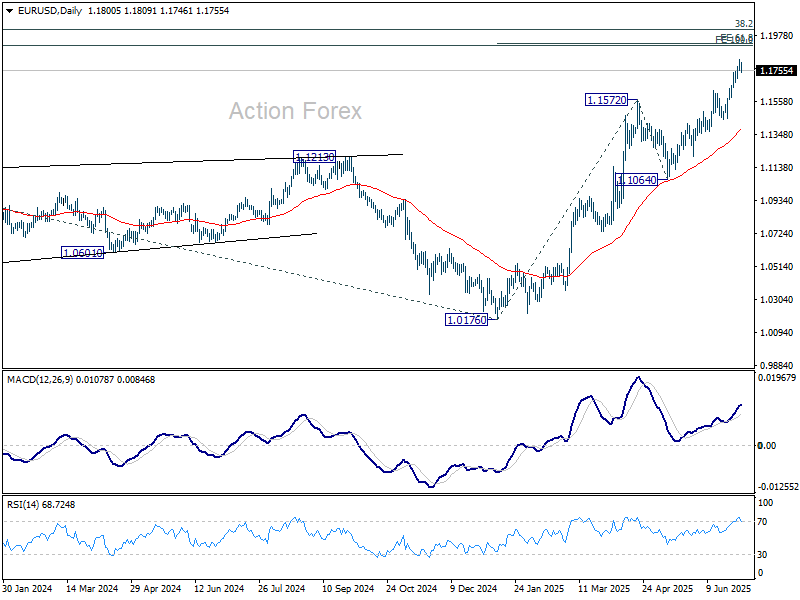
In the bigger picture, rise from 0.9534 long term bottom could be correcting the multi-decade downtrend or the start of a long term up trend. In either case, further rise should be seen to 100% projection of 0.9534 to 1.1274 from 1.0176 at 1.1916. This will now remain the favored case as long as 1.1604 support holds.
GBP/USD Mid-Day Outlook
Daily Pivots: (S1) 1.3704; (P) 1.3746; (R1) 1.3789; More...
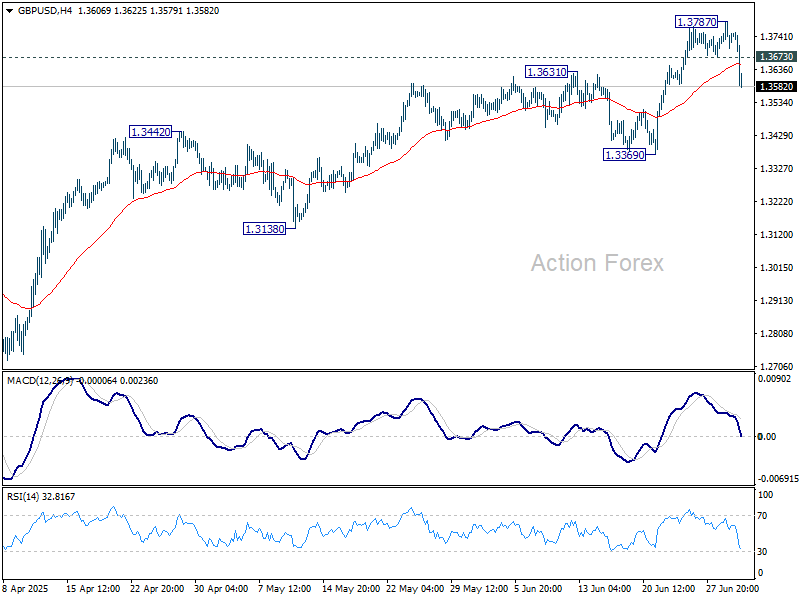
A temporary top is formed at 1.3787 in GBP/USD with break of 1.3673 minor support. Intraday bias is turned neutral for consolidations. But downside should be contained above 1.3369 support to bring another rally. Firm break of 1.3787 will resume larger rise to 1.4004 projection level next.
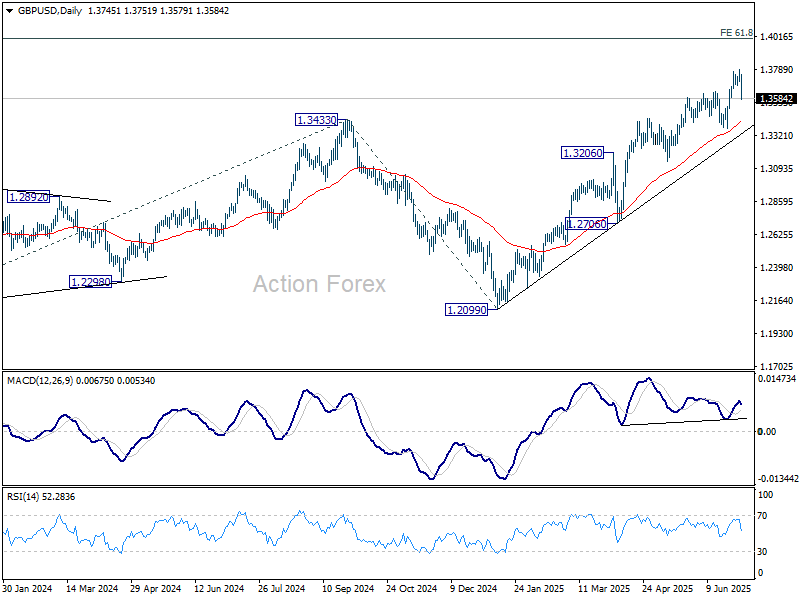
In the bigger picture, up trend from 1.3051 (2022 low) is in progress. Next medium term target is 61.8% projection of 1.0351 to 1.3433 from 1.2099 at 1.4004. Outlook will now stay bullish as long as 55 W EMA (now at 1.2983) holds, even in case of deep pullback.
USD/CHF Mid-Day Outlook
Daily Pivots: (S1) 0.7876; (P) 0.7910; (R1) 0.7947; More….
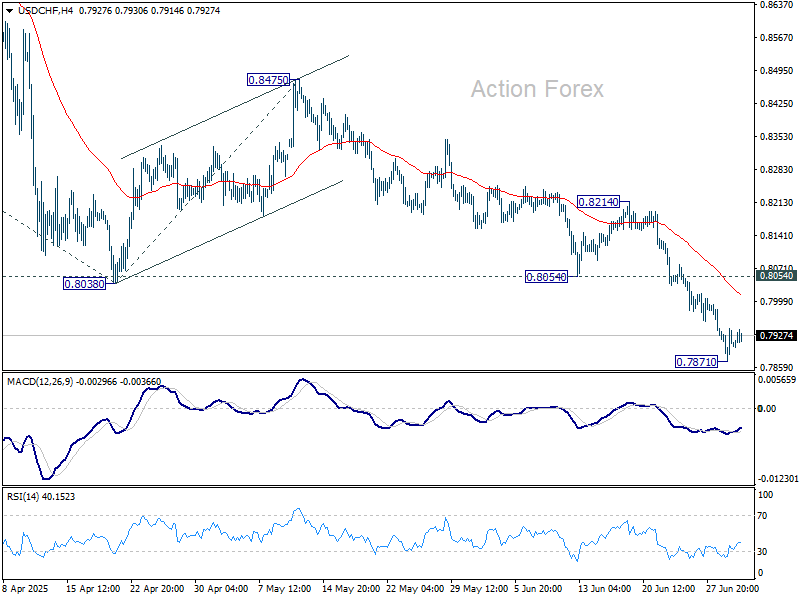
Intraday bias in USD/CHF is turned neutral with current recovery, and some consolidations could be seen. But recovery should be limited by 0.8054 support turned resistance to bring another fall. Below 0.7871 will extend the larger down trend to 61.8% projection of 0.9200 to 0.8038 from 0.8475 at 0.7757. Firm break there will pave the way to 100% projection at 0.7313 next.
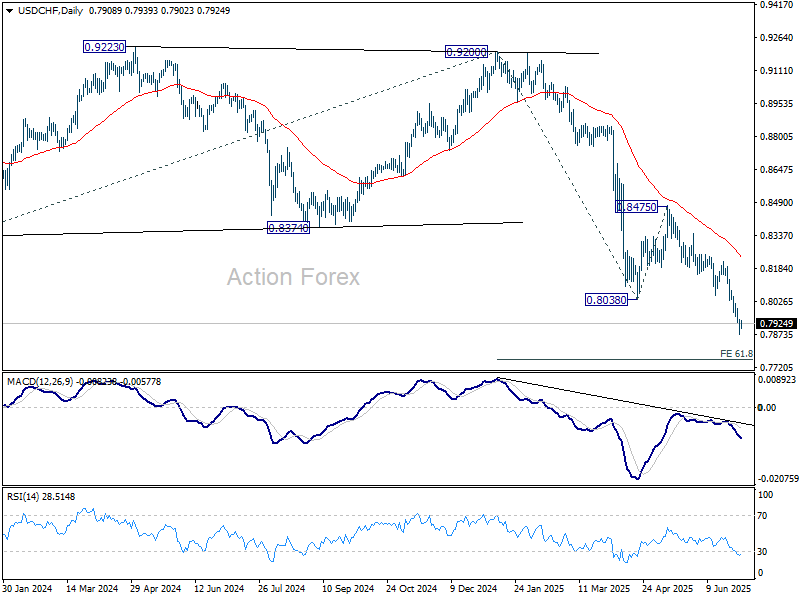
In the bigger picture, long term down trend from 1.0342 (2017 high) is still in progress. Next target is 100% projection of 1.0146 (2022 high) to 0.8332 from 0.9200 at 0.7382. In any case, outlook will stay bearish as long as 0.8475 resistance holds.
USD/JPY Mid-Day Outlook
Daily Pivots: (S1) 142.64; (P) 143.45; (R1) 144.23; More...
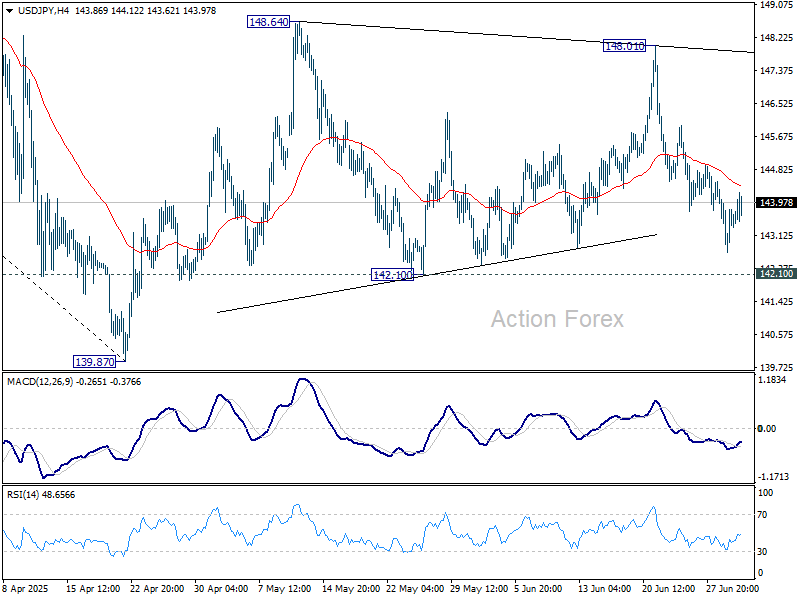
Intraday bias in USD/JPY remains neutral as range trading continues. On the upside, firm break of 148.01 resistance will resume the rise from 139.87 to 61.8% retracement of 158.86 to 139.87 at 151.22. However, break of 142.10 will bring deeper fall back to retest 139.87 low.
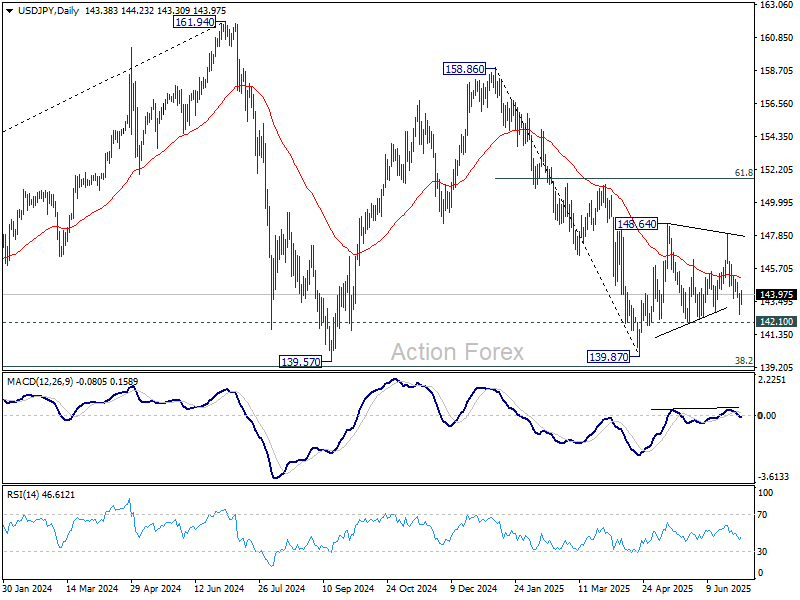
In the bigger picture, price actions from 161.94 are seen as a corrective pattern to rise from 102.58 (2021 low), with fall from 158.86 as the third leg. Strong support should be seen from 38.2% retracement of 102.58 to 161.94 at 139.26 to bring rebound. However, sustained break of 139.26 would open up deeper medium term decline to 61.8% retracement at 125.25.
EUR/GBP Mid-Day Outlook
Daily Pivots: (S1) 0.8565; (P) 0.8581; (R1) 0.8605; More...
EUR/GBP's rally from 0.8354 accelerated higher today and powered through 61.8% retracement of 0.8737 to 0.8354 at 0.8591. Intraday bias stays on the upside for retest 0.8737 high. Decisive break there will resume the whole rise from 0.8221 low. On the downside, below 0.8576 minor support will turn intraday bias neutral first.
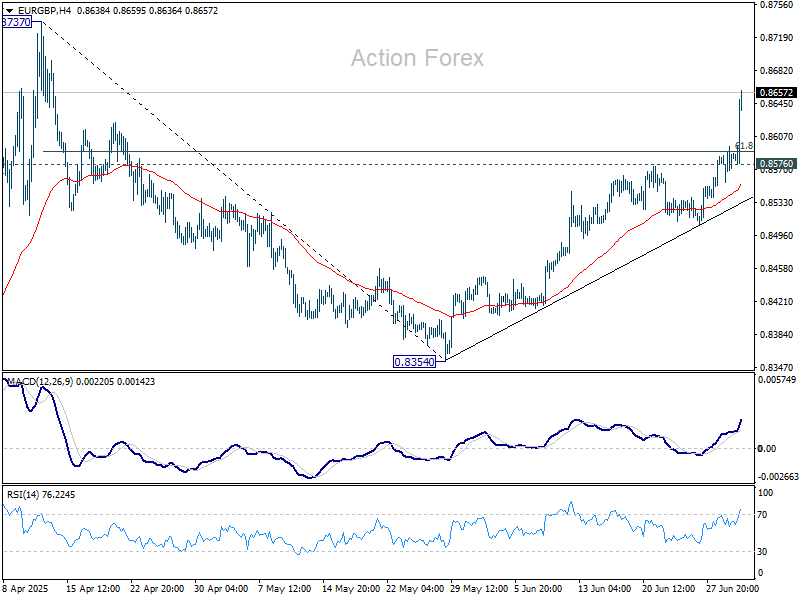
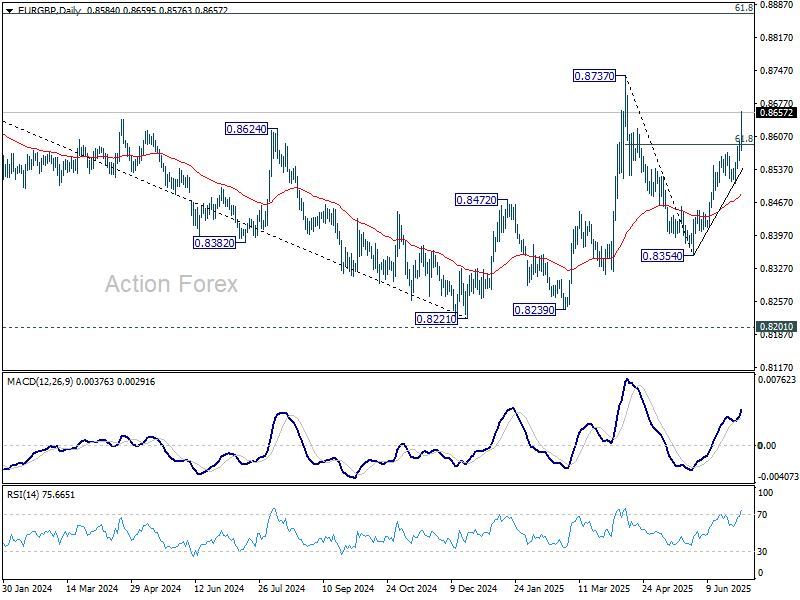
In the bigger picture, the structure from 0.8221 medium term bottom are not impulsive enough to suggest that it's reversing the downside from 0.9267 (2022 high). But even if it's a correction, firm break of 0.8737 will still pave the way to 61.8% retracement of 0.9267 to 0.8221 at 0.8867.
Sterling Plunges as Gilt Yields Surge Amid UK Political Turmoil
Sterling came under heavy pressure today, tumbling sharply alongside a selloff in UK government bonds. The 10-year gilt yield surged above 4.65%, up 20 basis points from levels seen just two days ago. The moves came after Prime Minister Keir Starmer’s government backtracked on key parts of its welfare bill to avoid a major Labour rebellion. The retreat may have salvaged the vote, but came at the cost of credibility. More importantly. uncertainty is also swirling around Finance Minister Rachel Reeves, after Starmer failed to affirm her job security during a heated parliamentary exchange today.
Meanwhile, from the US came a shock downturn in ADP employment, which posted a -33k print for June — the first monthly contraction since early 2022. The data has cast a shadow over Thursday’s non-farm payrolls, with markets now bracing for possible downside risks to the labor market. While July remains unlikely for Fed to resume cutting rates, further downside surprises in job creation or wage growth would likely make the FOMC’s decision a much tighter call.
Overall in the currency markets today, Sterling is by far the weakest major while Kiwi and Aussie are also under pressure, pointing to a broader risk-off tilt in markets. Euro and Yen are trading in the middle of the pack. Dollar is currently the strongest, recovery from its near term losses. Loonie and Swiss Franc follow.
Technically, with the strong break through 61.8% retracement of 1.0610 to 1.1200 at 1.0835 today, GBP/CHF is now on track to retest 1.0610 low. Further downside acceleration would raise the chance that it's actually resuming whole down trend from 1.1675 (2024 high). In any case, near term outlook will now stay bearish as long as 1.0930 support turned resistance holds.

In Europe, at the time of writing, FTSE is down -0.45%. DAX is down -0.05%. CAC is up 0.79%. UK 10-year yield is up 0.189 at 4.647. Germany 10-year yield is up 0.039 at 2.614. Earlier in Asia, Nikkei fell -0.56%. Hong Kong HSI rose 0.62%. China Shanghai SSE fell -0.09%. Singapore Strait Times rose 0.53%. Japan 10-year JGB yield rose 0.04 to 1.432.
US ADP shock, private payrolls drop -33k in June
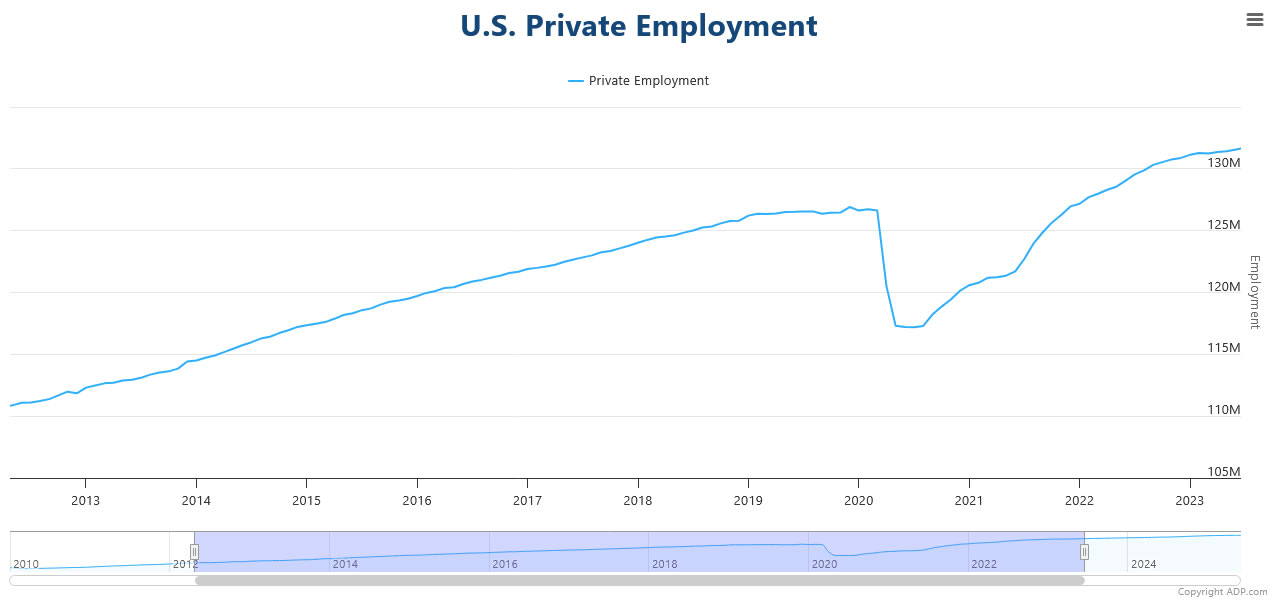
US private sector employment unexpectedly declined by -33k in June, according to ADP data, far below expectations for a 105k gain.
The weakness was concentrated in service-providing industries, which shed -66k jobs, while goods-producing sectors added 32k. Small businesses were hit the hardest, cutting -47k positions, while medium companies lost -15k, large firms added 30,000.
ADP Chief Economist Nela Richardson noted that while layoffs remain rare, firms are increasingly hesitant to hire or replace departing staff. “A hesitancy to hire and a reluctance to replace departing workers led to job losses last month,” she said.
Despite the hiring slowdown, wage growth remained relatively stable. Job-stayers saw annual pay increases of 4.4% yoy in June, just slightly below May’s 4.5% yoy. For job-changers, pay growth slipped to 6.8% yoy from 7.0% yoy, suggesting firms are still offering premiums for switching jobs, though at a moderating pace.
BoE’s Taylor backs steeper rate cuts as outlook deteriorates
BoE MPC member Alan Taylor warned today that the UK economy faces mounting risks to a soft landing, citing growing demand weakness and trade disruptions. In a speech, Taylor said his earlier forecast for a gradual disinflation and stable growth path is now at risk of being derailed in 2026.
“My reading of the deteriorating outlook suggested to me that we needed to be on a lower rate path, needing five cuts in 2025 rather than the market-implied quarterly pace of four,” Taylor said, citing recent shocks and global uncertainty that clouded his earlier view.
Taylor, who has consistently pushed for more aggressive easing, has voted for cuts in five of seven MPC meetings since joining last September—including a 50bps move in May followed by 25bps in June.
ECB's Rehn warns of inflation undershoot risk, urges vigilance
Finnish ECB Governing Council member Olli Rehn warned that the Eurozone faces renewed risks of inflation falling below the 2% target as global uncertainties intensify. While acknowledging that risks to the outlook exist on both sides, Rehn said the downside appears more pressing. “The risk of staying below target is greater in my view, especially as our projections see price growth under target for 18 months,” he noted.
Rehn pointed to a trio of disinflationary forces — a strong Euro, lower energy prices, and rising tariffs — which he argued are weighing on both inflation and growth. “We need to be mindful of the risk of inflation staying persistently below 2%,” he said.
ECB’s Wunsch sees case for mild supportive stance as downside risks dominate
Belgian ECB Governing Council member Pierre Wunsch said the central bank may need a “mildly supportive” stance, especially if Eurozone recovery continues to lag. In an interview with Reuters, Wunsch noted “If the recovery is delayed — and it has been delayed a few times — and output is below potential, then being supportive is rational,” he said.
Wunsch highlighted several disinflationary forces at play, including lower energy prices, the strength of Euro, subdued wage growth, and the lack of tariff retaliation. He also flagged cheap Chinese imports as a contributing factor to weakening price pressures. “All these factors combined suggest that the upside risk is limited and the overall risk is to the downside,” he added.
With markets pricing in one final 25 basis point cut later this year, bringing the deposit rate to 1.75%, Wunsch said he was not uncomfortable with that view. “I don’t disagree with market pricing for interest rates,” he noted.
ECB's Centeno: Must wait for more data before next move
Portuguese ECB Governing Council member Mario Centeno welcomed the return of Eurozone inflation to the 2% target, calling it "very good news." However, he also stressed that the ECB remains focused on assessing incoming data.
Centeno told Bloomberg TV that the ECB is “monitoring all possible numbers” and assessing various aspects of the Eurozone’s 20-member economy. “The current situation doesn’t mean that we need to rush into more interest-rate reductions,” he said. "We need to see data, we need to see the developments."
Eurozone unemployment unexpectedly rises to 6.3% in May
Eurozone unemployment rate edged higher to 6.3% in May, missing expectations for an unchanged reading at 6.2%. Eurostat data showed 10.83m people unemployed in the Eurozone, part of a total 13.05m across the EU.
The broader EU jobless rate held steady at 5.9%, but the number of unemployed rose by 54k in the Eurozone and by 48k in the EU compared to April.
Aussie retail sales underwhelm with 0.2% mom growth in May
Australia’s retail sales rose just 0.2% mom in May, falling short of expectations for a 0.3% rise. The modest increase was largely due to a rebound in clothing purchases, while spending on food fell and household goods remained flat.
Robert Ewing, ABS head of business statistics, noted that aside from the lift in clothing, retail spending was generally "restrained".
He also noted that this dataset is nearing its conclusion, with July’s release set to be the last edition of Retail Trade. Going forward, the Monthly Household Spending Indicator (MHSI), which leverages administrative data, will replace it as a more comprehensive tool for tracking household consumption trends.
EUR/GBP Mid-Day Outlook
Daily Pivots: (S1) 0.8565; (P) 0.8581; (R1) 0.8605; More...
EUR/GBP's rally from 0.8354 accelerated higher today and powered through 61.8% retracement of 0.8737 to 0.8354 at 0.8591. Intraday bias stays on the upside for retest 0.8737 high. Decisive break there will resume the whole rise from 0.8221 low. On the downside, below 0.8576 minor support will turn intraday bias neutral first.
In the bigger picture, the structure from 0.8221 medium term bottom are not impulsive enough to suggest that it's reversing the downside from 0.9267 (2022 high). But even if it's a correction, firm break of 0.8737 will still pave the way to 61.8% retracement of 0.9267 to 0.8221 at 0.8867.
US ADP shock, private payrolls drop -33k in June
US private sector employment unexpectedly declined by -33k in June, according to ADP data, far below expectations for a 105k gain.
The weakness was concentrated in service-providing industries, which shed -66k jobs, while goods-producing sectors added 32k. Small businesses were hit the hardest, cutting -47k positions, while medium companies lost -15k, large firms added 30,000.
ADP Chief Economist Nela Richardson noted that while layoffs remain rare, firms are increasingly hesitant to hire or replace departing staff. “A hesitancy to hire and a reluctance to replace departing workers led to job losses last month,” she said.
Despite the hiring slowdown, wage growth remained relatively stable. Job-stayers saw annual pay increases of 4.4% yoy in June, just slightly below May’s 4.5% yoy. For job-changers, pay growth slipped to 6.8% yoy from 7.0% yoy, suggesting firms are still offering premiums for switching jobs, though at a moderating pace.
DOLLAR INDEX: Bears Consolidate Above Multi-Month Low as Markets Await Key US Labor Reports
The dollar index edged higher from new 3 ½ low on Wednesday, after US JOLTS report surprise jump brightened near term outlook and prompted a partial profit taking
Bounce was so far limited as the dollar remains pressured by uncertainty over President Trump’s massive tax and spending bill (worth $3.3 trillion) which was passed by Senate and needs approval from the House.
On the other hand, Fed Chair Powell reiterated the central bank’s dovish stance (remaining in seat and wait mode to estimate negative impact from US tariffs on inflation and economy) that provides some support to the greenback.
However, the US dollar showed the worst performance in the first six months of 2025 in the decades, impacted by high global uncertainty, de-dollarization process and other factors that prompted traders out of dollar.
More shockwaves are still to be expected as Trump’s tariff deadline ends on July 9 (likely no further extension, according to Trump) with many cases being still open (Japan, India, EU) and threatening of escalation in case of no deal reached in coming days.
Also, persisting conflict between President Trump, who requires the Fed to significantly reduce borrowing cost and provide better environment for investments that would boost economic growth and Fed Chair Powell who resists to follow Trump’s advice, arguing by growing concerns that impact from tariffs would boost inflation this summer, adds to unclear outlook for the US currency.
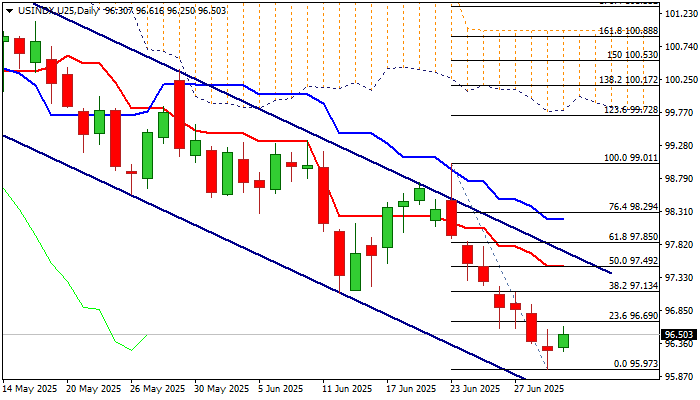
Technical picture on daily chart remains bearish as the price action is weighed by thick daily Ichimoku cloud, daily Tenkan/Kijun-sen in bearish setup and negative momentum.
Also, the price holds near the lower boundary of a bear-channel from 101.80 (May 12 top), that keeps near-term risk shifted to the downside.
Recovery attempts should be ideally capped under 97.50 zone (50% retracement of 99.01/95.97 bear-leg / daily Tenkan-sen / near the upper boundary of bear-channel) to keep larger bears intact.
Renewed attack at new multi-month low (95.97) would generate initial signal of bearish continuation and expose target at 95.18 (Fibo 76.4% of 89.15/114.72, 2021/2022 uptrend).
On the other hand, violation of 97.50 resistance zone would sideline immediate bears and unmask upper triggers at 97.85 (Fibo 61.8%) and 98.18 (daily Kijun-sen).
Res: 96.69; 97.13; 97.50; 97.85
Sup: 96.25; 95.97; 95.18; 94.59
Bitcoin Absorbing Cash Coming to Crypto
Bitcoin is absorbing most of the cash coming into the digital asset market. Its share in the cryptocurrency market structure increased by 10 percentage points to 65% in the first half of 2025. This is the highest it’s been since January 2021. In contrast the capitalisation of altcoins has fallen by $300 billion since the beginning of this year. Thanks to developed infrastructure, support from the White House and regulation, larger tokens are displacing smaller competitors.
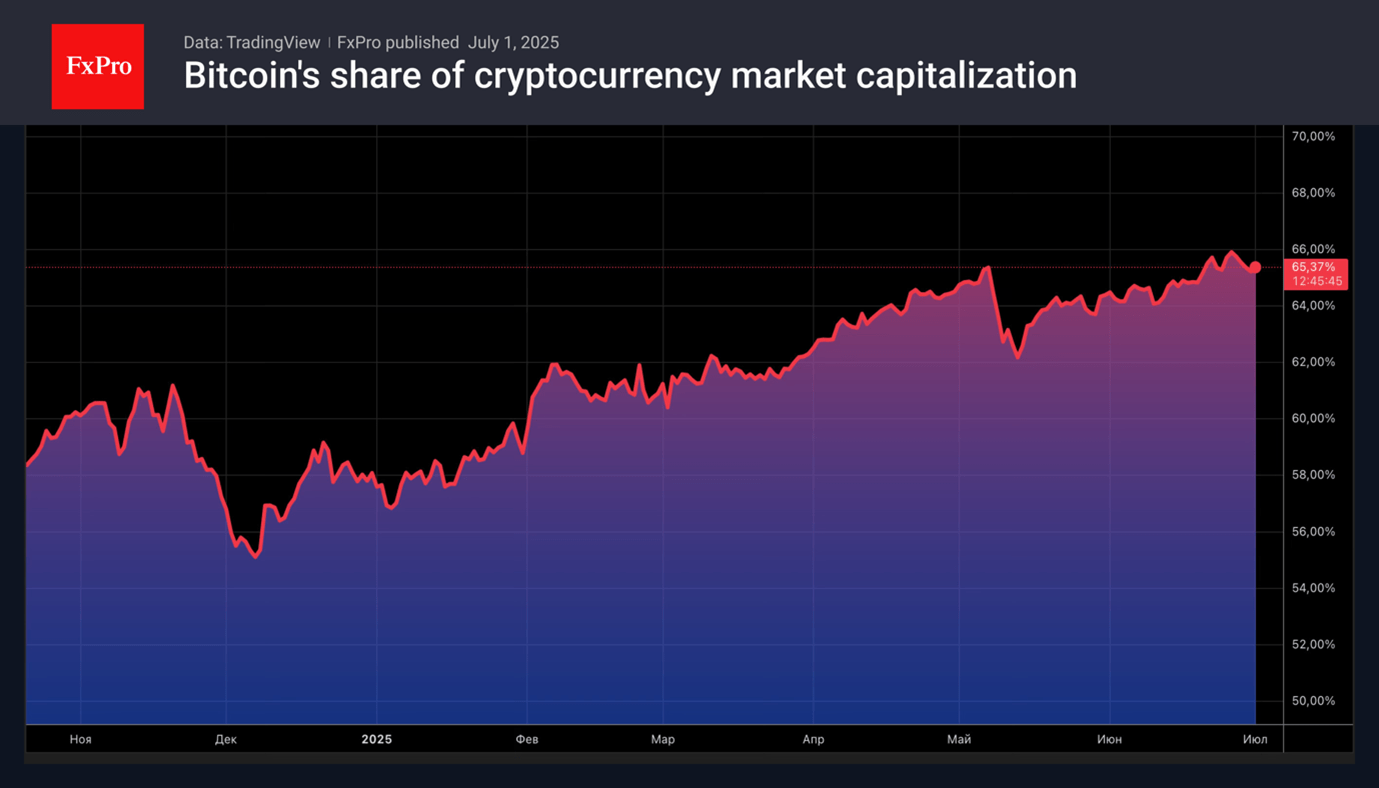
The MarketVector Digital Assets 100 Small-Cap Index, which covers the bottom half of the 100 largest digital assets, initially doubled after Donald Trump’s election results in November. However, it then lost all its gains and fell by 50% in 2025. Bitcoin on the other hand, has risen by almost 14% since January and reached a new record high in May. Cryptocurrencies are benefiting from capital inflows into specialised exchange-traded funds and high global risk appetite.
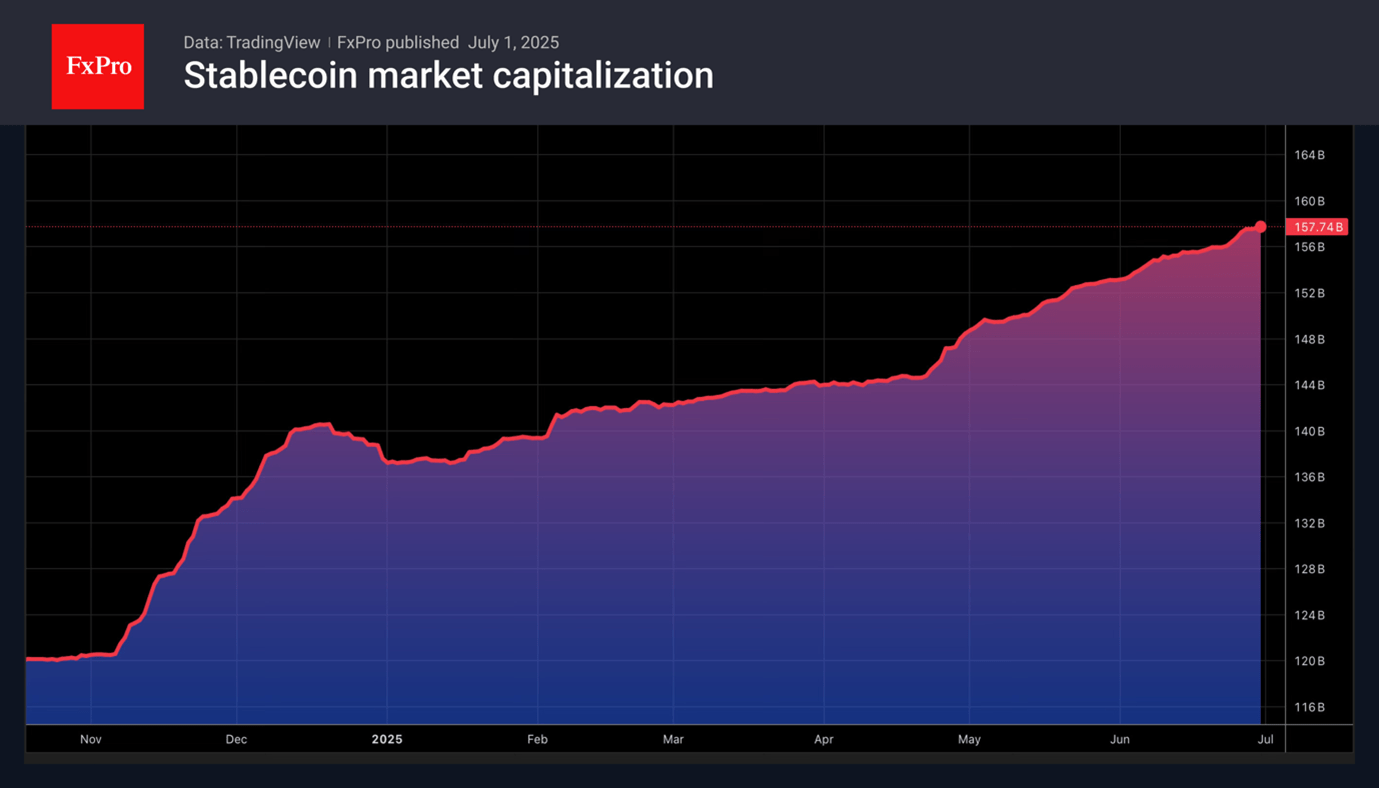
The only competition for Bitcoin comes from stablecoins. The adoption by Congress of legislation regulating their circulation is increasing investor interest in this type of digital asset. In the first half of the year alone, the market capitalisation of stablecoins grew by $47 billion. Not only banks but also large companies such as Amazon are exploring opportunities for their implementation.
Bitcoin is showing little interest in restoring its correlation with US stock indices. The S&P 500 and Nasdaq Composite managed to update their record highs in June, but Bitcoin is in no hurry to do so. The link between the traditional markets and crypto was broken during the armed conflict in the Middle East. Currently the digital assets leader is cautiously watching the approach of the 9th of July, the expiry date of the White House’s 90-day tariff delay.
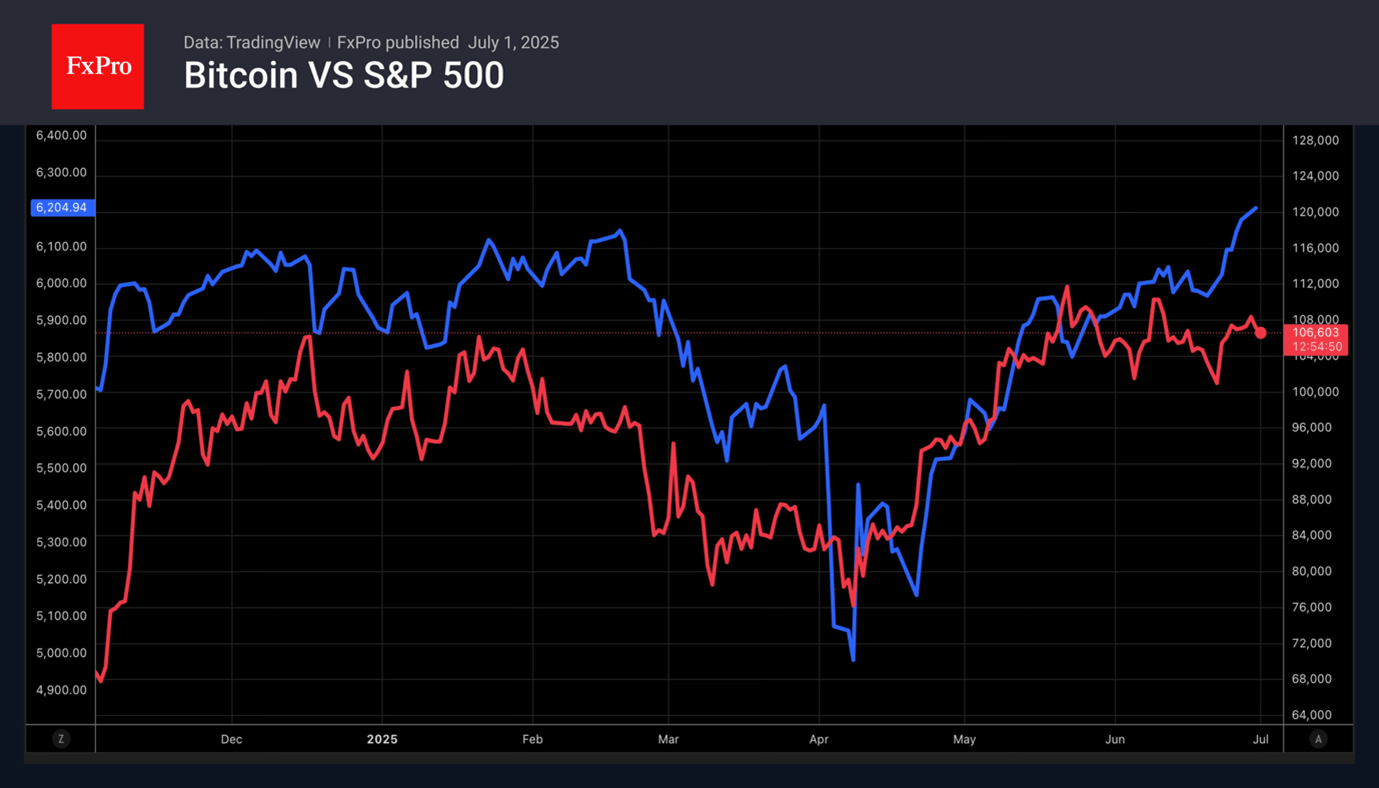
The escalation of trade wars will increase the risks of a pullback in US stock indices. According to Bank of America, the bubble in the US stock market continues to inflate. If it bursts, all risky assets will suffer. It is not surprising that Bitcoin is cautious. On the contrary, new records for the S&P 500 will allow bitcoin bulls to aim for a new all-time high.