Sample Category Title
DXY (96.77) Has Troubles Leaving the Recent Multiyear Lows Behind
Markets
UK gilts crashed yesterday. Yields on the long-end of the curve surged by almost 20 bps (30-yr) over fiscal concerns. The worrying state of public finances in the UK (and elsewhere) have become an evergreen but moved into the spotlights again after PM Starmer, pressured by internal revolt, ditched the £5bn cost-saving part from the welfare bill. It puts even more strain on the already extremely tight budget Chancellor Reeves has to work with. She now has to look for additional spending cuts or another rise in tax for the yearly October budget if Reeves wants to adhere to her self-imposed fiscal rules. A third option is changing (ie. loosen) those rules. That risks unnerving markets, though. Such accounting tricks are mere window-dressing and do not improve the deficit situation, on the contrary. That’s why Reeves consistently ruled it out after having altered them once ahead of the October 2024 Budget. But if Reeves won’t, maybe another Chancellor will. Speculation for Reeves to be sacked surged in yesterday’s House of Commons session where a questioned Starmer failed to back his running Chancellor. A visibly upset Reeves shedding a tear added to the drama – and perhaps even to the yield rally. The pound joined the sell-off with EUR/GBP soaring to the highest levels since mid-April in the mid 0.86/87 area. It will be tricky for UK assets to get out of the crosshairs now. Markets ex UK suffered collateral damage. Both the US and European yield curve bear steepened. The former rose between 1.2-3.8 bps with the dip following the disappointing ADP job report easily wiped out. European swap yields rose 1-5.2 bps. Even Japanese yields rise 6 bps and counting at the long end, despite a successful 30-yr auction. The euro and dollar balanced each other, resulting in a status quo around EUR/USD 1.18. DXY (96.77) has troubles leaving the recent multiyear lows behind. It could be make or break for the greenback today with the June payrolls and non-manufacturing ISM scheduled for release. EUR/USD is eager for an upside break out of the upward sloping trend channel, all the way back to the 2021 high. A further drop in DXY below the recent troughs implies a return to 94.65 and 95.24 initially before the 2021 low of 89.21. Employment growth is expected to rise by 106k with a minor uptick in the unemployment rate to 4.3%. The ISM would recover from the sub 50 print in May to 50.6, barely suggesting growth. Both the dollar and front-end yields are keen to spot any weaknesses after Powell’s communication twist. The long end in theory is better supported by the fiscal topic – the OBBBA is currently stuck in the House over a failed procedural vote – but we could see that curve segment joining the front lower as well in case of a miss.
News & Views
The National Bank of Poland yesterday unexpectedly cut its policy rate by 25 bps to 5%, conflicting with signals coming from several MPC members recently. In its policy statement the NBP now assesses that inflation in the coming months might fall below the upper bound of the NBP’s target band (2.5% +/- 1%pt). Inflation in June printed at 4.1% and the NBP expects that the still-to-be-published core reading will be close to May’s 3.3%. The new forecast for growth over the 2025-2027 period didn’t profoundly change (2025: 2.9%-4.3%, 2026: 2.1%-4.0%, 2027: 1.3%-3.7%), but inflation was downwardly revised, in particular for this year (2025: median 4.0% from 4.9%, 2026: 3.1% from 3.4%, 2027: 2.4% from 2.5%). The NBP gave few indications on future rate cuts. Further decisions will depend on incoming information regarding prospects for inflation and economic activity. Fiscal policy stance, developments in demand pressure and situation in the labour market in subsequent quarters, as well as the level of administered energy prices, are factors of uncertainty. Governor Glapinski will comment the decision at press conference later today. The zloty declined from the EUR/PLN 4.25 area to close near EUR/PLN4.2655.
Anna Hughes, head the Australian debt office (Australian Office of Financial Management), said the agency is considering to scale back the issuance of ultra-long bonds as funding via those bonds is becoming ever more expensive, Bloomberg reported. The AOFM plans to issue A$150 bln worth of bonds this year with the focus on the 10-y part of the curve. Higher yields at the very long end of the curve might cause the agency to become more flexible in its issuances intentions at those tenors. The considerations of the AOFM mirror similar assessments by other major sovereign issuers as market concerns on high fiscal deficits cause broad-based steepening of yield curves. Even after some easing of late the Australian 30-y yield stands near 4.85% vs 4.25 for the 2-y yield, with the RBA still in an easing cycle.
Swiss CPI returns to positive territory at 0.1% yoy in June
Swiss consumer prices surprised slightly to the upside in June, with headline CPI rising 0.2% mom and turning positive on an annual basis at 0.1% yoy, reversing May’s -0.1% yoy print. Core CPI also firmed to 0.6% yoy from 0.5% yoy, suggesting that underlying inflation pressures remain subdued but stable.
Domestic prices were the key driver, up 0.2% mom and 0.7% yoy. Imported goods remained weak—flat on the month and still down -1.9% yoy despite an improvement from May’s -2.4% yoy.

Cracks Beneath the Record Highs
The S&P 500 closed at a fresh record high yesterday, boosted by a 4% jump in Nike shares — now up 45% since April’s dip on the back of the US–Vietnam trade deal. At first glance, the market reaction might suggest the deal was great news. But was it?
Under the agreement, Vietnamese exports to the US will face a 20% tariff, while goods transiting through Vietnam — such as Chinese products — will be taxed at 40%. In other words, goods made in Vietnam will now cost 20% more than they did before, which is 10 percentage points above the 10% universal tariff rate. While that’s still lower than the 40+% initially floated on Liberation Day, the new tariff structure still marks a significant cost increase, though lifting sentiment at names like Nike, Lululemon and Under Armour. In exchange, US goods will enter Vietnam without tariffs. A power play, clearly.
More trade optimism came for the semiconductor sector, as the US reportedly lifted export license requirements for chip design software sales to China. This allowed Siemens to restore full access to its tools for Chinese clients. The move follows last week’s US–China trade truce, which resumed rare earth exports from China to the US. Other firms previously affected by restrictions, such as Synopsys and Cadence Design Systems, could also benefit from renewed investor interest. Semiconductor names with China exposure — Nvidia in particular — may see further upside.
Jobs lost
The US ADP employment report printed a negative figure yesterday, signaling that the US economy lost jobs in June. Markets initially reacted with a selloff — until the trade news turned sentiment around. Notably, the weak data lifted the odds of a July Federal Reserve (Fed) rate cut from around 21% to over 27%, but the 2-year US yield, which closely tracks Fed expectations, didn’t drop. It rebounded past 3.80% and is now consolidating just below that level.
Today, the US will release official jobs data a day earlier than usual due to the July 4th holiday. According to a Bloomberg survey, analysts expect 111,000 new nonfarm payrolls, a slight slowdown in average earnings growth on a monthly basis and an uptick in the unemployment rate from 4.2% to 4.3%
If the NFP report comes in softer than expected, it could further embolden Fed doves and help keep the S&P 500 near — or above — record levels. But stronger numbers could muddle the picture, as has often been the case this year, and support the Fed’s stance that the labour market remains resilient.
Still, inflation will be the ultimate arbiter of whether the Fed cuts rates later this year. If tariffs drive up prices — and they likely will — the Fed may have to ignore weakening jobs data for a while. It will only act decisively when labour and growth indicators flash red. Until then, equity markets could face a correction before any meaningful dovish shift materializes.
Mind the rise
Meanwhile, long-term bond yields across Western markets are flashing early signs of stress. The latest catalyst was a moment of uncertainty in the UK, where Keir Starmer hesitated to confirm whether Chancellor Rachel Reeves would remain in her post — while Reeves was seen wiping away tears behind him in Parliament (it’s reportedly for personal reasons). But the imagery alone raised alarms about the UK’s narrowing fiscal headroom, the need to raise taxes and cut spending, and the credibility of the gilt market. As a result, the 10-year gilt yield surged 25 basis points, pushing the US 10-year yield to 4.30%. Japanese long-term yields also reversed recent declines.
In summary, trade deals are back, but they come with tariffs that could reignite inflation. Economic data is weakening, but not enough to force the Fed’s hand. And long-term yields are creeping higher, flashing early signs of market stress.
Stocks may be hitting new highs, but under the surface, the pressure is building. This isn’t smooth sailing — it’s a rally flying straight into headwinds.
USD/CHF Daily Outlook
Daily Pivots: (S1) 0.7902; (P) 0.7921; (R1) 0.7941; More….
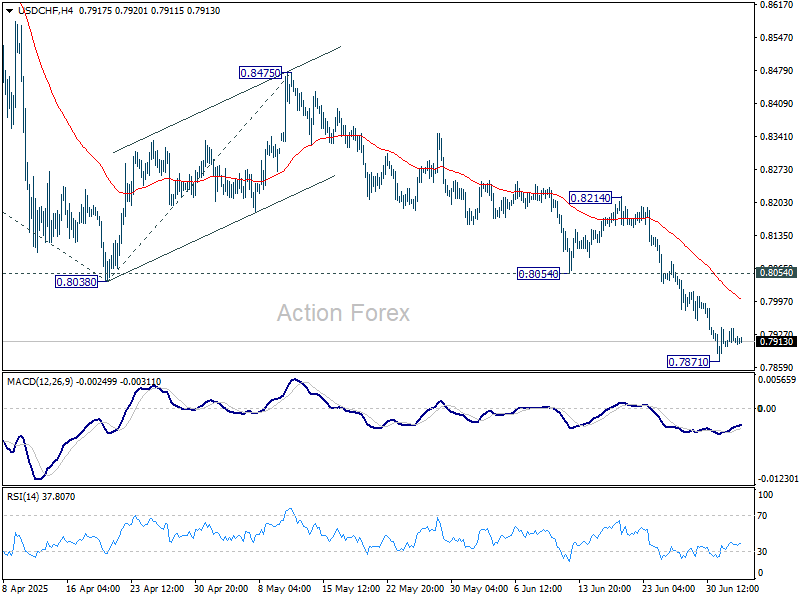
Intraday bias in USD/CHF remains neutral and more consolidations could be seen above 0.7871 temporary low. Upside of recovery should be limited by 0.8054 support turned resistance to bring another fall. Below 0.7871 will extend the larger down trend to 61.8% projection of 0.9200 to 0.8038 from 0.8475 at 0.7757. Firm break there will pave the way to 100% projection at 0.7313 next.
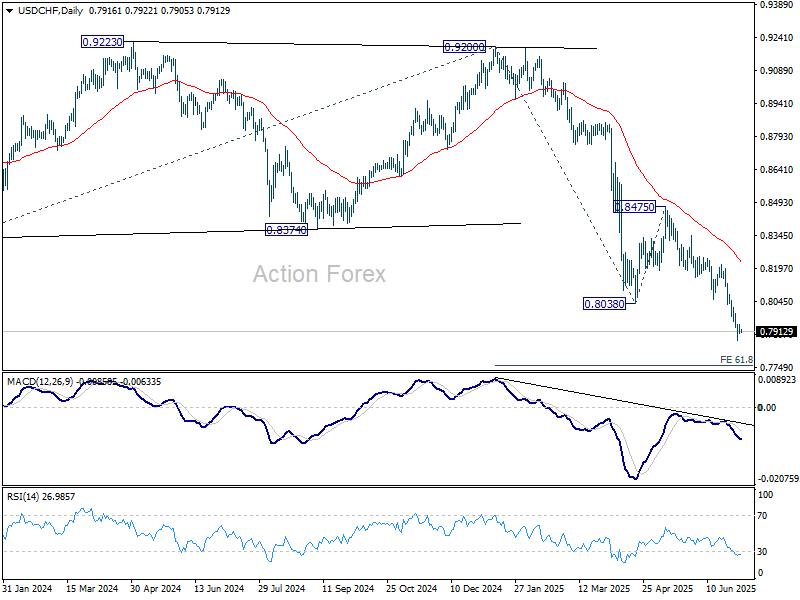
In the bigger picture, long term down trend from 1.0342 (2017 high) is still in progress. Next target is 100% projection of 1.0146 (2022 high) to 0.8332 from 0.9200 at 0.7382. In any case, outlook will stay bearish as long as 0.8475 resistance holds.
Dollar Selloff Stalls Before NFP Test: Calm Before the Shock?
Dollar is pausing its recent slide as markets brace for today’s Non-Farm Payrolls report, but its recovery remains shallow. Barring its gains against the troubled British Pound, the greenback remains broadly weaker against major currencies for the week. Traders are increasingly wary of a downside surprise in the jobs report, which could revive speculation that the Fed may cave to growing political pressure and deliver a rate cut as early as this month. Market sentiment could shift quickly if labor market cracks deepen.
Such a shift could further weigh on Dollar, already dragged by rising fiscal concerns and mixed signals on trade. President Donald Trump announced a trade deal with Vietnam that includes a 20% tariff on Vietnamese goods and a steep 40% “transshipping” tariff. In a separate move signaling goodwill, the US government lifted export restrictions on chip-design software to China. However, broader trade negotiations with major economies remain stalled, and the July 9 self-imposed tariff truce deadline still looms with little indication of delay or progress.
Across the Atlantic, the British Pound is reeling. Turmoil within the Labour government sparked fresh selling yesterday, with Chancellor Rachel Reeves’ position suddenly appearing shaky after Prime Minister Keir Starmer failed to offer a clear endorsement. Reeves has been the face of fiscal responsibility, and markets fear that her possible replacement by a more dovish figure—like cabinet minister Pat McFadden—could signal a shift toward more borrowing. Gilt yields have surged in response, and Sterling continues to lead the weekly losses among major currencies.
Swiss Franc and Euro are outperforming this week, both capitalizing on the floundering Pound. Yen and Loonie are relatively directionless, while the Aussie and Kiwi are struggling to gain traction.
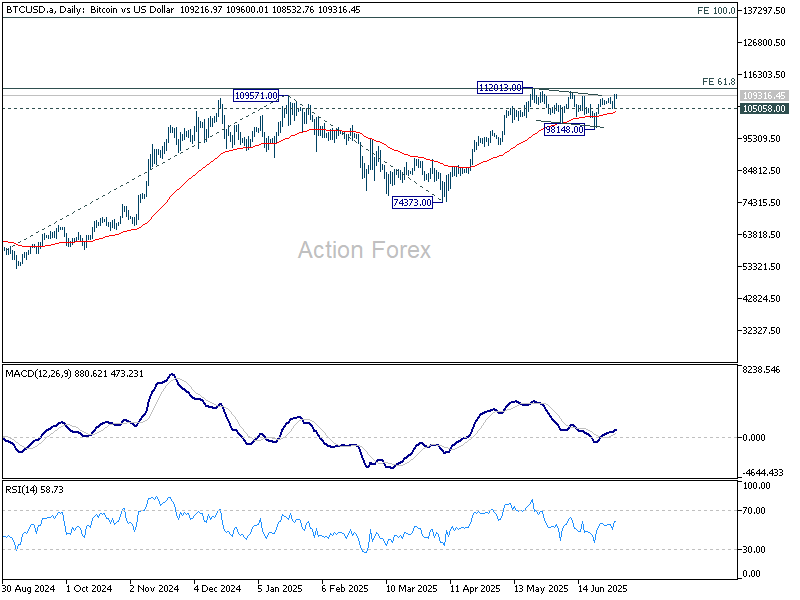
Technically, Bitcoin's bounces yesterday is solidifying the case that correction from 112013 has competed at 98148 already. Focus is back on 112013 resistance. Decisive break there will resume the long term record run, and target 100% projection of 49008 to 109571 from 74373 at 134936 next.
In Asia, at the time of writing, Nikkei is down -0.06%. Hong Kong HSI is down -0.76%. China Shanghai SSE is up 0.19%. Singapore Strait Times is down -0.10%. Japan 10-year JGB yield is up 0.019 at 1.451. Overnight, DOW fell -0.02%. S&P 500 rose 0.47%. NASDAQ rose 0.94%.
NFP report could tip scale in politicized Fed debate over rate cuts
The June US Non-Farm Payrolls report lands today at a moment when the Fed is facing increasingly overt political pressure. President Donald Trump has ramped up calls for rate cuts, and two Fed governors—Christopher Waller and Michelle Bowman—are aligning with that view. Both have recently suggested that a rate cut this month is on the table, and both are seen as potential candidates to replace Jerome Powell. That political backdrop is raising the stakes for today's data.
So far, Fed Chair Jerome Powell and the broader FOMC have pushed back against moving too soon, emphasizing the need to assess incoming information, particularly on inflation and tariffs. However, if today’s jobs data weakens materially, Fed could face tremendous pressure from Trump's political orbit.
Consensus expects a moderate 110k rise in payrolls, unemployment ticking up to 4.3%, and wages growth at 0.3% mom. But recent indicators—ADP's unexpected -33k drop, soft ISM employment, and a rising four-week average of jobless claims—suggest the risk is skewed toward a downside surprise. A shocking print under 100k could provide fresh ammunition for those lobbying for immediate action, both inside and outside the Fed.
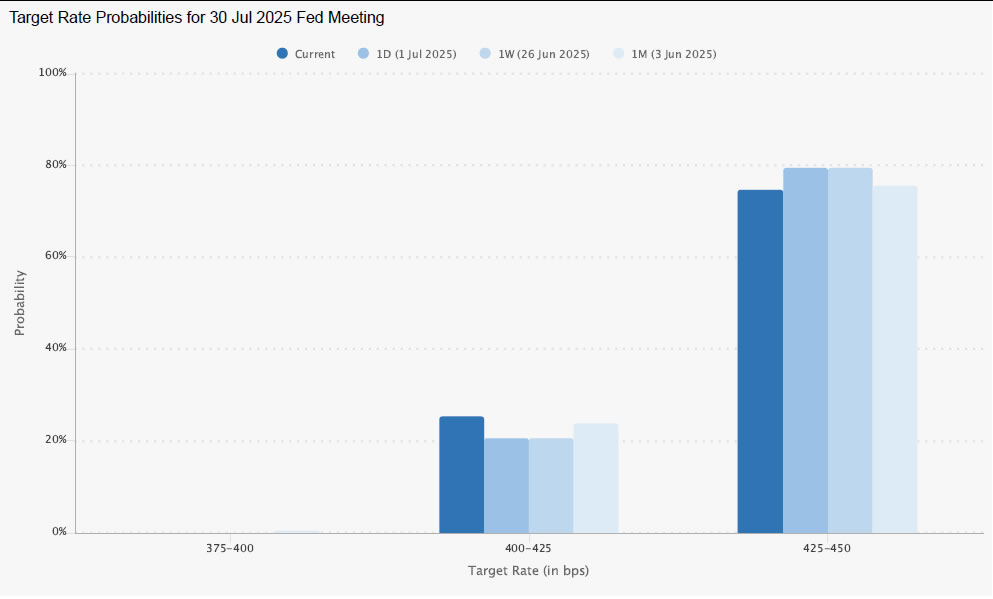
Markets still only price around a 25% chance of a July cut, with September seen as more likely. But if today’s NFP misses badly, that calculus could change fast.
Fed's Barkin downplays ADP miss, needs more data before acting
Speaking to Fox Business, Richmond Fed President Tom Barkin dismissed alarm over the unexpected drop in ADP employment, saying he’s more focused on the unemployment rate in Friday’s jobs report. With joblessness steady around 4.1% to 4.3% for over a year, Barkin suggested "that all feels like a pretty stable range". He also noted that slower job growth must be seen in context with a cooling labor force, particularly as immigration flows ease.
Asked whether a weak payrolls figure could prompt the Fed to cut rates in July, Barkin avoided specifics and emphasized that the decision would depend on a broader set of inputs. “There’s more we’re going to learn,” he said, citing upcoming inflation data, tariff developments, and the pending tax bill. His remarks signal continued caution inside the Fed, even as market expectations lean toward a cut by September.
Despite recent data noise, Barkin remained cautiously optimistic. “What I see is a solid economy — not a strong economy — but a solid economy, one where people are not yet pulling back,” he said.
BoJ's Takata sees "True Dawn" for Japan, urges caution but not pessimism on tariffs
BoJ board member Hajime Takata said in a speech today that Japan may finally be emerging from decades-long economic stagnation. Reflecting on the structural decline since the 1990s, driven by the collapse of the bubble economy and intensifying global competition, Takata noted that while firms built resilience through deleveraging and restructuring, this also entrenched a low-investment, low-wage, and low-price "norm".
Takata argued Japan is "finally beginning to break free of this norm". Recent shifts in corporate pricing and wage behavior suggest Japan could be on the cusp of a sustained recovery. Still, he warned that US tariff policies risk derailing progress, recalling how similar global shocks in the 2000s repeatedly interrupted Japan’s economic revivals.
Yet's Takata's confident that this time could mark a “true dawn” and emphasized that being "overly pessimistic also poses a considerable risk". He noted that the BOJ should maintain its accommodative stance for now, but also continue “gradually and cautiously” transitioning policy as conditions allow. Japan, he said, has a history of enduring far more intense trade tensions and should avoid falling into excessive pessimism.
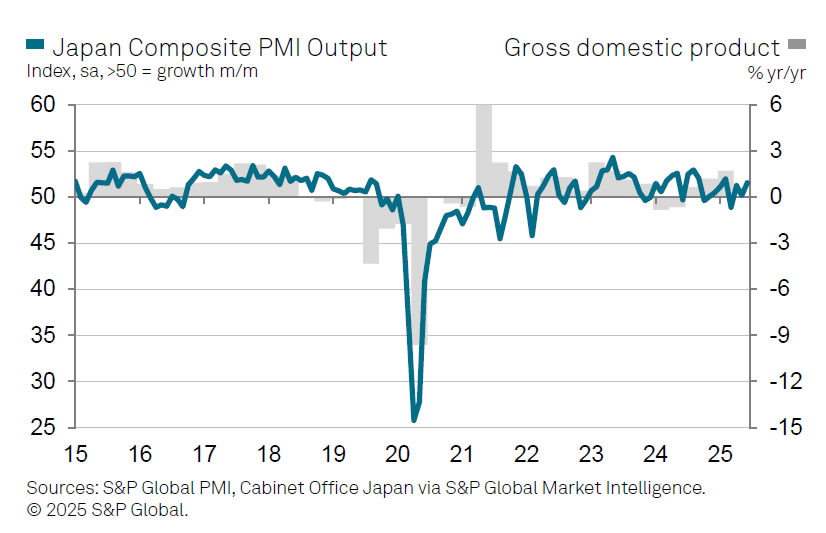
Japan’s PMI composite finalized at 51.5, recovery fragile on sluggish demand
Japan’s private sector posted modest gains in June, with the final PMI Services index rising to 51.7 from 51.0 and the Composite index improving to 51.5 from 50.2 in May. The latest data signalled continued expansion, though momentum softened compared to the first quarter. S&P Global’s Annabel Fiddes noted that second-quarter PMI readings suggest a slowdown in GDP growth.
"Demand conditions remained sluggish" as new business rose only fractionally for the second month, and new export orders continued to decline. Firms are still struggling to gain traction amid US tariff uncertainty.
Meanwhile, inflationary pressures persisted. Businesses reported "strong cost pressures", partly due to rising staffing levels. These costs were passed on through quicker hikes in output prices, despite muted demand.
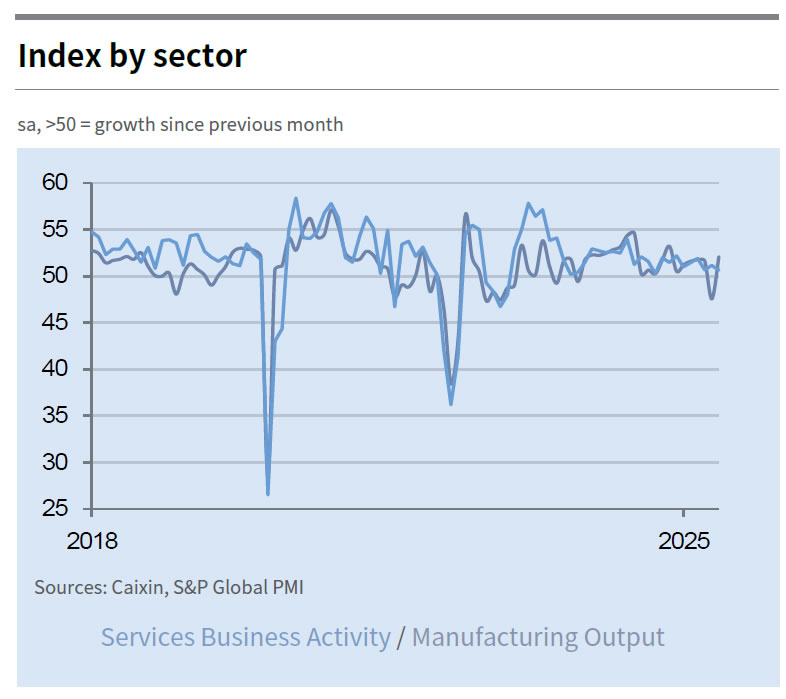
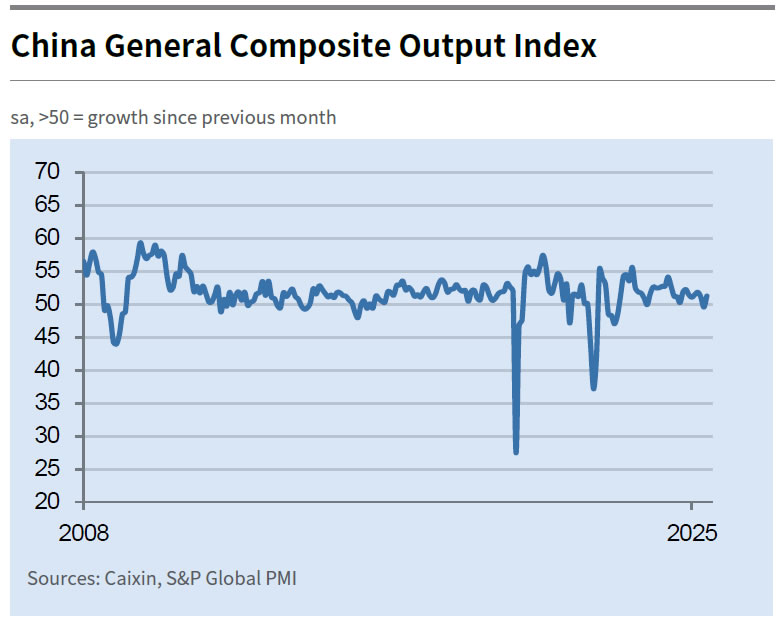
China’s Caixin PMI services PMI falls to 50.6, but composite returns to growth
China’s Caixin PMI Services dropped to 50.6 in June from 51.1, missing expectations of 51.0. However, the broader PMI Composite rose from 49.6 to 51.3, marking a return to growth territory driven largely by stronger manufacturing activity. Caixin’s Wang Zhe noted that while supply and demand both improved, the rebound remains uneven and fragile.
Still, the data suggest mounting challenges. Employment continued to contract, and firms were forced to cut selling prices at the fastest rate in over a year, squeezing profitability despite stable input costs. Optimism weakened amid ongoing uncertainty, with business sentiment falling below its long-term average.
USD/CHF Daily Outlook
Daily Pivots: (S1) 0.7902; (P) 0.7921; (R1) 0.7941; More….
Intraday bias in USD/CHF remains neutral and more consolidations could be seen above 0.7871 temporary low. Upside of recovery should be limited by 0.8054 support turned resistance to bring another fall. Below 0.7871 will extend the larger down trend to 61.8% projection of 0.9200 to 0.8038 from 0.8475 at 0.7757. Firm break there will pave the way to 100% projection at 0.7313 next.
In the bigger picture, long term down trend from 1.0342 (2017 high) is still in progress. Next target is 100% projection of 1.0146 (2022 high) to 0.8332 from 0.9200 at 0.7382. In any case, outlook will stay bearish as long as 0.8475 resistance holds.
NFP report could tip scale in politicized Fed debate over rate cuts
The June US Non-Farm Payrolls report lands today at a moment when the Fed is facing increasingly overt political pressure. President Donald Trump has ramped up calls for rate cuts, and two Fed governors—Christopher Waller and Michelle Bowman—are aligning with that view. Both have recently suggested that a rate cut this month is on the table, and both are seen as potential candidates to replace Jerome Powell. That political backdrop is raising the stakes for today's data.
So far, Fed Chair Jerome Powell and the broader FOMC have pushed back against moving too soon, emphasizing the need to assess incoming information, particularly on inflation and tariffs. However, if today’s jobs data weakens materially, Fed could face tremendous pressure from Trump's political orbit.
Consensus expects a moderate 110k rise in payrolls, unemployment ticking up to 4.3%, and wages growth at 0.3% mom. But recent indicators—ADP's unexpected -33k drop, soft ISM employment, and a rising four-week average of jobless claims—suggest the risk is skewed toward a downside surprise. A shocking print under 100k could provide fresh ammunition for those lobbying for immediate action, both inside and outside the Fed.
Markets still only price around a 25% chance of a July cut, with September seen as more likely. But if today’s NFP misses badly, that calculus could change fast.
China’s Caixin PMI services PMI falls to 50.6, but composite returns to growth
China’s Caixin PMI Services dropped to 50.6 in June from 51.1, missing expectations of 51.0. However, the broader PMI Composite rose from 49.6 to 51.3, marking a return to growth territory driven largely by stronger manufacturing activity. Caixin’s Wang Zhe noted that while supply and demand both improved, the rebound remains uneven and fragile.
Still, the data suggest mounting challenges. Employment continued to contract, and firms were forced to cut selling prices at the fastest rate in over a year, squeezing profitability despite stable input costs. Optimism weakened amid ongoing uncertainty, with business sentiment falling below its long-term average.
BoJ’s Takata sees “True Dawn” for Japan, urges caution but not pessimism on tariffs
BoJ board member Hajime Takata said in a speech today that Japan may finally be emerging from decades-long economic stagnation. Reflecting on the structural decline since the 1990s, driven by the collapse of the bubble economy and intensifying global competition, Takata noted that while firms built resilience through deleveraging and restructuring, this also entrenched a low-investment, low-wage, and low-price "norm".
Takata argued Japan is "finally beginning to break free of this norm". Recent shifts in corporate pricing and wage behavior suggest Japan could be on the cusp of a sustained recovery. Still, he warned that US tariff policies risk derailing progress, recalling how similar global shocks in the 2000s repeatedly interrupted Japan’s economic revivals.
Yet's Takata's confident that this time could mark a “true dawn” and emphasized that being "overly pessimistic also poses a considerable risk". He noted that the BOJ should maintain its accommodative stance for now, but also continue “gradually and cautiously” transitioning policy as conditions allow. Japan, he said, has a history of enduring far more intense trade tensions and should avoid falling into excessive pessimism.
Bitcoin Bounces Back — Momentum Builds Toward New ATH
Key Highlights
Bitcoin started a fresh increase above the $106,500 resistance.
- BTC/USD cleared a major bearish trend line with resistance at $107,000 on the 4-hour chart.
- Ethereum recovered losses and climbed above the $2,500 resistance.
- XRP price is consolidating and facing hurdles near $2.320.
Bitcoin Price Technical Analysis
Bitcoin price started a fresh increase above the $103,500 zone against the US Dollar. BTC was able to surpass the $105,000 and $106,500 resistance levels.
Looking at the 4-hour chart, the price cleared a major bearish trend line with resistance at $107,000. The price settled above the 100 simple moving average (red, 4-hour) and the 200 simple moving average (green, 4-hour).
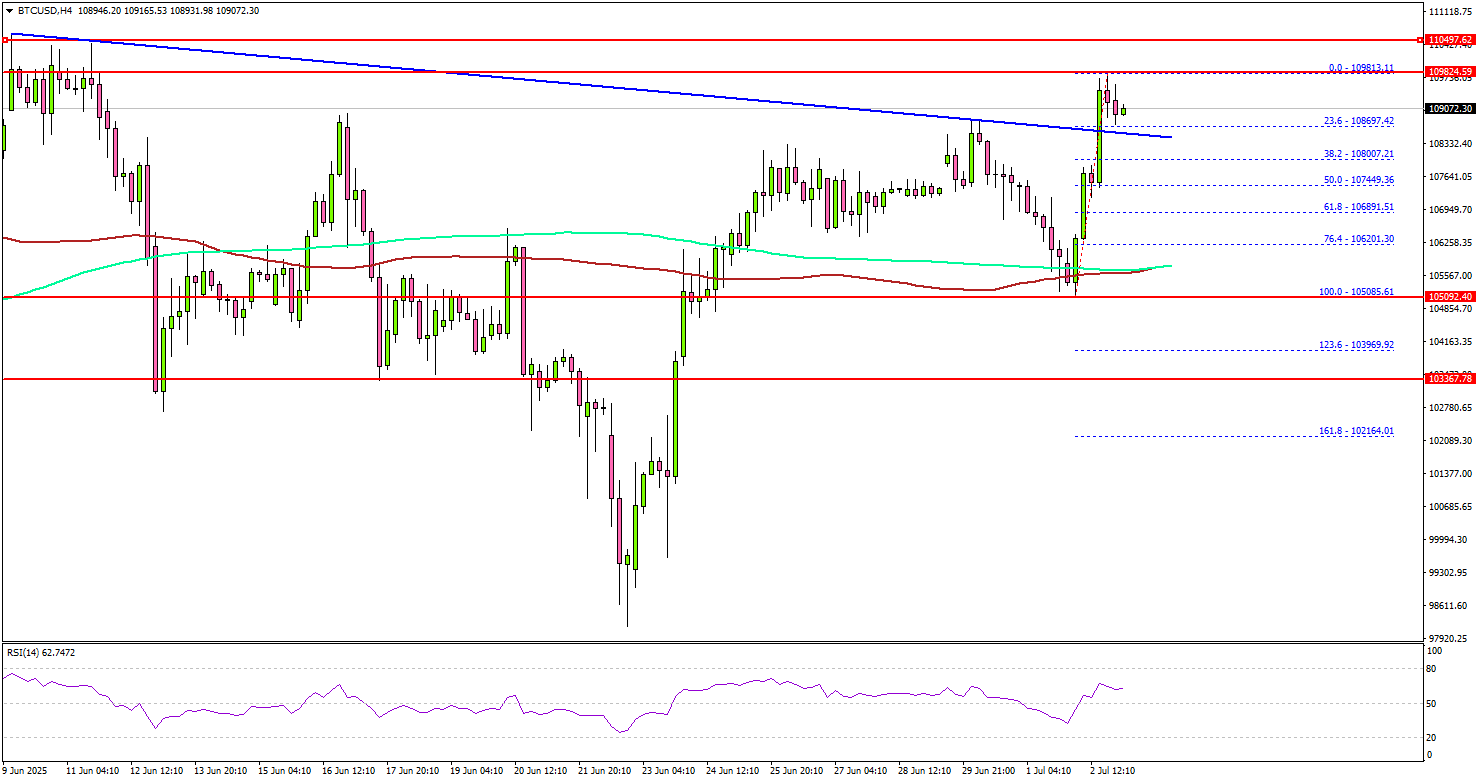
A high was formed at $109,813 and the price is now consolidating gains. It is finding bids near the same trend line and the 23.6% Fib retracement level of the upward move from the $105,085 swing low to the $109,811 high.
On the upside, the price could face resistance near the $109,800 level. The next key resistance is $110,000. A successful close above $110,000 might start another steady increase.
In the stated case, the price may perhaps rise toward the $112,000 level. Any more gains might call for a test of $115,000 and a new all-time high. If there is a pullback, Bitcoin might find support near the $108,200 level.
A downside break below $108,200 might send BTC toward the $107,500 support. Any more losses might send the price toward the $105,500 support zone.
Looking at Ethereum, the bulls seem to be in control, and they were able to push the price above the $2,500 resistance zone.
Today’s Economic Releases
- US Initial Jobless Claims - Forecast 240K, versus 236K previous.
- US nonfarm payrolls for June 2025 – Forecast 110K, versus 139K previous.
- US Unemployment Rate for June 2025 - Forecast 4.3%, versus 4.2% previous.
Japan’s PMI composite finalized at 51.5, recovery fragile on sluggish demand
Japan’s private sector posted modest gains in June, with the final PMI Services index rising to 51.7 from 51.0 and the Composite index improving to 51.5 from 50.2 in May. The latest data signalled continued expansion, though momentum softened compared to the first quarter. S&P Global’s Annabel Fiddes noted that second-quarter PMI readings suggest a slowdown in GDP growth.
"Demand conditions remained sluggish" as new business rose only fractionally for the second month, and new export orders continued to decline. Firms are still struggling to gain traction amid US tariff uncertainty.
Meanwhile, inflationary pressures persisted. Businesses reported "strong cost pressures", partly due to rising staffing levels. These costs were passed on through quicker hikes in output prices, despite muted demand.