Sample Category Title
Dollar Rebounds as Solid NFP Eases Urgency for Fed Action
Dollar rebounded in early US session following the better-than-expected June non-farm payrolls report, further reversing much of the week's earlier weakness. While not a blowout, the report showed a labor market that remains fundamentally resilient, and significantly reduces pressure on the Fed to pull the trigger at the July meeting.
Fed Chair Jerome Powell and his like-minded colleagues have been clear they want more clarity on trade policy and inflation before moving. Today’s data buys the Fed more time to assess broader risks. The drop in wage growth could help the case for resuming cuts later this year, but not imminently.
On Capitol Hill, political developments are also in focus. House Republicans overnight broke a legislative deadlock and advanced President Donald Trump’s massive tax-and-spending bill. With the Senate already having passed the measure, attention turns to a final House vote, potentially before July 4.
In currency markets, Dollar is leading gains today, and it's no longer at the bottom of the weekly performance ladder. Loonie and Sterling are also firming, while Kiwi, Yen, and Aussie lag. Euro and Swiss Franc are positioning in the middle.
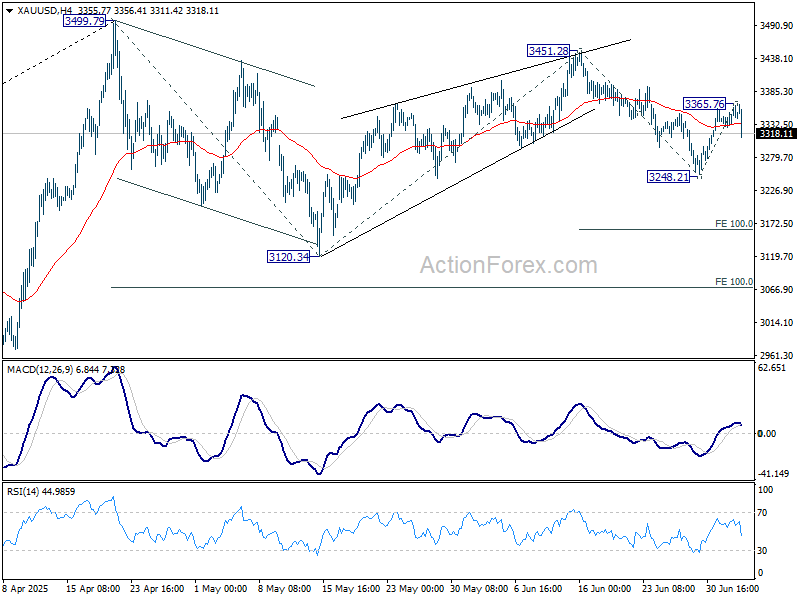
Technically, Gold falls sharply as rebound from 3248.21 might have already completed at 3365.76. Overall outlook is unchanged that fall from 3451.28 is seen as the third leg of the corrective pattern from 3499.79 high. Break of 3248.21 will target 100% projection of 3451.28 to 3248.21 from 3365.76 at 3162.69, or even further to 3120.34 support.
In Europe, at the time of writing, FTSE is up 0.69%. DAX is up 0.38%. CAC is up 0.22%. UK 10-year yield is down -0.048 at 4.57. Germany 10-year yield is down -0.024 at 2.603. Earlier in Asia, Nikkei rose 0.06%. Hong Kong HSI fell -0.63%. China Shanghai SSE rose 0.18%. Singapore Strait Times rose 0.22%. Japan 10-year JGB yield rose 0.011 to 1.443.
US NFP growth solidly by 147k in June, wage pressures ease
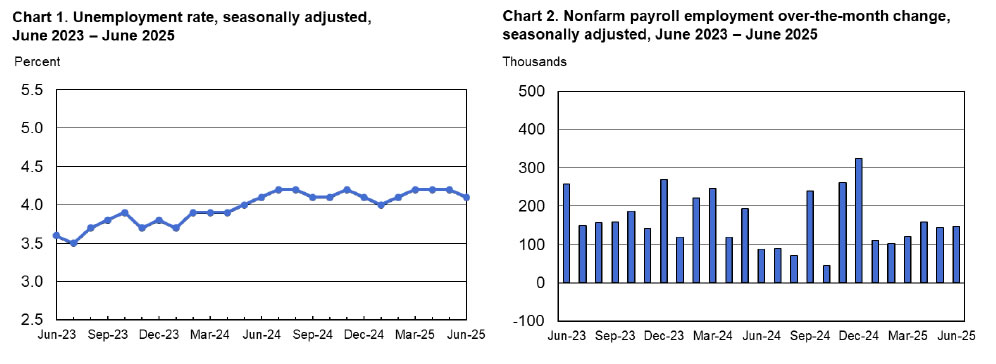
US non-farm payrolls rose 147k in June, above the expected 110k and broadly in line with the 12-month average of 146k. Unemployment rate unexpectedly dropped from 4.2% to 4.1%, helped in part by a small dip in the participation rate to 62.3%. Overall, the data suggest that the labor market remains stable, with no clear signs of deterioration that would force the Fed’s hand in July.
However, wage growth continues to cool. Average hourly earnings rose just 0.2% mom and 3.7% yoy, both missing expectations of 0.3% mom and 3.9% yoy, and marking a further moderation from prior readings. This combination of solid hiring and easing wage pressure may support the case for a rate cut later in the year, but is unlikely to shift the Fed’s stance in the near term.
ECB accounts: June rate cut as safeguard against prolonged inflation undershoot
ECB’s June meeting minutes revealed that “almost all members” supported the 25bps deposit rate cut to 2.00%. Policymakers viewed the move as a safeguard to ensure "temporary undershoot in headline inflation did not become prolonged", ensuring the 2% target remains intact through 2027. The cut was also framed as positioning rates in “broadly neutral territory,” giving the ECB room to maneuver in either direction as needed.
While some officials initially favored leaving rates unchanged to allow more time to assess inflation outlook, they ultimately aligned with the majority view. One member, however, dissented. The majority concluded that delaying a cut increase the risk of "undershooting the inflation target in 2026 and 2027".
Overall, the ECB emphasized the need for full flexibility going forward. Given elevated global uncertainty and potential for rapid changes in inflation dynamics in both directions, the account stressed a “two-sided perspective” on inflation risks and a deliberate avoidance of forward guidance.
Eurozone PMI services finalized at 50.5, significance of services inflation receding into the background
Eurozone PMI Services was finalized at 50.5 in June, up from 49.7 in May. Composite PMI ticked up to 50.6 from 50.2. Although the bloc returned to modest expansion, performance remained uneven across major economies. Germany hit a three-month high at 50.4, while France fell to 49.2. Ireland, despite slowing to a five-month low, remained the strongest performer at 528. Spain (52.1) saw a slight pickup, while Italy’s reading slipped to 51.1.
Cyrus de la Rubia of Hamburg Commercial Bank noted that the services sector has been "more or less stagnant" since April. Nevertheless, Persistent labor shortages have discouraged firms from cutting jobs, helping stabilize private consumption. But a full recovery still looks elusive, with structural weaknesses continuing to weigh on growth momentum across much of the bloc.
Notably, rising input and output prices in services could be an unwelcome sign for the ECB. However, de la Rubia emphasized that broader disinflationary forces, such as Euro strength and tariff-driven downside risks, may outweigh the uptick in services inflation. While price pressure in services remains on the radar, it's significance is "receding somewhat into the background".
UK PMI services finalized at 52.8, a 10-month high
UK PMI Services was finalized at 52.8 in June, up from May’s 50.9, marking the fastest pace of expansion since August 2024. Composite PMI also rose to 52.0, the highest since September. The data signals a modest but broadening recovery, driven by improving domestic demand. S&P Global's Tim Moore noted that consumer and business spending showed signs of a turnaround after a sluggish spring.
However, the rebound was tempered by "shrinking export sales", with survey respondents citing pressures from US tariffs and geopolitical uncertainty. Additionally, firms were "reluctant to turn on the hiring taps", marking the ninth straight month of job shedding.
For the BoE, input cost inflation slowed noticeably, helping to ease pressure on output prices, which saw their weakest rise in over three years. With price pressures softening and labor markets cooling, today’s report strengthens the case for the BoE to deliver another rate cut in August.
Swiss CPI returns to positive territory at 0.1% yoy in June
Swiss consumer prices surprised slightly to the upside in June, with headline CPI rising 0.2% mmm and turning positive on an annual basis at 0.1% yoy, reversing May’s -0.1% yoy print. Core CPI also firmed to 0.6% yoy from 0.5% yoy, suggesting that underlying inflation pressures remain subdued but stable.
Domestic prices were the key driver, up 0.2% mom and 0.7% yoy. Imported goods remained weak—flat on the month and still down -1.9% yoy despite an improvement from May’s -2.4% yoy.
BoJ's Takata sees "True Dawn" for Japan, urges caution but not pessimism on tariffs
BoJ board member Hajime Takata said in a speech today that Japan may finally be emerging from decades-long economic stagnation. Reflecting on the structural decline since the 1990s, driven by the collapse of the bubble economy and intensifying global competition, Takata noted that while firms built resilience through deleveraging and restructuring, this also entrenched a low-investment, low-wage, and low-price "norm".
Takata argued Japan is "finally beginning to break free of this norm". Recent shifts in corporate pricing and wage behavior suggest Japan could be on the cusp of a sustained recovery. Still, he warned that US tariff policies risk derailing progress, recalling how similar global shocks in the 2000s repeatedly interrupted Japan’s economic revivals.
Yet's Takata's confident that this time could mark a “true dawn” and emphasized that being "overly pessimistic also poses a considerable risk". He noted that the BOJ should maintain its accommodative stance for now, but also continue “gradually and cautiously” transitioning policy as conditions allow. Japan, he said, has a history of enduring far more intense trade tensions and should avoid falling into excessive pessimism.
Japan’s PMI composite finalized at 51.5, recovery fragile on sluggish demand
Japan’s private sector posted modest gains in June, with the final PMI Services index rising to 51.7 from 51.0 and the Composite index improving to 51.5 from 50.2 in May. The latest data signalled continued expansion, though momentum softened compared to the first quarter. S&P Global’s Annabel Fiddes noted that second-quarter PMI readings suggest a slowdown in GDP growth.
"Demand conditions remained sluggish" as new business rose only fractionally for the second month, and new export orders continued to decline. Firms are still struggling to gain traction amid US tariff uncertainty.
Meanwhile, inflationary pressures persisted. Businesses reported "strong cost pressures", partly due to rising staffing levels. These costs were passed on through quicker hikes in output prices, despite muted demand.
China’s Caixin PMI services PMI falls to 50.6, but composite returns to growth
China’s Caixin PMI Services dropped to 50.6 in June from 51.1, missing expectations of 51.0. However, the broader PMI Composite rose from 49.6 to 51.3, marking a return to growth territory driven largely by stronger manufacturing activity. Caixin’s Wang Zhe noted that while supply and demand both improved, the rebound remains uneven and fragile.
Still, the data suggest mounting challenges. Employment continued to contract, and firms were forced to cut selling prices at the fastest rate in over a year, squeezing profitability despite stable input costs. Optimism weakened amid ongoing uncertainty, with business sentiment falling below its long-term average.
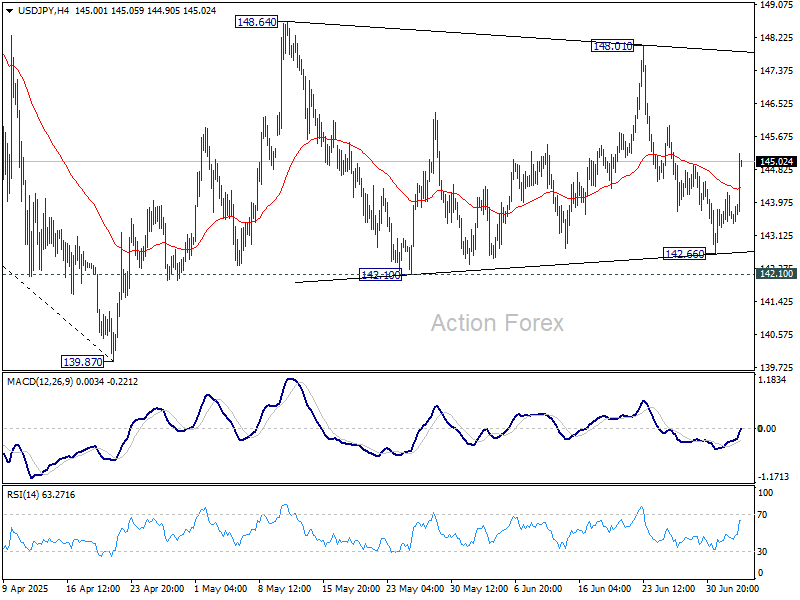
USD/JPY Mid-Day Outlook
Daily Pivots: (S1) 143.24; (P) 143.74; (R1) 144.17; More...
USD/JPY's rebound suggests that fall from 148.01 might have completed at 142.66. But still, it's staying inside near term established range. Intraday bias remains neutral at this point. On the upside, firm break of 148.01 resistance will resume the rise from 139.87 to 61.8% retracement of 158.86 to 139.87 at 151.22. However, break of 142.10 will bring deeper fall back to retest 139.87 low.
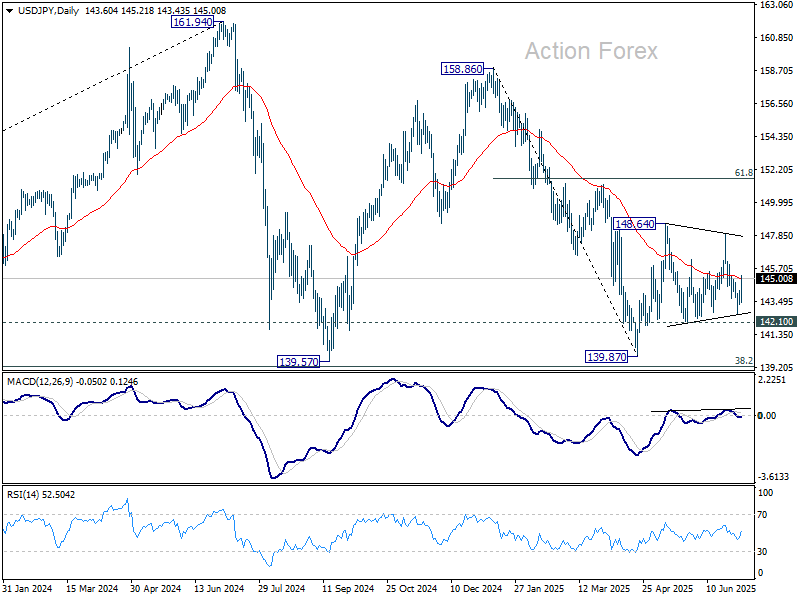
In the bigger picture, price actions from 161.94 are seen as a corrective pattern to rise from 102.58 (2021 low), with fall from 158.86 as the third leg. Strong support should be seen from 38.2% retracement of 102.58 to 161.94 at 139.26 to bring rebound. However, sustained break of 139.26 would open up deeper medium term decline to 61.8% retracement at 125.25.
US NFP growth solidly by 147k in June, wage pressures ease
US non-farm payrolls rose 147k in June, above the expected 110k and broadly in line with the 12-month average of 146k. Unemployment rate unexpectedly dropped from 4.2% to 4.1%, helped in part by a small dip in the participation rate to 62.3%. Overall, the data suggest that the labor market remains stable, with no clear signs of deterioration that would force the Fed’s hand in July.
However, wage growth continues to cool. Average hourly earnings rose just 0.2% mom and 3.7% yoy, both missing expectations of 0.3% mom and 3.9% yoy, and marking a further moderation from prior readings. This combination of solid hiring and easing wage pressure may support the case for a rate cut later in the year, but is unlikely to shift the Fed’s stance in the near term.
ECB accounts: June rate cut as safeguard against prolonged inflation undershoot
ECB’s June meeting minutes revealed that “almost all members” supported the 25bps deposit rate cut to 2.00%. Policymakers viewed the move as a safeguard to ensure "temporary undershoot in headline inflation did not become prolonged", ensuring the 2% target remains intact through 2027. The cut was also framed as positioning rates in “broadly neutral territory,” giving the ECB room to maneuver in either direction as needed.
While some officials initially favored leaving rates unchanged to allow more time to assess inflation outlook, they ultimately aligned with the majority view. One member, however, dissented. The majority concluded that delaying a cut increase the risk of "undershooting the inflation target in 2026 and 2027".
Overall, the ECB emphasized the need for full flexibility going forward. Given elevated global uncertainty and potential for rapid changes in inflation dynamics in both directions, the account stressed a “two-sided perspective” on inflation risks and a deliberate avoidance of forward guidance.
(ECB) Monetary policy accounts
Account of the monetary policy meeting of the Governing Council of the European Central Bank held in Frankfurt am Main on Tuesday, Wednesday and Thursday, 3-5 June 2025
3 July 2025
1. Review of financial, economic and monetary developments and policy options
Financial market developments
Ms Schnabel started her presentation by noting that the narrative in financial markets remained unstable. Since January 2025 market sentiment had swung from strong confidence in US exceptionalism to expectations of a global recession that had prevailed around the time of the Governing Council’s previous monetary policy meeting on 16-17 April, and then back to investor optimism. These developments had been mirrored by sharp swings in euro area asset markets, which had now more than recovered from the shock triggered by the US tariff announcement on 2 April. On the back of these developments, market-based measures of inflation compensation had edged up across maturities since the previous monetary policy meeting. The priced-in inflation path was currently close to 2% over the medium term, with a temporary dip below 2% seen for early 2026, largely owing to energy-related base effects. Nevertheless, expectations regarding ECB monetary policy had not recovered and remained near the levels seen immediately after 2 April.
Financial market volatility had quickly declined after the spike in early April. Stock market volatility had risen sharply in the euro area and the United States in response to the US tariff announcement on 2 April, reaching levels last seen around the time of Russia’s invasion of Ukraine in 2022 and the COVID-19 pandemic shock in 2020. However, compared with these shocks, volatility had receded much faster, returning to post-pandemic average levels.
The receding volatility had been reflected in a sharp rebound in asset prices across market segments. In the euro area, risk assets had more than recovered from the heavy losses incurred after the 2 April tariff announcement. By contrast, some US market segments, notably the dollar and Treasuries, had not fully recovered from their losses. The largest price increases had been observed for bitcoin and gold.
Two main drivers had led the recovery in euro area risk asset markets and the outperformance of euro area assets relative to US assets. The first had been the reassessment of the near-term macroeconomic outlook for the euro area since the Governing Council’s previous monetary policy meeting. Macroeconomic data for both the euro area and the United States had recently surprised on the upside, refuting the prospect of a looming recession for both regions. The forecasts from Consensus Economics for euro area real GDP growth in 2025, which had been revised down following the April tariff announcement, had gradually been revised up again, as the prospective economic impact of tariffs was currently seen as less severe than had initially been priced in. Expectations for growth in 2026 remained well above the 2025 forecasts. By contrast, expectations for growth in the United States in both 2025 and 2026 had been revised down much more sharply, suggesting that economic growth in the United States would be worse hit by tariffs than growth in the euro area.
The second factor supporting euro area asset prices in recent months had been a growing preference among global investors for broader international diversification away from the United States. Evidence from equity funds suggested that the euro area was benefiting from global investors’ international portfolio rebalancing.
The growing attractiveness of euro-denominated assets across market segments had been reflected in recent exchange rate developments. Since the April tariff shock, the EUR/USD exchange rate had decoupled from interest rate differentials, partly owing to a change in hedging behaviour. Historically, the euro had depreciated against the US dollar when volatility in foreign exchange markets increased. Over the past three months, however, it had appreciated against the dollar when volatility had risen, suggesting that the euro – rather than the dollar – had recently served as a safe-haven currency.
The outperformance of euro area markets relative to other economies had been most visible in equity prices. Euro area stocks had continued to outperform not only their US peers, but also stock indices of other major economies, including the United Kingdom, Switzerland and Japan. The German DAX had led the euro area rally and had surpassed its pre-tariff levels to reach a new record high, driven by expectations of strengthening growth momentum following the announcement of the German fiscal package in March. Looking at the factors behind euro area stock market developments, a divergence could be observed between short-term and longer-term earnings growth expectations. Whereas, for the next 12 months, euro area firms’ expected earnings growth had been revised down since the tariff announcement, for the next three to five years, analysts had continued to revise earnings growth expectations up. This could be due to a combination of a short-term dampening effect from tariffs and a longer-term positive impulse from fiscal policy.
The recovery in risk sentiment had also been visible in corporate bond markets. The spreads of high-yielding euro area non-financial corporate bonds had more than reversed the spike triggered by the April tariff announcement. This suggested that the heightened trade policy uncertainty had not had a lasting impact on the funding conditions of euro area firms. Despite comparable funding costs on the two sides of the Atlantic, when taking into account currency risk-hedging costs, US companies had increasingly turned to euro funding. This underlined the increased attractiveness of the euro.
The resilience of euro area government bond markets had been remarkable. The spread between euro area sovereign bonds and overnight index swap (OIS) rates had narrowed visibly since the April tariff announcement. Historically, during “risk-off” periods GDP-weighted euro area government asset swap spreads had tended to widen. However, during the latest risk-off period the reaction of the GDP-weighted euro area sovereign yield curve had resembled that of the German Bund, the traditional safe haven.
A decomposition of euro area and US OIS rates showed that, in the United States, the rise in longer-term OIS rates had been driven by a sharp increase in term premia, while expectations of policy rate cuts had declined. In the euro area, the decline in two-year OIS rates had been entirely driven by expectations of lower policy rates, while for longer-term rates the term premium had also fallen slightly. Hence, the reassessment of monetary policy expectations had not been the main driver of diverging interest rate dynamics on either side of the Atlantic. Instead, the key driver had been a divergence in term premia.
The recent market developments had had implications for overall financial conditions. Despite the tightening pressure stemming from the stronger euro exchange rate, indices of financial conditions had recovered to stand above their pre-April levels. The decline in euro area real risk-free interest rates across the entire yield curve had brought real yields below the level prevailing at the time of the Governing Council’s previous monetary policy meeting.
Inflation compensation had edged up in the euro area since the Governing Council’s previous monetary policy meeting. One-year forward inflation compensation two years ahead, excluding tobacco, currently stood at 1.8%, i.e. only slightly below the 2% inflation target when accounting for tobacco. Over the longer term five-year forward inflation compensation five years ahead remained well anchored around 2%. The fact that near-term inflation compensation remained below the levels seen in early 2025 could largely be ascribed to the sharp drop in oil prices.
In spite of the notable easing in financial conditions, the fading of financial market volatility, the pick-up in inflation expectations and positive macroeconomic surprises, investors’ expectations regarding ECB monetary policy had remained broadly unchanged. A 25 basis point cut was fully priced in for the present meeting, and another rate cut was priced in by the end of the year, with some uncertainty regarding the timing. Hence, expectations for ECB rates had proven relatively insensitive to the recovery in other market segments.
The global environment and economic and monetary developments in the euro area
Mr Lane started by noting that headline inflation had declined to 1.9% in May from 2.2% in April. Energy inflation had been unchanged at -3.6% in May. Food inflation had edged up to 3.3%, from 3.0%, while goods inflation had been stable at 0.6% in May and services inflation had declined to 3.2% in May, from 4.0% in April.
Most measures of underlying inflation suggested that in the medium term inflation would settle at around the 2% target on a sustained basis, in part as a result of the continuing moderation in wage growth. The annual growth rate of negotiated wages had fallen to 2.4% in the first quarter of 2025, from 4.1% in the fourth quarter of 2024. Forward-looking wage trackers continued to point to an easing in negotiated wage growth. The Eurosystem staff macroeconomic projections for the euro area foresaw a deceleration in the annual growth rate of compensation per employee, from 4.5% in 2024 to 3.2% in 2025, and to 2.8% in 2026 and 2027. The Consumer Expectations Survey also pointed to moderating wage pressures.
The short-term outlook for headline inflation had been revised down, owing to lower energy prices and the stronger euro. This was supported by market-based inflation compensation measures. The euro had appreciated strongly since early March – but had moved broadly sideways over the past few weeks. Since the April Governing Council meeting the euro had strengthened slightly against the US dollar (+0.6%) and had depreciated in nominal effective terms (-0.7%). Compared with the March projections, oil prices and oil futures had decreased substantially. As the euro had appreciated, the decline in oil prices in euro terms had become even larger than in US dollar terms. Gas prices and gas futures were also at much lower levels than at the time of the March projections.
According to the baseline in the June staff projections, headline inflation – as measured by the Harmonised Index of Consumer Prices (HICP) – was expected to average 2.0% in 2025, 1.6% in 2026 and 2.0% in 2027. Relative to the March projections, inflation had been revised down by 0.3 percentage points for both 2025 and 2026, and was unchanged for 2027. Headline inflation was expected to remain below the target for the next one and a half years. The downward revisions mainly reflected lower energy price assumptions, as well as a stronger euro. The projected increase in inflation in 2027 incorporated an expected temporary upward impact from climate-related fiscal measures – namely the new EU Emissions Trading System (ETS2). In the June baseline projections, core inflation (HICP inflation excluding energy and food) was expected to average 2.4% in 2025 and 1.9% in both 2026 and 2027. The results of the latest Survey of Monetary Analysts were broadly in line with the June projections for headline inflation in 2025 and 2027, but showed a notably less pronounced undershoot for 2026. Most measures of longer-term inflation expectations remained at around the 2% target, which supported the sustainable return of inflation to target. At the same time, markets were pricing in an extended phase of below-target inflation, with the one-year forward inflation-linked swap rate two years ahead and the one-year forward rate three years ahead averaging 1.8%.
The frontloading of imports in anticipation of higher tariffs had contributed to stronger than expected global trade growth in the first quarter of the year. However, high-frequency data pointed to a significant slowdown of trade in May. Excluding the euro area, global GDP growth had moderated to 0.7% in the first quarter, down from 1.1% in the fourth quarter of 2024. The global manufacturing Purchasing Managers’ Index (PMI) excluding the euro area continued to signal stagnation, edging down to 49.6 in May, from 50.0 in April. The forward-looking PMI for new manufacturing orders remained below the neutral threshold of 50. Compared with the March projections, euro area foreign demand had been revised down by 0.4 percentage points for 2025 and by 1.4 percentage points for 2026. Growth in euro area foreign demand was expected to decline to 2.8% in 2025 and 1.7% in 2026, before recovering to 3.1% in 2027.
While Eurostat’s most recent flash estimate suggested that the euro area economy had grown by 0.3% in the first quarter, an aggregation of available country data pointed to a growth rate of 0.4%. Domestic demand, exports and inventories should all have made a positive contribution to the first quarter outturn. Economic activity had likely benefited from frontloading in anticipation of trade frictions. This was supported by anecdotal evidence from the latest Non-Financial Business Sector Dialogue held in May and by particularly strong export and industrial production growth in some euro area countries in March. On the supply side, value-added in manufacturing appeared to have contributed to GDP growth more than services for the first time since the fourth quarter of 2023.
Survey data pointed to weaker euro area growth in the second quarter amid elevated uncertainty. Uncertainty was also affecting consumer confidence: the Consumer Expectations Survey confidence indicator had dropped in April, falling to its lowest level since Russia’s invasion of Ukraine, mainly because higher-income households were more responsive to changing economic conditions. A saving rate indicator based on the same survey had also increased in annual terms for the first time since October 2023, likely reflecting precautionary motives for saving.
The labour market remained robust. According to Eurostat’s flash estimate, employment had increased by 0.3% in the first quarter of 2025, from 0.1% in the fourth quarter of 2024. The unemployment rate had remained broadly unchanged since October 2024 and had stood at a record low of 6.2% in April. At the same time, demand for labour continued to moderate gradually, as reflected in a decline in the job vacancy rate and subdued employment PMIs. Workers’ perceptions of the labour market and of probabilities of finding a job had also weakened, according to the latest Consumer Expectations Survey.
Trade tensions and elevated uncertainty had clouded the outlook for the euro area economy. Greater uncertainty was expected to weigh on investment. Higher tariffs and the recent appreciation of the euro should weigh on exports.
Despite these headwinds, conditions remained in place for the euro area economy to strengthen over time. In particular, a strong labour market, rising real wages, robust private sector balance sheets and less restrictive financing conditions following the Governing Council’s past interest rate cuts should help the economy withstand the fallout from a volatile global environment. In addition, a rebound in foreign demand later in the projection horizon and the recently announced fiscal support measures were expected to bolster growth over the medium term. In the June projections, the fiscal deficit was now expected to be 3.1% in 2025, 3.4% in 2026 and 3.5% in 2027. The higher deficit path was mostly due to the additional fiscal package related to higher defence and infrastructure spending in Germany. The June projections foresaw annual average real GDP growth of 0.9% in 2025, 1.1% in 2026 and 1.3% in 2027. Relative to the March projections, the outlook for GDP growth was unchanged for 2025 and 2027 and had been revised down by 0.1 percentage points for 2026. The unrevised growth projection for 2025 reflected a stronger than expected first quarter combined with weaker prospects for the remainder of the year.
In the current context of high uncertainty, Eurosystem staff had also assessed how different trade policies, and the level of uncertainty surrounding these policies, could affect growth and inflation under some alternative illustrative scenarios, which would be published with the staff projections on the ECB’s website. If the trade tensions were to escalate further over the coming months, staff would expect growth and inflation to be below their baseline projections. By contrast, if the trade tensions were resolved with a benign outcome, staff would expect growth and, to a lesser extent, inflation to be higher than in the baseline projections.
Turning to monetary and financial conditions, risk-free interest rates had remained broadly unchanged since the April meeting. Equity prices had risen and corporate bond spreads had narrowed in response to better trade news. While global risk sentiment had improved, the euro had stayed close to the level it had reached as a result of the deepening of trade and financial tensions in April. At the same time, sentiment in financial markets remained fragile, especially as suspensions of higher US tariff rates were set to expire starting in early July.
Lower policy rates continued to be transmitted to lending conditions for firms and households. The average interest rate on new loans to firms had declined to 3.8% in April, from 3.9% in March, with the cost of issuing market-based debt unchanged at 3.7%. Consistent with these patterns, bank lending to firms had continued to strengthen gradually, growing by an annual rate of 2.6% in April, after 2.4% in March, while corporate bond issuance had been subdued. The average interest rate on new mortgages had stayed at 3.3% in April, while growth in mortgage lending had increased to 1.9%, from 1.7% in March. Annual growth in broad money, as measured by M3, had picked up in April to 3.9%, from 3.7% in March.
Monetary policy considerations and policy options
In summary, inflation was currently at around the 2% target. While this in part reflected falling energy prices, most measures of underlying inflation suggested that inflation would settle at this level on a sustained basis in the medium term. This medium-term outlook was underpinned by the expected continuing moderation in services inflation as wage growth decelerated. The current indications were that rising barriers to global trade would likely have a disinflationary impact on the euro area in 2025 and 2026, as reflected in the June baseline and the staff scenarios. However, the possibility that a deterioration in trade relations would put upward pressure on inflation through supply chain disruptions required careful ongoing monitoring. Under the baseline, only a limited revision was seen to the path of GDP growth, but the headwinds to activity would be stronger under the severe scenario. Broadly speaking, monetary transmission was proceeding smoothly, although high uncertainty reduced its strength.
Based on this assessment, Mr Lane proposed lowering the three key ECB interest rates by 25 basis points, taking the deposit facility rate to 2.0%. The June projections were conditioned on a rate path that included a one-quarter of a percentage point reduction in the deposit facility rate in June. By supporting the pricing pressure needed to generate target-consistent inflation in the medium term, this cut would help ensure that the projected deviation of inflation below the target in 2025-26 remained temporary and did not turn into a longer-term deviation. By demonstrating that the Governing Council was determined to make sure that inflation returned to target in the medium term, the rate reduction would help underpin inflation expectations and avoid an unwarranted tightening in financial conditions. The proposal was also robust across the different trade policy scenarios prepared by staff.
2. Governing Council’s discussion and monetary policy decisions
Economic, monetary and financial analyses
On the global environment, growth in the world economy (outside the euro area) was expected to slow in 2025 and 2026 compared with 2024. This slowdown reflected developments in the United States – although China would also be affected – and would result in slower growth in euro area foreign demand. These developments were seen to stem mainly from trade policy measures enacted by the US Administration and reactions from China and other countries.
Members underlined that the outlook for the global economy remained highly uncertain. Elevated trade uncertainty was likely to prevail for some time and could broaden and intensify, beyond the most recent announcements of tariffs on steel and aluminium. Further tariffs could increase trade tensions, as well as the likelihood of retaliatory actions and the prospect of non-linear effects, as retaliation would increasingly affect intermediate goods. While high-frequency trackers of global economic activity and trade had remained relatively resilient in the first quarter of 2025 (partly reflecting frontloading), indicators for April and May already suggested some slowdown. The euro had appreciated in nominal effective terms since the March 2025 projection exercise, although not by as much as it had strengthened against the US dollar. Another noteworthy development was the sharp decline in energy commodity prices, with both crude oil and natural gas prices now expected to be substantially lower than foreseen in the March projections (on the basis of futures prices). Developments in energy prices and the exchange rate were seen as the main drivers of the dynamics of euro area headline inflation at present.
Members extensively discussed the trade scenarios prepared by Eurosystem staff in the context of the June projection exercise. Such scenarios should assist in identifying the relevant channels at work and could provide a quantification of the impact of tariffs and trade policy uncertainty on growth, the labour market and inflation, in conjunction with regular sensitivity analyses. The baseline assumption of the June 2025 projection exercise was that tariffs would remain at the May 2025 level over the projection horizon and that uncertainty would remain elevated, though gradually declining. Recognising the high level of uncertainty currently surrounding US trade policies, two alternative scenarios had been considered for illustrative purposes. One was a “mild” scenario of lower tariffs, incorporating the “zero-for-zero” tariff proposal for industrial goods put forward by the European Commission and a faster reduction in trade policy uncertainty. The other was a “severe” scenario which assumed that tariffs would revert to the higher levels announced in April and also included retaliation by the EU, with trade policy uncertainty remaining elevated.
In the first instance, it was underlined that the probability that could be attached to the baseline projection materialising was lower than in normal times. Accordingly, a higher probability had to be attached to alternative possible outcomes, including potential non-linearities entailed in jumping from one scenario to another, and the baseline provided less guidance than usual. Mixed views were expressed, however, on the likelihood of the scenarios and on which would be the most relevant channels. On the one hand, the mild scenario was regarded as useful to demonstrate the benefits of freeing trade rather than restricting it. However, at the current juncture there was relatively little confidence that it would materialise. Regarding the severe scenario, the discussion did not centre on its degree of severity but rather on whether it adequately captured the possible adverse ramifications of substantially higher tariffs. One source of additional stress was related to dislocations in financial markets. Moreover, downward pressure on inflation could be amplified if countries with overcapacity rerouted their exports to the euro area. More pressure could come from energy prices falling further and the euro appreciating more strongly. It was remarked that in all the scenarios, the main impact on activity and inflation appeared to stem from higher policy uncertainty rather than from the direct impact of higher tariffs.
A third focus of the discussion regarded possible adverse supply-side effects. The argument was made that the scenarios presented in the staff projections were likely to underestimate the upside risks to inflation, because tariffs were modelled as a negative demand shock, while supply-side effects were not taken into account. While it was noted that, thus far, no significant broad-based supply-side disturbances had materialised, restrictions on trade in rare earths were cited as an example of adverse supply chain effects that had already occurred. Moreover, the experiences after the pandemic and after Russia’s unjustified invasion of Ukraine served as cautionary reminders that supply-side effects, if and when they occurred, could be non-linear in nature and impact. In this respect, potential short-term supply chain disruptions needed to be distinguished from longer-term trends such as deglobalisation. Reference was made to an Occasional Paper published in December 2024 on trade fragmentation entitled “Navigating a fragmenting global trading system: insights for central banks”, which had considered the implications of a splitting of trading blocs between the East and the West. While such detailed sectoral analysis could serve as a useful “satellite model”, it was not part of the standard macroeconomic toolkit underpinning the projections. At the same time, it was noted that large supply-side effects from trade fragmentation could themselves trigger negative demand effects.
Against this background, it was argued that retaliatory tariffs and non-linear effects of tariffs on the supply side of the economy, including through structural disruption and fragmentation of global supply chains, might spur inflationary pressures. In particular, inflation could be higher than in the baseline in the short run if the EU took retaliatory measures following an escalation of the tariff war by the United States, and if tariffs were imposed on products that were not easily substitutable, such as intermediate goods. In such a scenario, tariffs and countermeasures could ripple through the global economy via global supply chains. Firms suffering from rising costs of imported inputs would over time likely pass these costs on to consumers, as the previous erosion of profit margins made cost absorption difficult. Over the longer term a reconfiguration of global supply chains would probably make production less efficient, thereby reversing earlier gains from globalisation. As a result, the inflationary effects of tariffs on the supply side could outweigh the disinflationary pressure from reduced foreign demand and therefore pose upside risks to the medium-term inflation outlook.
With regard to euro area activity, the economy had proven more resilient in the first quarter of 2025 than had been expected, but the outlook remained challenging. Preliminary estimates of euro area real GDP growth in the first quarter suggested that it had not only been stronger than previously anticipated but also broader-based, and recent updates based on the aggregation of selected available country data suggested that there could be a further upward revision. Frontloading of activity and trade ahead of prospective tariffs had likely played a significant role in the stronger than expected outturn in the first quarter, but the broad-based expansion was a positive signal, with data suggesting growth in most demand components, including private consumption and investment. In particular, attention was drawn to the likely positive contribution from investment, which had been expected to be more adversely affected by trade policy uncertainty. It was also felt that the underlying fundamentals of the euro area were in a good state, and would support economic growth in the period ahead. Notably, higher real incomes and the robust labour market would allow households to spend more. Rising government investment in infrastructure and defence would also support growth, particularly in 2026 and 2027. These solid foundations for domestic demand should help to make the euro area economy more resilient to external shocks.
At the same time, economic growth was expected to be more subdued in the second and third quarters of 2025. This assessment reflected in part the assumed unwinding of the frontloading that had occurred in the first quarter, the implementation of some of the previously announced trade restrictions and ongoing uncertainty about future trade policies. Indeed, recent real-time indicators for the second quarter appeared to confirm the expected slowdown. Composite PMI data for April and May pointed to a moderation, both in current activity and in more forward-looking indicators, such as new orders. It was noted that a novel feature of the latest survey data was that manufacturing indicators were above those for services. In fact, the manufacturing sector continued to show signs of a recovery, in spite of trade policy uncertainty, with the manufacturing PMI standing at its highest level since August 2022. The PMIs for manufacturing output and new orders had been in expansionary territory for three months in a row and expectations regarding future output were at their highest level for more than three years.
While this was viewed as a positive development, it partly reflected a temporary boost to manufacturing, stemming from frontloading of exports, which masked potential headwinds for exporting firms in the months ahead that would be further reinforced by a stronger euro. While there was considerable volatility in export developments at present, the expected profile over the entire projection horizon had been revised down substantially in the past two projection exercises. In addition, ongoing high uncertainty and trade policy unpredictability were expected to weigh on investment. Furthermore, the decline in services indicators was suggestive of the toll that trade policy uncertainty was taking on economic sentiment more broadly. Overall, estimates for GDP growth in the near term suggested a significant slowdown in growth dynamics and pointed to broadly flat economic activity in the middle of the year.
Looking ahead, broad agreement was expressed with the June 2025 Eurosystem staff projections for growth, although it was felt that the outlook was more clouded than usual as a result of current trade policy developments. It was noted that stronger than previously expected growth around the turn of the year had provided a marked boost to the annual growth figure, with staff expecting an average of 0.9% for 2025. However, it was observed that the unrevised projection for 2025 as a whole concealed a stronger than previously anticipated start to the year but a weaker than previously projected middle part of the year. Thus, the expected pick-up in growth to 1.1% in 2026 also masked an anticipated slowdown in the middle of 2025. Staff expected growth to increase further to 1.3% in 2027. Some scepticism was expressed regarding the much stronger quarterly growth rates foreseen for 2026 following essentially flat quarterly growth for the remainder of 2025.
All in all, it was felt that robust labour markets and rising real wages provided reasonable grounds for optimism regarding the expected pick-up in growth. Private sector balance sheets were seen to be in good shape, and part of the increase in activity foreseen for 2026 and 2027 was driven by expectations of increased government investment in infrastructure and defence. Moreover, the expected recovery in consumption was made more likely by the fact that the projections foresaw only a relatively gradual decline in the household saving rate, which was expected to remain relatively high compared with the pre-pandemic period. At the same time, it was noted that the decline in the household saving rate factored into the projections might not materialise in the current environment of elevated trade policy uncertainty. Similarly, scepticism was expressed regarding the projected rebound in housing investment, given that mortgage rates could be expected to increase in line with higher long-term interest rates. More generally, caution was expressed about the composition of the expected pick-up in activity. In recent years higher public expenditure had to some extent masked weakness in private sector activity. Looking ahead, given the economic and political constraints, public investment could turn out to be lower or less powerful in boosting economic growth than assumed in the baseline, even when abstracting from the lack of sufficient “fiscal space” in a number of jurisdictions.
Labour markets continued to represent a bright spot for the euro area economy and contributed to its resilience in the current environment. Employment continued to grow, and April data indicated that the unemployment rate, at 6.2%, was at its lowest level since the launch of the euro. The positive signals from labour markets and growth in real wages, together with more favourable financing conditions, gave grounds for confidence that the euro area economy could weather the current trade policy storm and resume a growth path once conditions became more stable. However, attention was also drawn to some indications of a gradual softening in labour demand. This was evident, in particular, in the decline in job vacancy rates. In addition, while the manufacturing employment PMI indicated less negative developments, the services sector indicator had declined in April and May. Lastly, consumer surveys suggested that workers’ expectations for the unemployment rate had deteriorated and unemployed workers’ expectations of finding a job had fallen.
With regard to fiscal and structural policies, it was argued that the boost to spending on infrastructure and defence, thus far seen as mainly concentrated in the largest euro area economy, would broadly offset the impact on activity from ongoing trade tensions. However, the time profile of the effects was seen to differ between the two shocks.
Against this background, members considered that the risks to economic growth remained tilted to the downside. The main downside risks included a possible further escalation in global trade tensions and associated uncertainties, which could lower euro area growth by dampening exports and dragging down investment and consumption. Furthermore, it was noted that a deterioration in financial market sentiment could lead to tighter financing conditions and greater risk aversion, and make firms and households less willing to invest and consume. In addition, geopolitical tensions, such as Russia’s unjustified war against Ukraine and the tragic conflict in the Middle East, remained a major source of uncertainty. On the other hand, it was noted that if trade and geopolitical tensions were resolved swiftly, this could lift sentiment and spur activity. A further increase in defence and infrastructure spending, together with productivity-enhancing reforms, would also add to growth.
In the context of structural and fiscal policies, it was felt that while the current geopolitical situation posed challenges to the euro area economy, it also offered opportunities. However, these opportunities would only be realised if quick and decisive actions were taken by economic policymakers. It was noted that monetary policy had delivered, bringing inflation back to target despite the unprecedented shocks and challenges. It was observed that now was the time for other actors (in particular the European Commission and national governments) to step up quickly, particularly as the window of opportunity was likely to be limited. This included implementing the recommendations in the reports by Mario Draghi and Enrico Letta, and projects under the European savings and investment union. These measures would not only bring benefits in their own right, but could also strengthen the international role of the euro and enhance the resilience of the euro area economy more broadly.
It was widely underlined that the present geopolitical environment made it even more urgent for fiscal and structural policies to make the euro area economy more productive, competitive and resilient. In particular, it was considered that the European Commission’s Competitiveness Compass provided a concrete roadmap for action, and its proposals, including on simplification, should be swiftly adopted. This included completing the savings and investment union, following a clear and ambitious timetable. It was also important to rapidly establish the legislative framework to prepare the ground for the potential introduction of a digital euro. Governments should ensure sustainable public finances in line with the EU’s economic governance framework, while prioritising essential growth-enhancing structural reforms and strategic investment.
With regard to price developments, members largely concurred with the assessment presented by Mr Lane. The fact that the latest release showed that headline inflation – at 1.9% in May – was back in line with the target was widely welcomed. This flash estimate (released on Tuesday, 3 June, well after the cut-off point for the June projections) showed a noticeable decline in services inflation, to 3.2% in May from 4.0% in April. The drop was reassuring, as it supported the argument that the timing of Easter and its effect on travel-related (air transport and package holiday) prices had been behind the 0.5 percentage point uptick in services inflation in April. The rate of increase in non-energy industrial goods prices had remained contained at 0.6% in May. Accordingly, core inflation had decreased to 2.3%, from 2.7% in April, more than offsetting the 0.3 percentage point increase observed in that month. Some concern was expressed about the increase in food price inflation to 3.3% in May, from 3.0% in April, but it was also noted that international food commodity prices had decreased most recently. It was widely acknowledged that consumer energy prices, which had declined by 3.6% year on year in May, were continuing to pull down the headline rate of inflation and were the key drivers of the downward revision of the inflation profile in the June projections compared with the March projections.
Looking ahead, according to the June projections headline inflation was set to average 2.0% in 2025, 1.6% in 2026 and 2.0% in 2027. It was underlined that the downward revisions compared with the March projections, by 0.3 percentage points for both 2025 and 2026, mainly reflected lower assumptions for energy prices and a stronger euro. The projections for core inflation, which was expected to average 2.4% in 2025 and 1.9% in 2026 and 2027, were broadly unchanged from the March projections.
While energy prices and exchange rates were likely to lead to headline inflation undershooting the target for some time, inflation dynamics would over the medium term increasingly be driven by the effects of fiscal policy. Hence headline inflation was on target for 2027, though this was partly due to a sizeable contribution from the implementation of ETS2. Overall, it was considered that the euro area was currently in a good place as far as inflation was concerned. There was increasing confidence that most measures of underlying inflation were consistent with inflation settling at around the 2% medium-term target on a sustained basis, even as domestic inflation remained high. While wage growth remained elevated, there was broad agreement that wages were set to moderate visibly. Furthermore, profits were assessed to be partially buffering the impact of wage growth on inflation. However, it was also remarked that firms’ profit margins had been squeezed for some time, which increased the likelihood of cost-push shocks being passed through to prices. While short-term consumer inflation expectations had edged up in April, this likely reflected the impact of news about trade tensions. Most measures of longer-term inflation expectations continued to stand at around 2%.
Regarding wage developments, it was noted that both hard data and survey data suggested that moderation was ongoing. This was supported particularly by incoming data on negotiated wages and available country data on compensation per employee. Furthermore, the ECB wage tracker pointed to a further easing of negotiated wage growth in 2025, while the staff projections saw wage growth falling below 3% in 2026 and 2027. It was noted that the projections for the rate of increase in compensation per employee – 2.8% in both 2026 and 2027 – would see wages rising just at the rate of inflation, 2.0%, plus trend productivity growth of 0.8%. It was commented, however, that compensation per employee in the first quarter of 2025 had surprised on the upside and that the decline in negotiated wage indicators was partly driven by one-off payments.
Turning to the Governing Council’s risk assessment, it was considered that the outlook for euro area inflation was more uncertain than usual, as a result of the volatile global trade policy environment. Falling energy prices and a stronger euro could put further downward pressure on inflation. This could be reinforced if higher tariffs led to lower demand for euro area exports and to countries with overcapacity rerouting their exports to the euro area. Trade tensions could lead to greater volatility and risk aversion in financial markets, which would weigh on domestic demand and would thereby also lower inflation. By contrast, a fragmentation of global supply chains could raise inflation by pushing up import prices and adding to capacity constraints in the domestic economy. A boost in defence and infrastructure spending could also raise inflation over the medium term. Extreme weather events, and the unfolding climate crisis more broadly, could drive up food prices by more than expected.
Regarding the trade scenarios, a key issue in the risk assessment for inflation was the relative roles of demand-side and supply-side effects. It was broadly felt that the potential demand-side effects of tariffs were relatively well understood in the context of standard models, where they were typically treated as equivalent to a tax on cross-border goods and services. At the same time, uncertainties remained about the magnitude of these demand factors, with milder or more severe effects relative to the baseline both judged as being plausible. It was also argued that growth and sentiment had remained resilient despite extraordinarily high uncertainty. This suggested that the persistence of uncertainty, or its effects on growth and inflation, in the severe scenario might be overstated, especially given the current positive confidence effect in the euro area visible in financial markets. The relatively small impact on inflation even in the severe scenario, which pushed GDP growth to 0% in 2026, suggested that the downside risks to inflation were limited.
Furthermore, it was noted that, while the trade policy scenarios and sensitivity analyses resulted in some variation in numbers depending on tariff assumptions, the effects were dwarfed by the impact of the assumptions for energy prices and the exchange rate, which were common to all scenarios. In this context, it was suggested that the impact of the exchange rate on inflation might be more muted than projected. First, the high level of the use of the euro as an invoicing currency limited the impact of the exchange rate on inflation. Second, the pass-through from exchange rate changes to inflation might be asymmetric, i.e. weaker in the case of an appreciation as firms sought to boost their compressed profit margins. Moreover, the analysis might be unable to properly capture the positive impact of higher confidence in the euro area, of which the stronger euro exchange rate was just one reflection. The positive effects had also been visible in sovereign bond markets, with lower spreads and reduced term premia bringing down financing costs for sovereigns and firms.
On potential supply-side effects, the experiences in the aftermath of the pandemic and Russia’s unjustified invasion of Ukraine were mentioned as pointing to risks of strong adverse supply-side effects, which could be non-linear and appear quickly. In this context, it was noted that supply-side indicators, particularly concerning supply chains and potential bottlenecks, were being monitored and tracked very closely by staff. However, sufficient evidence had not so far been collected to substantiate these factors playing a major role.
Moreover, attention was also drawn to potential disinflationary supply-side effects, for example arising from trade diversion from China. However, it was suggested that this effect was quantitatively limited. Moreover, it was argued that any large-scale trade diversion could prompt countermeasures from the EU, as was already the case in specific instances, which should attenuate disinflationary pressures.
There was some discussion of whether energy commodity prices were weak because of demand or supply effects. It was noted that this had implications for the inflation risk assessment. If the weakness was primarily due to demand effects, then inflation risks were tied to the risks to economic activity and going in the same direction. If the weakness was due to supply effects, as suggested by staff analysis, in particular to oil production increases, then risks from energy prices could go in the opposite direction. Thus if the changes to oil production were reversed, energy prices could surprise on the upside even if economic activity surprised on the downside.
Turning to the monetary and financial analysis, risk-free interest rates had remained broadly unchanged since the Governing Council’s previous monetary policy meeting on 16-17 April. Market participants were fully pricing in a 25 basis point rate cut at the current meeting. Broader financial conditions had eased in the euro area since the April meeting, with equity prices fully recovering their previous losses over the past month, corporate bond spreads narrowing and sovereign bond spreads declining to levels not seen for a long time. This was in response to more positive news about global trade policies, an improvement in global risk sentiment and higher confidence in the euro area. At the same time, it was highlighted that there had still been significant negative news about global trade policies over recent weeks. In this context, it was argued that market participants might have become slightly over-optimistic, as they had become more accustomed both to negative news and to policy reversals from the United States, and this could pose risks. It was seen as noteworthy that overall financial conditions had continued to ease recently without markets expecting a substantial further reduction in policy rates. It was also contended that the fiscal package in the euro area’s largest economy might push up the neutral rate of interest, suggesting that the recent loosening of financial conditions was even more significant when assessed against this rate benchmark.
The euro had stayed close to the level it had reached following the announcement of the German fiscal package in March and the deepening trade and financial tensions in April. In this context, structural factors could be influencing exchange rates, possibly including greater confidence in the euro area and an adverse outlook for US fiscal policies. These developments could explain US dollar weakness despite the recent increase in long-term government bond yields in the United States and their decline in the euro area. Portfolio managers had also started to rebalance away from the US dollar and US assets. If this were to continue, the euro might experience further appreciation pressures. In addition, there had recently been a significant increase in the issuance of “reverse Yankee” bonds – euro-denominated bonds issued by companies based outside the euro area and in particular in the United States – partly reflecting wider yield differentials.
In the euro area, the transmission of past interest rate cuts continued to make corporate borrowing less expensive overall, and interest rates on deposits were also still declining. At the same time, lending rates were flattening out. The average interest rate on new loans to firms had declined to 3.8% in April, from 3.9% in March, while the cost of issuing market-based debt had been unchanged at 3.7%. The average interest rate on new mortgages had stayed at 3.3% in April but was expected to increase in the near future owing to higher long-term yields since the cut-off date for the March projections.
Bank lending to firms had continued to strengthen gradually, growing by an annual rate of 2.6% in April after 2.4% in March, while corporate bond issuance had been subdued. The growth in mortgage lending had increased to 1.9%. The sustained recovery in credit was welcome, with the annual growth in credit to both firms and households now at its highest level since June 2023. It was remarked that credit growth had seemingly become resilient even though the recovery had started from, on average, higher interest rates than in previous cycles. Households’ demand for mortgages had continued to increase swiftly according to the bank lending survey. This seemed to be a natural consequence of interest rates on housing loans being already below their historical average, with mortgage demand much more sensitive to interest rates than corporate loan demand. With interest rates on corporate loans still declining, although remaining above their historical average, the latest Survey on the Access to Finance of Enterprises had also shown that firms did not see access to finance as an obstacle to borrowing, as loan applications had increased and many companies not applying for loans appeared to have sufficient internal funds. At the same time, loan demand was picking up from still subdued levels and credit growth remained fairly muted by historical standards. Furthermore, elevated uncertainty due to trade tensions and geopolitical risks was still not fully reflected in the available hard data. It was also observed that by reducing external competitiveness, the recent appreciation of the euro could affect exporters’ credit demand.
In their biannual exchange on the links between monetary policy and financial stability, members concurred that while euro area banks had remained resilient, broader financial stability risks remained elevated, in particular owing to highly uncertain and volatile global trade policies. Risks in global sovereign bond markets were also discussed, and it was noted that the euro area sovereign bond market was proving more resilient than had been the case for a long time. Macroprudential policy remained the first line of defence against the build-up of financial vulnerabilities, enhancing resilience and preserving macroprudential space.
Monetary policy stance and policy considerations
Turning to the monetary policy stance, members assessed the data that had become available since the last monetary policy meeting in accordance with the three main elements that the Governing Council had communicated in 2023 as shaping its reaction function. These comprised (i) the implications of the incoming economic and financial data for the inflation outlook, (ii) the dynamics of underlying inflation, and (iii) the strength of monetary policy transmission.
Starting with the inflation outlook, members welcomed the fact that headline inflation was currently at around the 2% medium-term target, and that this had occurred earlier than previously anticipated as a result of lower energy prices and a stronger exchange rate. Lower energy prices and a stronger euro would continue to put downward pressure on inflation in the near term, with inflation projected to fall below the target in 2026 before returning to target in 2027. Most measures of longer-term inflation expectations continued to stand at around 2%, which also supported the stabilisation of inflation around the target.
Members discussed the extent to which the projected temporary undershooting of the inflation target was a concern. Concerns were expressed that following the downward revisions to annual inflation for both 2025 and 2026, inflation was projected to be below the target for 18 months, which could be considered as extending into the medium term. It was argued that 2026 would be an important year because below-target inflation expectations could become embedded in wage negotiations and lead to downside second-round effects. It was also contended that the risk of undershooting the target for a prolonged period was due not only to energy prices and the exchange rate but also to weak demand and the expected slowdown in wage growth. In addition, the timing and effects of fiscal expansion remained uncertain. It was important to keep in mind that the inflation undershoot remaining temporary was conditional on an appropriate setting of monetary policy.
At the same time, it was highlighted that, despite the undershooting of the target in the relatively near term, which was partly due to sizeable energy base effects amplified by the appreciation of the euro, from a medium-term perspective inflation was set to remain broadly at around 2%. In view of this, it was important not to overemphasise the downside deviation, especially since it was mainly due to volatile external factors, which could easily reverse. Therefore, the risk of a sustained undershooting of the inflation target was seen as limited unless there was a sharp deterioration in labour market conditions. The return of inflation to target would be supported by the likely emergence of upside pressures on inflation, especially from fiscal policy. So, as long as the projected undershoot did not become more pronounced or affect the return to target in 2027, and provided that inflation expectations remained anchored, the soft inflation figures foreseen in the near term should be manageable.
Turning to underlying inflation, members concurred that most measures suggested that inflation would settle at around the 2% medium-term target on a sustained basis. While core inflation remained elevated, it was projected to decline to 1.9% in 2026 and remain there in 2027. This was seen as consistent with the stabilisation of inflation at target. Some other measures of underlying inflation, including domestic inflation, were still elevated but were also moving in the right direction. The projected decline in underlying inflation was expected to be supported by further deceleration in wage growth and a reduction in services inflation. Although the pace of wage growth was still strong, it had continued to moderate visibly, as indicated by incoming data on negotiated wages and available country data on compensation per employee, and profits were also partially buffering its impact on inflation. Looking ahead, underlying inflation could come under further downward pressure if the projected near-term undershooting of headline inflation lowered wage expectations, and also because large shocks to energy prices typically percolated across the economy. At the same time, fiscal policy and tariffs had the potential to generate new upward pressure on underlying inflation over the medium term.
Finally, transmission of monetary policy continued to be smooth. Looking back over a long period, it was observed that robust and data-driven monetary policy had made a significant contribution to bringing inflation back to the 2% target. The removal of monetary restriction over the past year had also been timely in helping to ensure that inflation would stabilise sustainably at around the target in the period ahead. Its transmission to lending rates had been effective, contributing to easier financing conditions and supporting credit growth. Some of the transmission from rate cuts remained in the pipeline and would continue to provide support to the economy, helping consumers and firms withstand the fallout from the volatile global environment. Concerns that increased uncertainty and a volatile market response to the trade tensions in April would have a tightening impact on financing conditions had eased. On the contrary, financial frictions appeared low in the euro area, with limited risk premia and declining term premia supporting transmission of the monetary impulse and bringing down financing costs for sovereign and corporate borrowers. At the same time, elevated uncertainty could weaken the transmission mechanism of monetary policy, possibly because of the option value of deferring consumption and investment decisions in such an environment. There also remained a risk that a deterioration in financial market sentiment could lead to tighter financing conditions and greater risk aversion, and make firms and households less willing to invest and consume.
It was contended that, after seven rate cuts, interest rates were now firmly in neutral territory and possibly already in accommodative territory. It was argued that this was also suggested by the upturn in credit growth and by the bank lending survey. However, it was highlighted that, although banks were lending more and demand for loans was rising, credit origination remained at subdued levels when compared with a range of benchmarks based on past regularities. Investment also remained weak compared with historical benchmarks.
Monetary policy decisions and communication
Against this background, almost all members supported the proposal made by Mr Lane to lower the three key ECB interest rates by 25 basis points. Lowering the deposit facility rate – the rate through which the Governing Council steered the monetary policy stance – was justified by its updated assessment of the inflation outlook, the dynamics of underlying inflation and the strength of monetary policy transmission.
A further reduction in interest rates was seen as warranted to protect the medium-term inflation target beyond 2026, in an environment in which inflation was currently at target but projected to fall below it for a temporary period. In this context, it was recalled that the staff projections were conditioned on a market curve that embedded a 25 basis point rate cut in June and about 50 basis points of cuts in total by the end of 2025. It was also noted that the staff scenarios and sensitivity analyses generally pointed to inflation being below the target in 2026. Moreover, while inflation was consistent with the target, the growth projection for 2026 had been revised slightly downwards.
The proposed reduction in policy rates should be seen as aiming to protect the “on target” 2% projection for 2027. It should ensure that the temporary undershoot in headline inflation did not become prolonged, in a context in which further disinflation in core measures was expected, the growth outlook remained relatively weak and spare capacity in manufacturing made it unlikely that slightly faster growth would translate into immediate inflationary pressures. It was argued that cutting interest rates by 25 basis points at the current meeting would leave rates in broadly neutral territory. This would keep the Governing Council well positioned to navigate the high uncertainty that lay ahead, while affording full optionality for future meetings to manage two-sided inflation risks across a wide range of scenarios. By contrast, keeping interest rates at their current levels could increase the risk of undershooting the inflation target in 2026 and 2027.
At the same time, a few members saw a case for keeping interest rates at their current levels. The near-term temporary inflation undershoot should be looked through, since it was mostly due to volatile factors such as lower energy prices and a stronger exchange rate, which could easily reverse. It remained to be seen whether and to what extent these factors would translate into lower core inflation. It was necessary to avoid reacting excessively to volatility in headline inflation at a time when domestic inflation remained high and there might be new upward pressure on underlying inflation over the medium term – from both tariffs and fiscal policy. This was especially the case after a period of above-target inflation and when the inflation expectations of firms and households were still above target, with short-term consumer inflation expectations having increased recently and inflation expectations standing above 2% across horizons. This implied that there was a very limited risk of a downward unanchoring of inflation expectations.
There were also several reasons why the projections and scenarios might be underestimating medium-term inflationary pressures. There could be upside risks from underlying inflation, in part because services inflation remained above levels compatible with a sustained return to the inflation target. The exceptional uncertainty relating to trade tensions had reduced confidence in the baseline projections and meant that there could be value in waiting to see how the trade war unfolded. In addition, although growth was only picking up gradually and there were risks to the downside, the probability of a recession was currently quite low and interest rates were already low enough not to hold back economic growth. The point was made that the labour market had proven very resilient, with the unemployment rate at a historical low and employment expanding despite prospects of higher tariffs. Given the recent re-flattening of the Phillips curve, the risk of a sustained undershooting of the inflation target was seen as limited in the absence of a sharp deterioration of labour market conditions. It was also argued that adopting an accommodative monetary policy stance would not be appropriate. In any case, the evidence suggested that such accommodation would not be very effective in an environment of high uncertainty.
In this context, it was also contended that interest rates could already be in accommodative territory. An argument was made that the neutral rate of interest had undergone a shift since early 2022, increasing substantially, and it was still likely to increase further owing to fiscal expansion and the shift from a dearth of safe assets to a government bond glut. However, it was pointed out that while expected policy rates and the term premium had increased in 2022, there was an open question as to the extent to which that reflected an increase in the neutral rate of interest or simply the removal of extraordinary policy accommodation. It was argued that the recent weakness in investment, strength of savings and still subdued credit volumes suggested that there probably had not been a significant increase in the neutral rate of interest.
With these considerations in mind, these members expressed an initial preference for keeping interest rates unchanged to allow more time to analyse the current situation and detect any sustained inflationary or disinflationary pressures. However, in light of the preceding discussion, they ultimately expressed readiness to join the consensus, with the exception of one member, who upheld a dissenting view.
Looking ahead, members reiterated that the Governing Council remained determined to ensure that inflation would stabilise sustainably at its 2% medium-term target. The Governing Council’s interest rate decisions would continue to be based on its assessment of the inflation outlook in light of the incoming economic and financial data, the dynamics of underlying inflation and the strength of monetary policy transmission. Exceptional uncertainty also underscored the importance of following a data-dependent and meeting-by-meeting approach to determining the appropriate monetary policy stance.
Given the pervasive uncertainty, the possibility of rapid changes in the economic environment and the risk of shocks to inflation in both directions, it was important for the Governing Council to retain a two-sided perspective and avoid tying its hands ahead of any future meeting. The nature and focus of data dependence might need to evolve to place more emphasis on indicators speaking to future developments. This possibly suggested placing a greater premium on examining high-frequency data, financial market data, survey data and soft information such as from corporate contacts, for example, to help gauge any supply chain problems. It was also underlined that scenarios would continue to be important in helping to assess and convey uncertainty. Against this background, it was maintained that the rate path needed to remain consistent with meeting the target over the medium term and that agility would be vital given the elevated uncertainty. At the same time, the view was expressed that monetary policy should become less reactive to incoming data. In particular, only large shocks would imply the need for a monetary policy response, as the Governing Council should be willing to tolerate moderate deviations from target as long as inflation expectations were anchored.
Turning to communication, members concurred that, in view of the latest inflation developments and projections, it was time to refer to inflation as being “currently at around the Governing Council’s 2% medium-term target” rather than saying that the disinflation process was “well on track”. It was also agreed that external communication should make clear that the alternative scenarios to be published were prepared by staff, that they were illustrative in that they only represented a subset of alternative possibilities, that they only assessed some of the mechanisms by which different trade policies could affect growth and inflation, and that their outcomes were conditional on the assumptions used.
Taking into account the foregoing discussion among the members, upon a proposal by the President, the Governing Council took the monetary policy decisions as set out in the monetary policy press release. The members of the Governing Council subsequently finalised the monetary policy statement, which the President and the Vice-President would, as usual, deliver at the press conference following the Governing Council meeting.
Monetary policy statement
Monetary policy statement for the press conference of 5 June 2025
Press release
Meeting of the ECB’s Governing Council, 3-5 June 2025
Members
- Ms Lagarde, President
- Mr de Guindos, Vice-President
- Mr Centeno
- Mr Cipollone
- Mr Demarco, temporarily replacing Mr Scicluna
- Mr Elderson
- Mr Escrivá*
- Mr Holzmann
- Mr Kazāks
- Mr Kažimír*
- Mr Knot
- Mr Lane
- Mr Makhlouf
- Mr Müller
- Mr Nagel
- Mr Panetta
- Mr Patsalides
- Mr Rehn*
- Mr Reinesch
- Ms Schnabel
- Mr Šimkus
- Mr Stournaras
- Mr Villeroy de Galhau
- Mr Vujčić
- Mr Wunsch*
- Ms Žumer Šujica, Vice Governor of Banka Slovenije
* Members not holding a voting right in June 2025 under Article 10.2 of the ESCB Statute.
Other attendees
- Ms Senkovic, Secretary, Director General Secretariat
- Mr Rostagno, Secretary for monetary policy, Director General Monetary Policy
- Mr Winkler, Deputy Secretary for monetary policy, Senior Adviser, DG Monetary Policy
Accompanying persons
- Ms Bénassy-Quéré
- Ms Brezigar
- Mr Debrun
- Mr Gavilán
- Mr Gilbert
- Mr Horváth
- Mr Kaasik
- Mr Koukoularides
- Mr Lünnemann
- Mr Madouros
- Mr Markevičius
- Ms Mauderer
- Mr Nicoletti Altimari
- Mr Novo
- Ms Raposo
- Mr Rutkaste
- Ms Schembri
- Mr Šošić
- Ms Stiftinger
- Mr Tavlas
- Mr Välimäki
Other ECB staff
- Mr Proissl, Director General Communications
- Mr Straub, Counsellor to the President
- Ms Rahmouni, Director General Market Operations
- Mr Arce, Director General Economics
- Mr Sousa, Deputy Director General Economics
Release of the next monetary policy account foreseen on 28 August 2025.
Bitcoin Preparing for New Heights
Market Picture
The crypto market capitalisation approached $3.40 trillion at the end of the day on Wednesday, adding nearly 3% in 24 hours at the time of writing. Bitcoin’s momentum towards the $110K mark created an environment for even greater gains in altcoins, with Ethereum jumping 6% and Dogecoin and Cardano rising more than 7%.
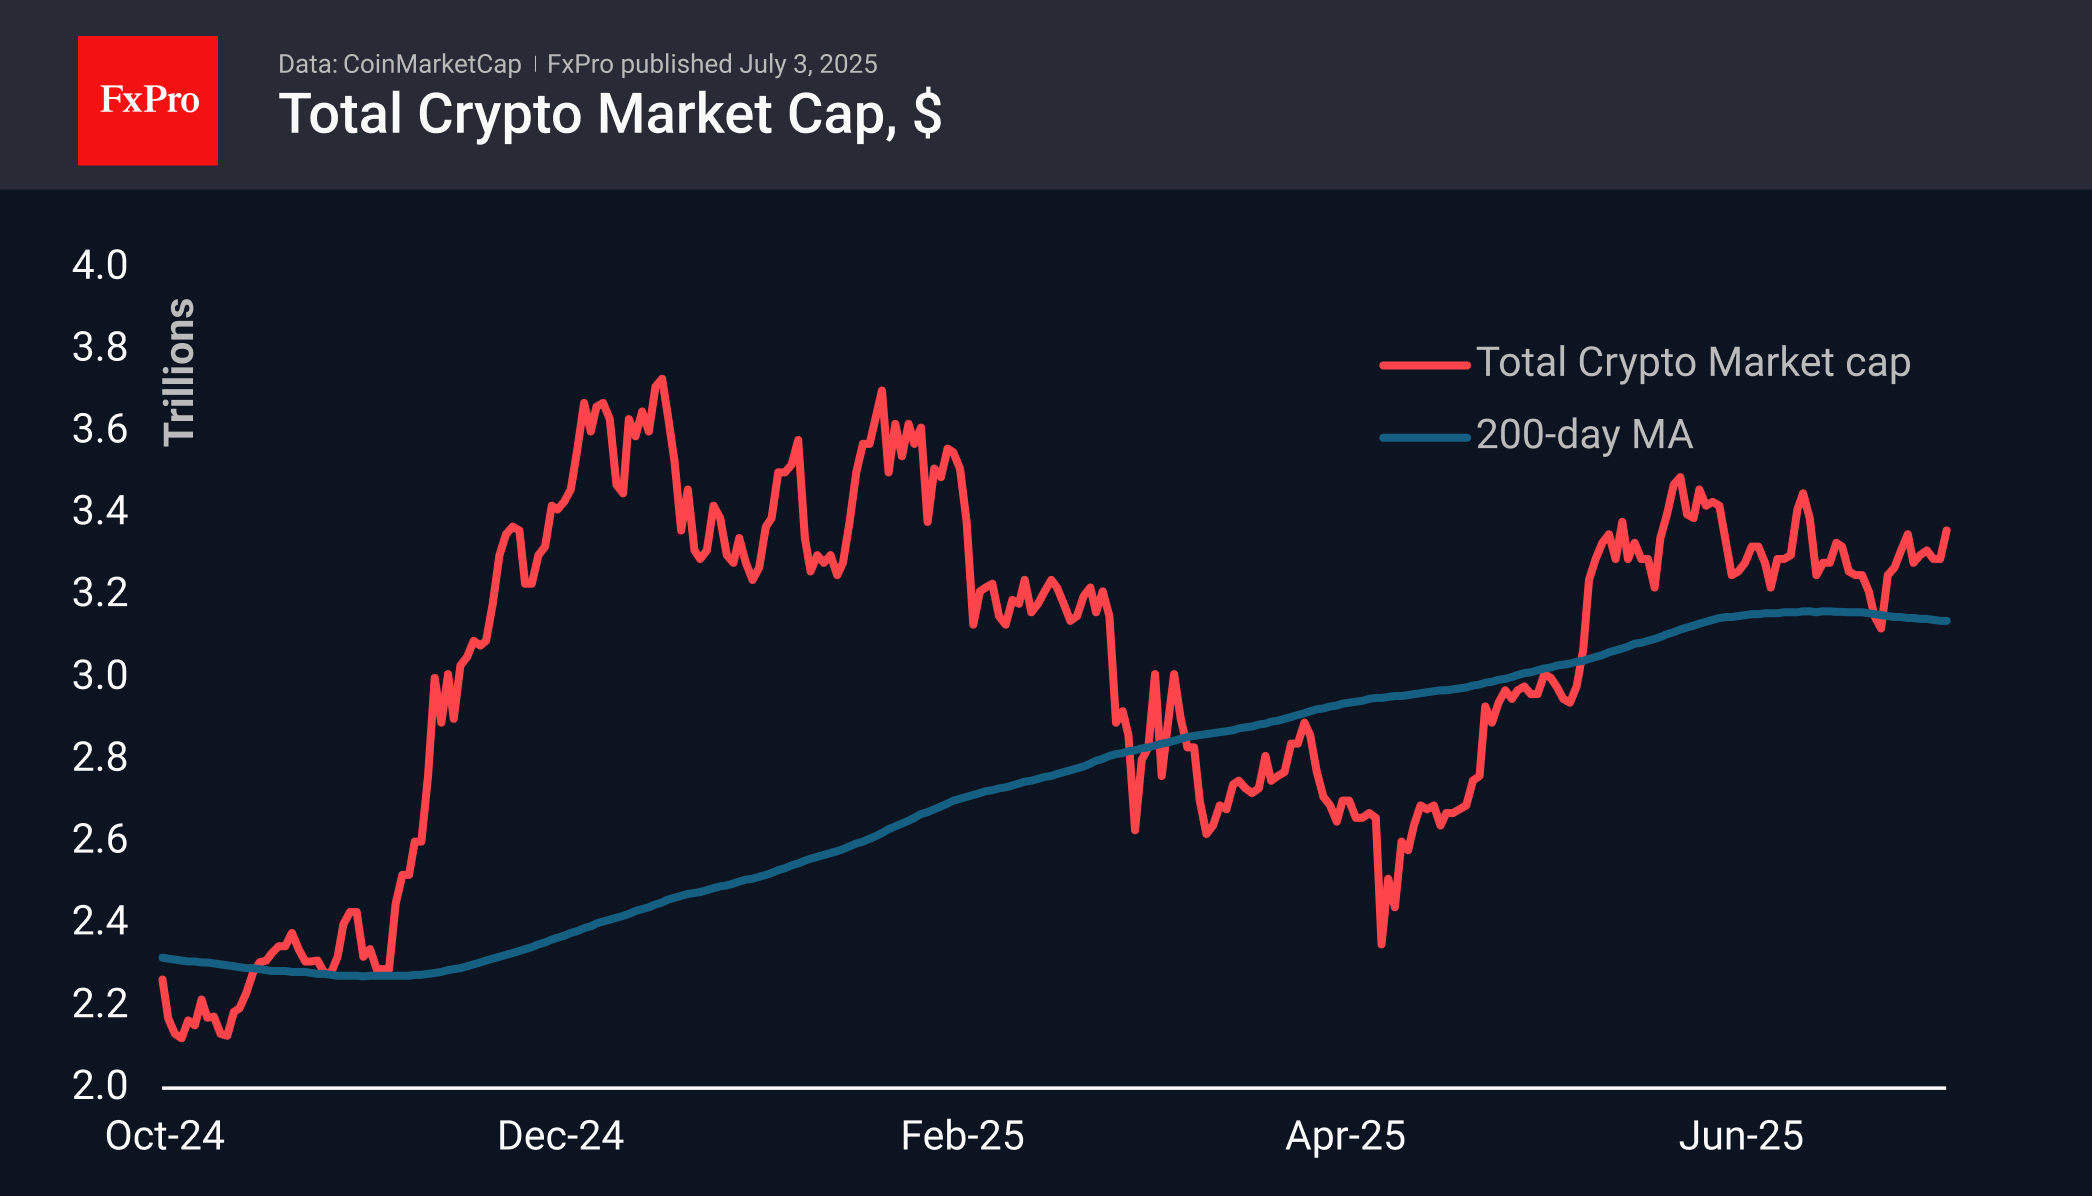
The sentiment indicator rose to 73, returning to the upper limit of the last three months’ range—an important preparatory stage for the first cryptocurrency’s further upward movement.
Bitcoin exceeded the $109.5K mark yesterday evening. A small corrective pullback at the start of the day on Thursday by 1,000 was quickly replaced by a return to the highs of early June. The historical high of around $112K, set at the end of May, may be tested for strength or updated before the end of this week, given the fairly high risk appetite in global markets. However, it is worth remembering that the monthly US employment report, due later Thursday, could serve as both a catalyst and an insurmountable obstacle.
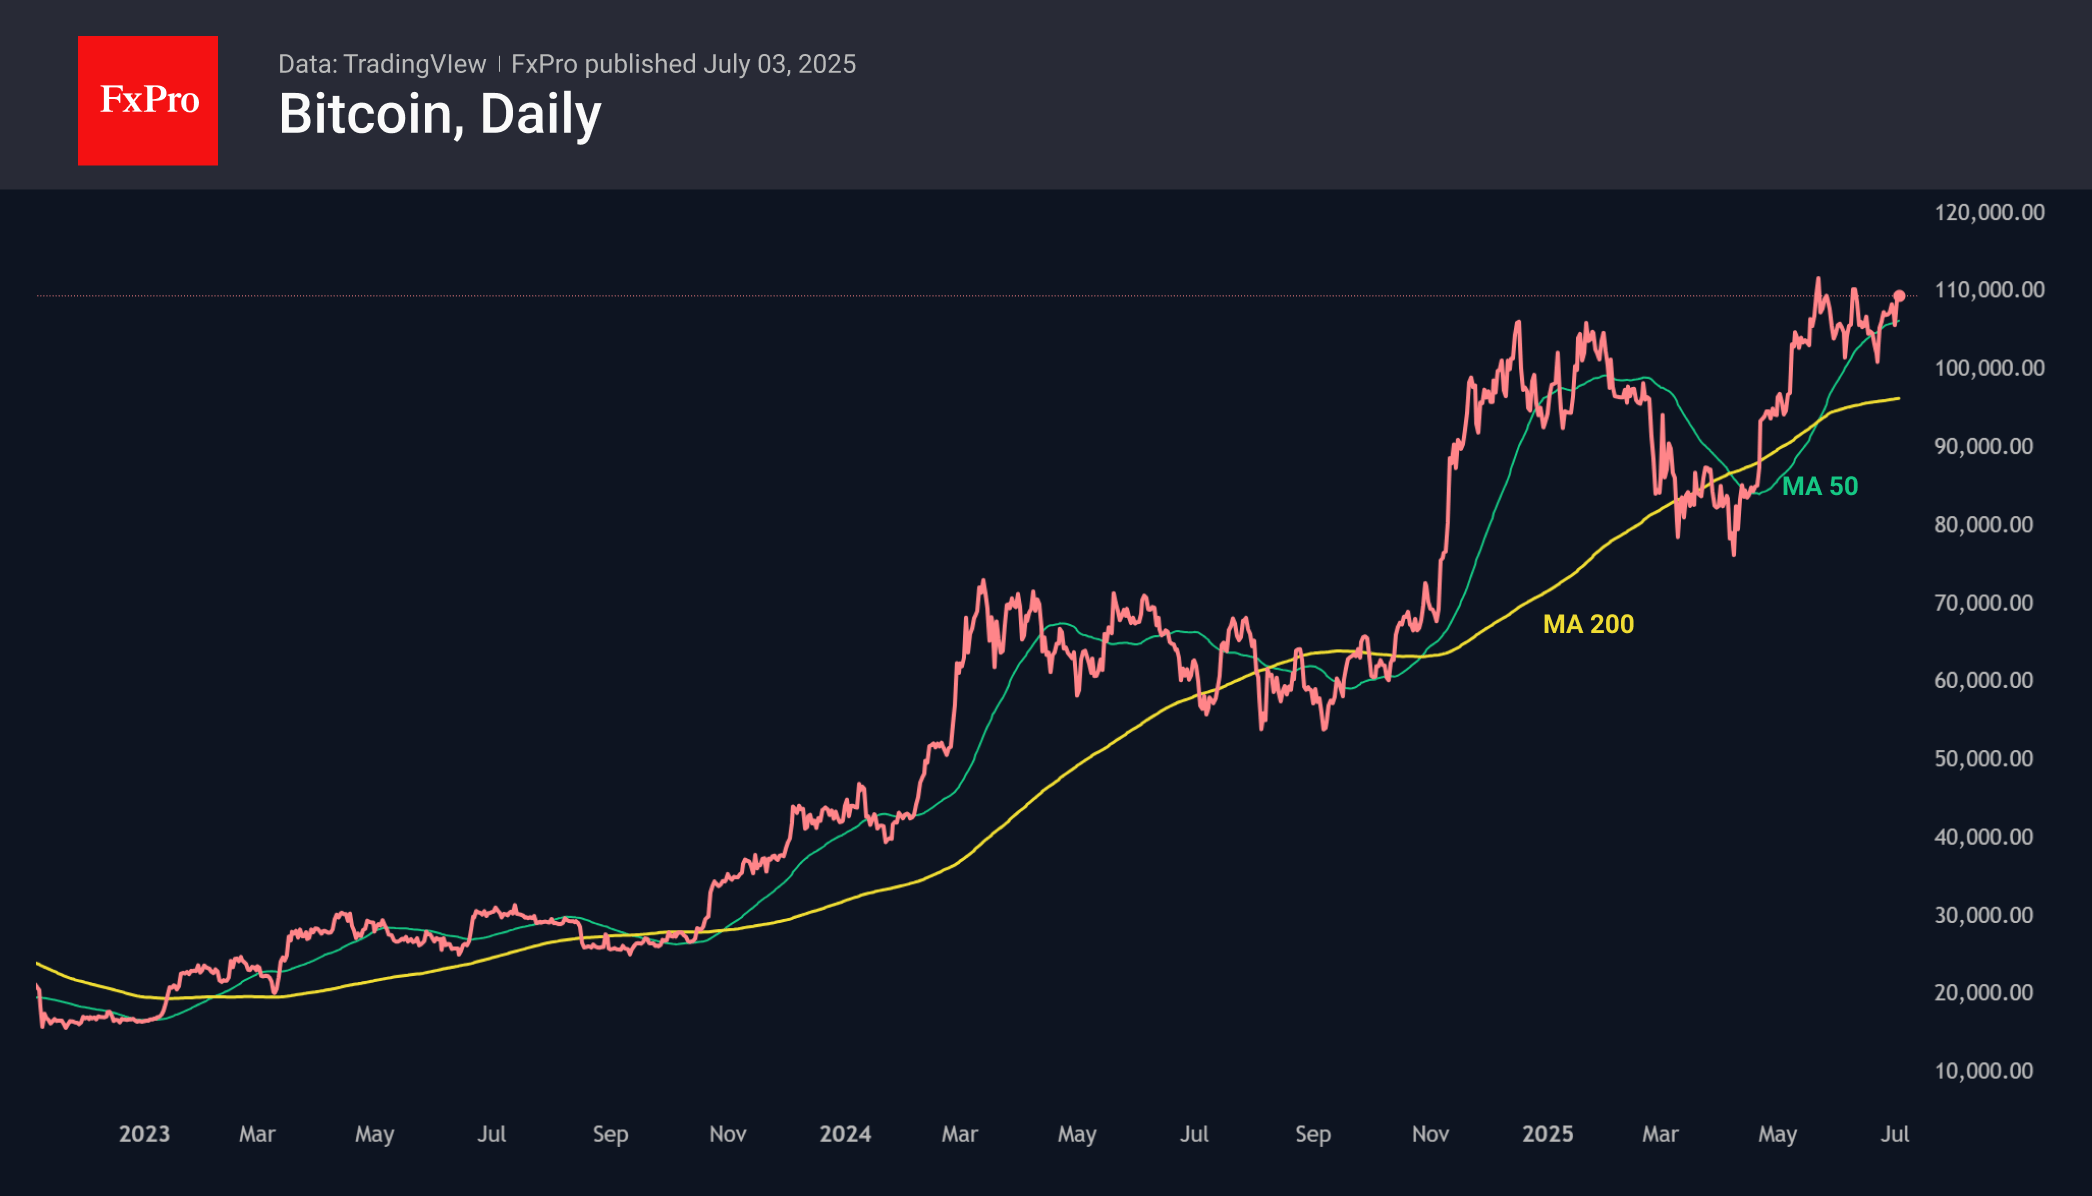
News Background
According to Glassnode, 96.7% of the first cryptocurrency’s supply is in profit, which indicates a high risk of volatility.
Public companies have outperformed ETFs in terms of Bitcoin purchases for the third quarter in a row, thanks to which BTC remains stable, according to QCP Capital. At the same time, the SEC is speeding up the approval of exchange-traded funds based on crypto assets. The regulator has approved the launch of ETFs based on Ethereum and Solana with staking capabilities and has also given the green light to the Grayscale fund, which includes BTC, ETH, XRP, SOL and ADA.
Standard Chartered predicts that Bitcoin will grow to $135,000 in the third quarter and to $200,000 by the end of this year. The main drivers of growth will be inflows into spot ETFs and corporate purchases.
According to The Block, in June, the share of decentralised exchanges (DEX) in the global volume of spot cryptocurrency trading reached a record 29.65% relative to traditional crypto exchanges (CEX). Monthly trading volume on CEX fell to its lowest level since September 2024.
According to Kronos Research, traders are switching to DEXs due to a loss of confidence in CEXs, lower fees, and a desire to store assets independently.
Elliott Wave Update: Dollar Index (DXY) Bearish Trend Intact
The Dollar Index (DXY) cycle, originating from its September 2022 peak, remains incomplete and exhibits a bearish outlook, signaling potential for further declines. The descent from the May 29, 2025 high is currently unfolding as a five-wave impulse Elliott Wave pattern. From this high, wave ((i)) concluded at 98.35, followed by a corrective rally in wave ((ii)). The rally formed as an expanded flat, peaking at 99.43 as depicted on the one-hour chart below.
Subsequently, the Index extended lower, forming a nested structure. Within this decline from wave ((ii)), wave i bottomed at 97.7, with a corrective wave ii rally reaching 98.2. Wave iii then drove the Index lower to 97, followed by wave iv peaking at 97.49. The final leg, wave v, completed at 96.37, marking the end of wave (i). Currently, a corrective rally in wave (ii) is underway, aiming to retrace the decline from the June 23, 2025 peak. This rally appears to be unfolding as a zigzag pattern, with wave a concluding at 97.15 and wave b dipping to 96.69. Wave c is expected to target the 100%–161.8% Fibonacci extension of wave a, projecting a range of 97.45–97.9.
Should the Index reach this zone, it may encounter selling pressure, potentially leading to further downside or a three-wave pullback. As long as the pivot high at 99.4 remains intact, any rally is likely to falter in a 3, 7, or 11-swing structure, reinforcing the bearish bias for additional declines.
Dollar Index 60-Minute Elliott Wave Technical Chart
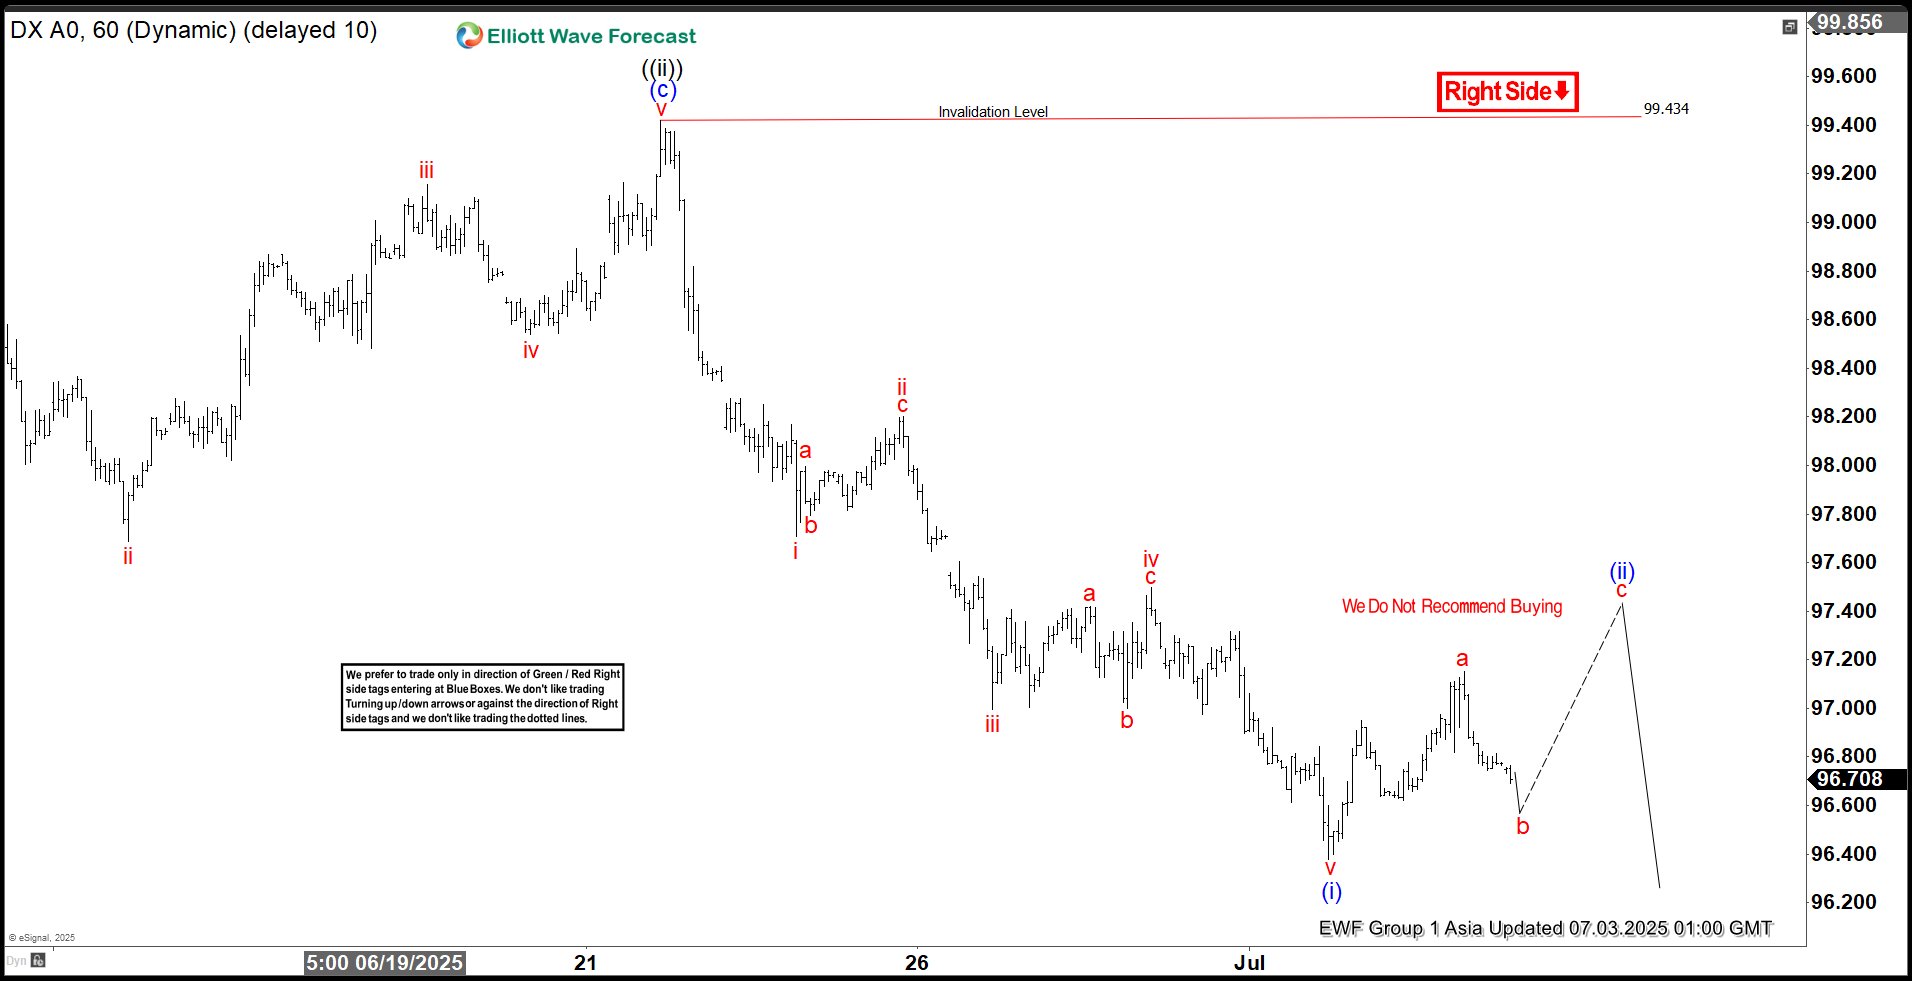
DXY Elliott Wave Technical Video
https://www.youtube.com/watch?v=H4Tv-SxWu8s
Gold Declines as Trade Optimism Reduces Safe-Haven Demand, While a Weak Dollar Limits Losses
On Thursday, the price of gold fell to 3,340 USD per troy ounce, partially correcting the previous day’s gains. The decline reflects growing optimism over trade agreements, which reduced demand for gold as a safe-haven asset.
Trade optimism weighs on gold, while geopolitical risks provide support
US President Donald Trump announced the conclusion of a trade agreement with Vietnam, under which the US will remove some tariffs on Vietnamese goods in exchange for greater market access for American products. This boosted hopes for new bilateral trade deals, easing global trade tensions.
However, gold’s losses were contained by the weak US dollar, which remains under pressure due to fiscal risks and expectations of further Fed easing. Additional support came from the ADP private sector employment report, which showed an unexpected decline, the first since early 2022. The disappointing data raised concerns about the stability of the labour market and strengthened expectations of interest rate cuts.
Meanwhile, Iran’s decision to end cooperation with the IAEA added a geopolitical risk factor, which traditionally supports gold prices.
Technical analysis of XAU/USD
On the H4 chart, XAU/USD completed a downward wave to 3,250 USD. A correction towards 3,385 USD is expected today. Once the rebound is complete, another decline to 3,250 USD remains likely. A break below this level would suggest a continuation of the downtrend towards the next local target at 3,180 USD. The MACD indicator confirms the bearish scenario, with its signal line above zero and pointing firmly upwards, indicating a corrective movement before a potential resumption of the decline.
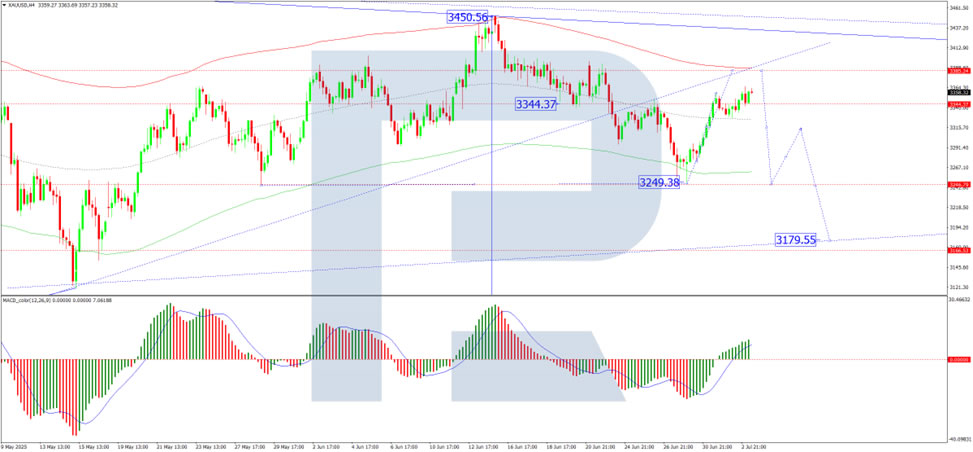
On the H1 chart, the market formed a consolidation range around 3,336 USD. An upward breakout suggests the development of a fifth growth wave towards 3,385 USD. At this level, the growth potential may be exhausted, and a subsequent decline back to 3,336 USD is likely. A break below 3,336 USD would open the way for a further drop to 3,313 USD, with the prospect of continuing towards 3,250 USD. The Stochastic oscillator confirms this view, with its signal line above 50 and heading strictly towards 80, indicating short-term upward momentum before potential reversal.
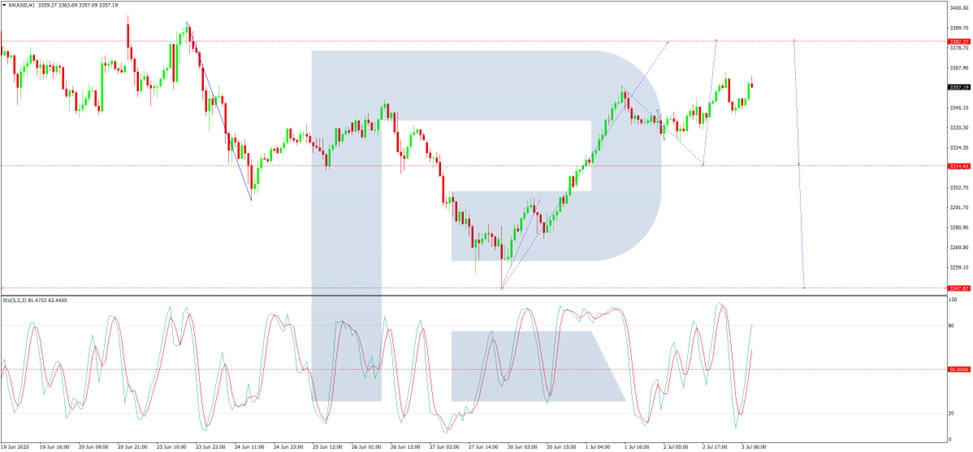
Conclusion
Gold remains under pressure due to trade optimism, but weakness in the dollar and geopolitical risks continue to provide support. Technically, a correction to 3,385 USD is expected before potential further declines to 3,250 USD and 3,180 USD. The short-term outlook favours consolidation and corrective upward movements, followed by a likely continuation of the broader downward trend.
UK PMI services finalized at 52.8, a 10-month high
UK PMI Services was finalized at 52.8 in June, up from May’s 50.9, marking the fastest pace of expansion since August 2024. Composite PMI also rose to 52.0, the highest since September. The data signals a modest but broadening recovery, driven by improving domestic demand. S&P Global's Tim Moore noted that consumer and business spending showed signs of a turnaround after a sluggish spring.
However, the rebound was tempered by "shrinking export sales", with survey respondents citing pressures from US tariffs and geopolitical uncertainty. Additionally, firms were "reluctant to turn on the hiring taps", marking the ninth straight month of job shedding.
For the BoE, input cost inflation slowed noticeably, helping to ease pressure on output prices, which saw their weakest rise in over three years. With price pressures softening and labor markets cooling, today’s report strengthens the case for the BoE to deliver another rate cut in August.

Eurozone PMI services finalized at 50.5, significance of services inflation receding into the background
Eurozone PMI Services was finalized at 50.5 in June, up from 49.7 in May. Composite PMI ticked up to 50.6 from 50.2. Although the bloc returned to modest expansion, performance remained uneven across major economies. Germany hit a three-month high at 50.4, while France fell to 49.2. Ireland, despite slowing to a five-month low, remained the strongest performer at 528. Spain (52.1) saw a slight pickup, while Italy’s reading slipped to 51.1.
Cyrus de la Rubia of Hamburg Commercial Bank noted that the services sector has been "more or less stagnant" since April. Nevertheless, Persistent labor shortages have discouraged firms from cutting jobs, helping stabilize private consumption. But a full recovery still looks elusive, with structural weaknesses continuing to weigh on growth momentum across much of the bloc.
Notably, rising input and output prices in services could be an unwelcome sign for the ECB. However, de la Rubia emphasized that broader disinflationary forces, such as Euro strength and tariff-driven downside risks, may outweigh the uptick in services inflation. While price pressure in services remains on the radar, it's significance is "receding somewhat into the background".

GBP/JPY Daily Outlook
Daily Pivots: (S1) 194.99; (P) 196.27; (R1) 197.19; More...
Intraday bias in GBP/JPY remains neutral for the moment, and more consolidations could be seen below 198.87. Deeper pullback cannot be ruled out, but outlook will stay bullish as long as 193.99 support holds. Above 198.78 will resume the rise from 184.35 to 199.79 resistance. Break there will target 100% projection of 180.00 to 199.79 from 184.35 at 204.14.
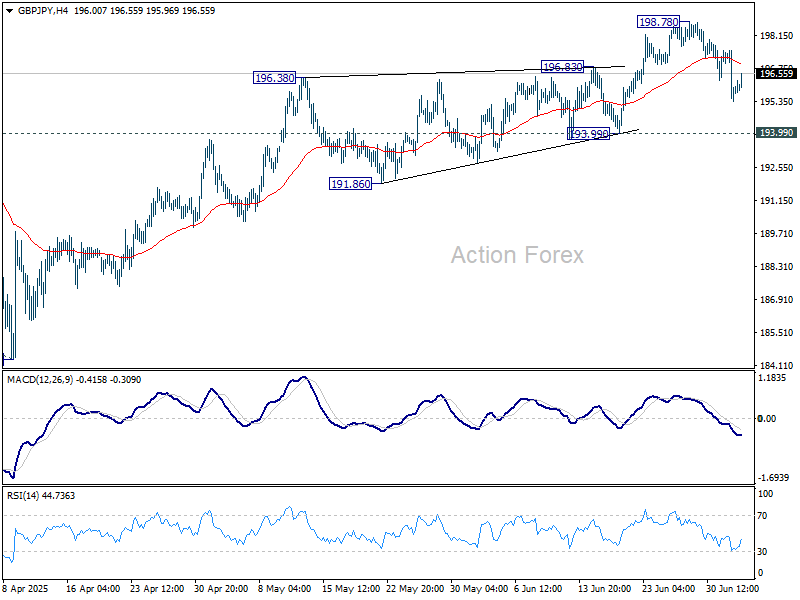
In the bigger picture, price actions from 208.09 are seen as a correction to rally from 123.94 (2020 low). Strong support should be seen from 38.2% retracement of 123.94 to 208.09 at 175.94 to contain downside. However, sustained break of 175.94 will bring deeper fall even still as a correction.