

Sample Category Title
Gold Dips, But Sentiment Turns Bullish on Long-Term Potential
Key Highlights
- Gold found support near $3,250 and started a fresh increase.
- A key bullish trend line is forming with support at $3,355 on the 4-hour chart.
- EUR/USD is moving higher above the 1.1550 resistance zone.
- WTI Crude Oil prices dipped sharply after facing rejection near $77.50.
Gold Price Technical Analysis
Gold prices remained supported above $3,250. The price formed a base and started a fresh increase above the $3,280 and $3,320 resistance levels.
The 4-hour chart of XAU/USD indicates that the price settled above the $3,375 level, the 200 Simple Moving Average (green, 4 hours), and the 100 Simple Moving Average (red, 4 hours). It even cleared the $3,440 level before the bears appeared.
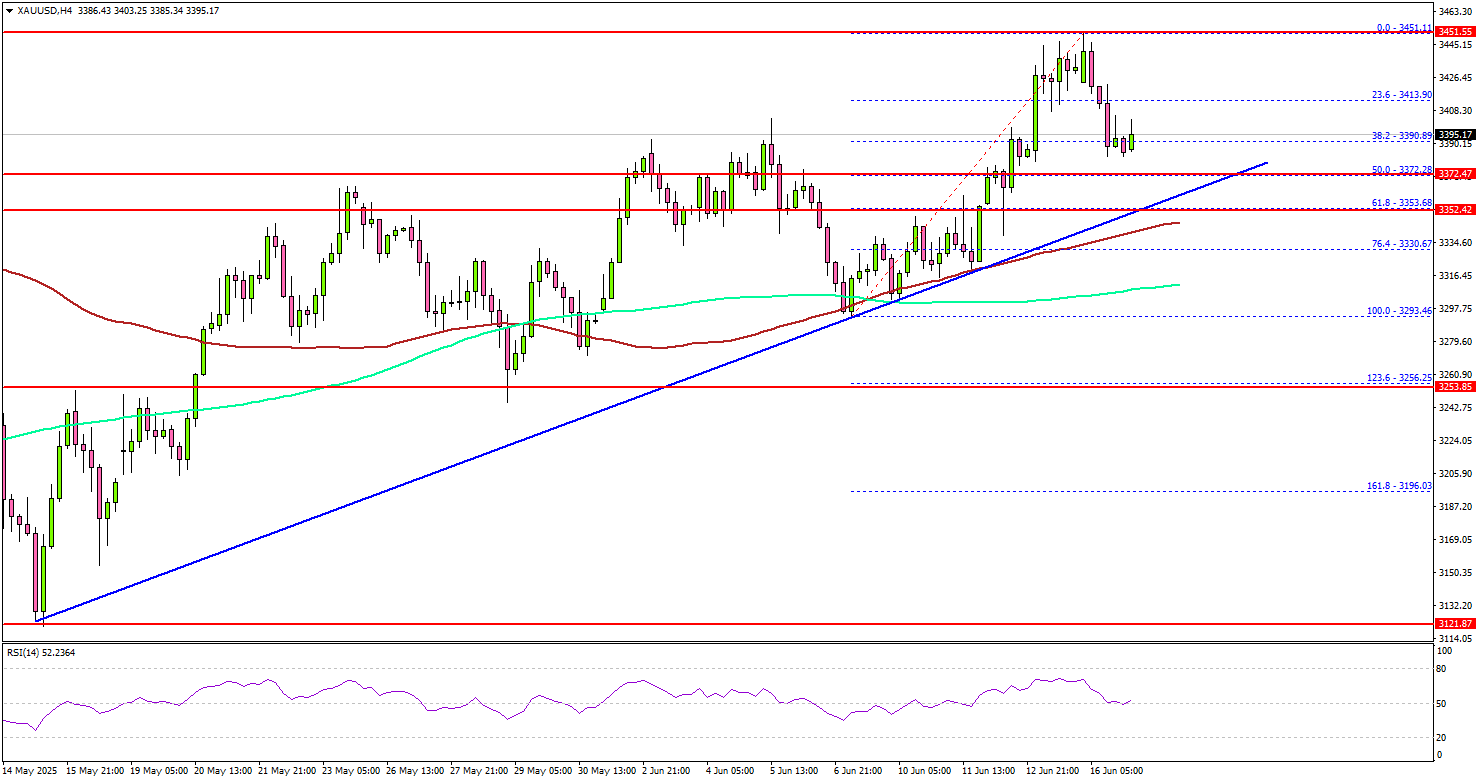
A high was formed near $3,451 and the price saw a downside correction. There was a move below $3,440. On the downside, initial support is near the $3,372 level.
The first key support is $3,355. There is also a key bullish trend line forming with support at $3,355 on the same chart. The next major support is near the $3,335 level. The main support is now $3,320. A downside break below the $3,320 support might call for more downsides. The next major support is near the $3,250 level.
On the upside, immediate resistance is near the $3,440 level. The next major resistance sits near the $3,450 level. A clear move above the $3,450 resistance could open the doors for more upsides. The next major resistance could be $3,480, above which the price could rally toward the milestone level of $3,500.
Looking at EUR/USD, the pair started a decent upward move and might soon aim for a fresh increase if it clears the 1.1650 resistance.
Economic Releases to Watch Today
- US Industrial Production for May 2025 (MoM) – Forecast +0.1%, versus 0% previous.
- US Retail Sales for May 2025 (MoM) – Forecast -0.7%, versus +0.1% previous.
USDJPY Rallies Within Range Ahead of BoJ Rate Decision
USDJPY has been range-bound between 142.30 and 146.29 since mid-May, following a five-month downtrend.
Volatility within the range has remained elevated, driven by a combination of geopolitical developments and key data releases impacting multiple asset classes.
From a geopolitical perspective, the conflict between Iran and Israel shows no clear signs of easing, with headlines emerging by the hour. Despite this, US equity markets have largely shrugged off risk-off sentiment, although they have pulled back from their intraday highs.
Tonight, between 19:00 and 20:00 ET, the Bank of Japan will announce its latest rate decision.
While no rate hike is expected, markets will be closely watching for any adjustments to the pace of government bond purchases. A more aggressive tapering stance could support the yen, while a continuation of dovish policy may keep it under pressure.
Let’s now dive into the technical setup for one of the world’s most actively traded forex pairs, ahead of key monetary policy decisions from both Japan and the United States.
Also, access key levels and zones to prepare for the upcoming BoJ and Federal Reserve Rate decisions.
USDJPY Multi-timeframe analysis from the Daily to Hourly Charts
USDJPY Daily Chart
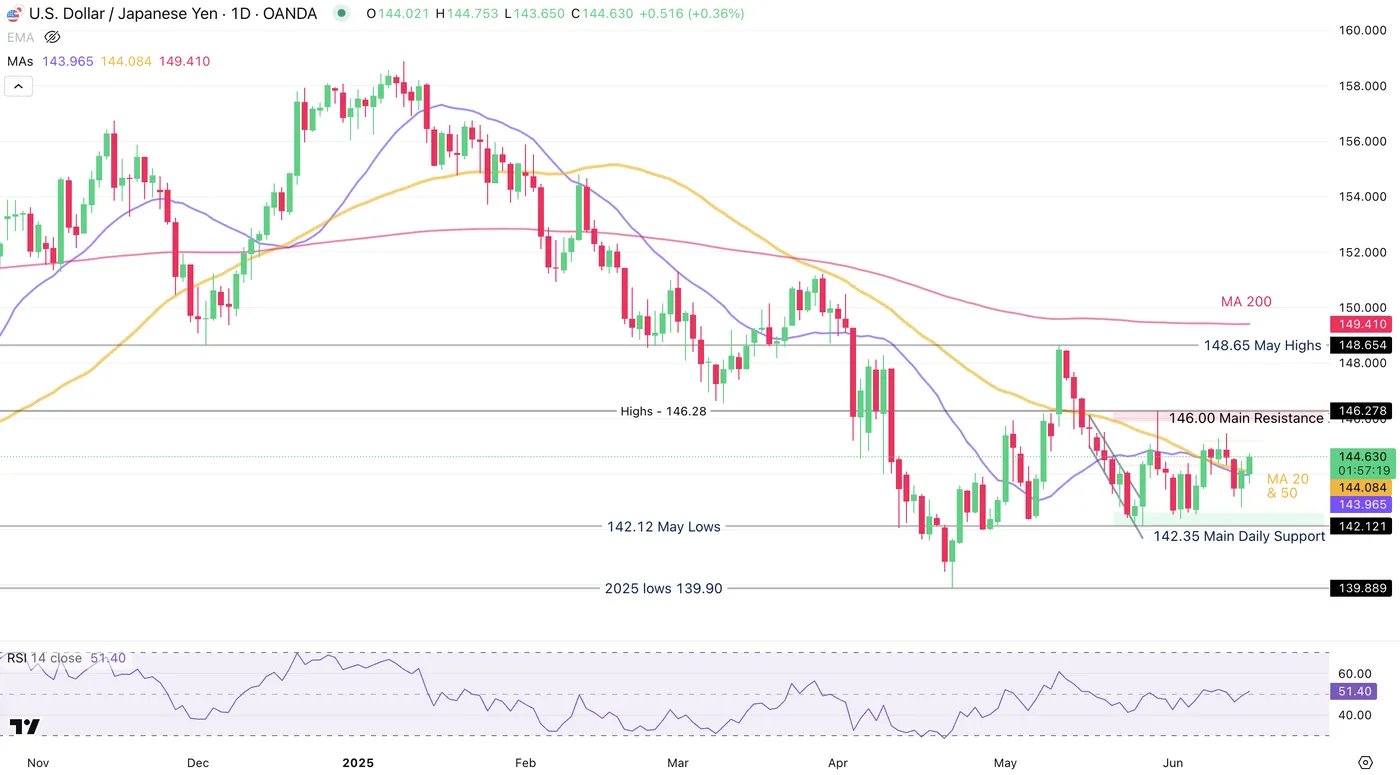
USDJPY Daily Chart, June 16, 2025 – Source: TradingView
A lack of continuation of the risk-off sentiment has added some fundamental outflows for the JPY, in research of an equilibrium price ahead of tonight's BoJ Rate decision.
Both the JPY and CHF, leaders of Thursday and Friday's action are lagging on the session.
The MA 20 and 50 on the Daily timeframe are acting as immediate support. They had been downward sloping (indicating a bearish trend) since February 2025 and are now flat, a sign of consolidation.
Momentum has been stalling on the Daily Timeframe and other intra-day timeframes as seen with the RSI stalling around the 50 Neutral Zone.
Increased volatility is likely for USDJPY as we approach the upcoming central bank decisions.
While no changes are expected to the benchmark rates from either the Federal Reserve or the Bank of Japan, traders should pay close attention to official communications, where forward guidance and policy signals will be key drivers of market reaction.
USDJPY 4H Chart
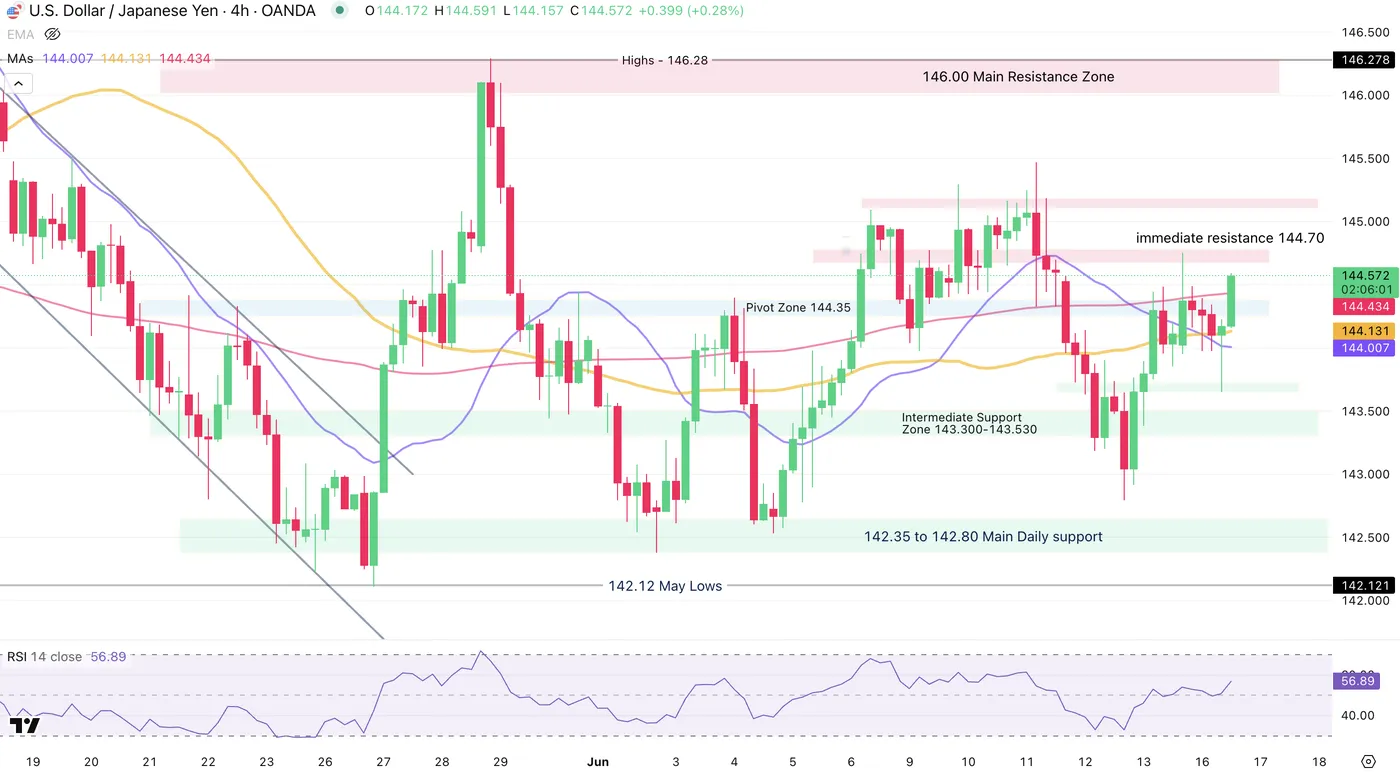
USDJPY 4H Chart, June 16, 2025 – Source: TradingView
Momentum has been fairly stable around the neutral RSI with range-bound action within the range – The current 4H Candle is a strong bullish one, see on the 1H chart for the hurdles approaching for USDJPY.
The pair has been forming a tighter range between the higher timeframe range mentioned earlier with its Resistance between 145.00 to 145.30 and Support between 142.80 to 143.30.
Expect pursued rangebound action if prices hold this zone after the two Central Bank meetings - A reminder that the Federal Reserve Rate decision is coming up on Wednesday with the release of SEP Projections.
For a breakout, expect consolidation above or below the key levels of the tighter range – More on this in the upcoming days.
USDJPY 1H Chart
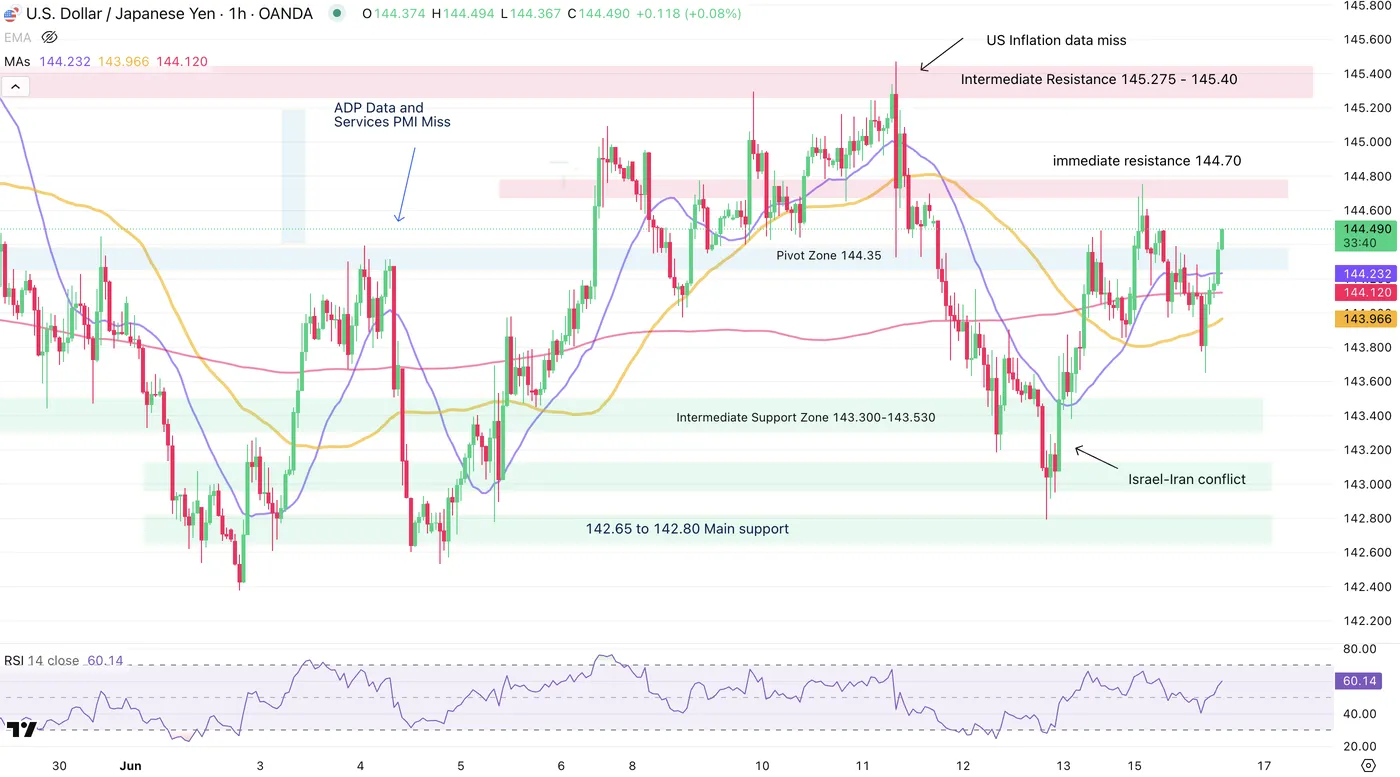
USDJPY 1H Chart, June 16, 2025 – Source: TradingView
USDJPY has been rallying since Thursday evening amid the Israel-Iran conflict that had scared markets initially before leading to a V-shape reversal in sentiment and equity prices.
1H Candles had retracted throughout the weekly open but the US dollar has had somewhat of a rebound and price action has been bullish. Momentum is still building and except for the immediate resistance (144.70 zone), prices have some margin for movement.
Levels & Zones to trade USDJPY
Support Zones
- Immediate Pivot Zone 144.35 (currently acting as support)
- Intermediate Support Zone 143.30-143.53
- 143.00 Psychological Support
- 142.35 to 142.80 Main support
Resistance Zones
- Immediate resistance 144.70
- Intermediate Resistance 145.275 - 145.40
- 146.00 Main Resistance Zone (+/- 150 pips)
Safe Trades ahead of the key Rate Decisions!
WTI Falls to $71.37 on Muted Israel-Iran Impact
Trading at ~$71.37, WTI has fallen by over 2.30% in today’s session, undoing previous gains made in the Asian session.
WTI (WTICOUSD): Key Takeaways
- Rallying to 5-month highs of ~$76.29 on Friday, WTI has retraced in today’s session, but still remains on pace for its best monthly performance since February 2021.
- Owing to the escalating conflict between Israel and Iran, fears of supply disruption surrounding the conflict have boosted crude oil pricing, with recent developments suggesting President Trump will help broker a deal between the two nations.
- Following the initial surge in pricing, comparative easing of geopolitical tensions in the Middle East has allowed crude oil pricing to fall, most notably in the Strait of Hormuz, which remains business as usual
WTI (WTICOUSD): Geopolitical tensions boost supply risk premium, crude oil rallies
Rallying more than 10% on Friday, news of Israeli airstrikes on Iranian nuclear facilities, and subsequent retaliation, remains the most significant and immediate driver of crude oil pricing.
With the Middle East renowned for both global oil production and transit, recent conflict poses a significant risk to international supply, with at least one outcome being a sharp rally in oil prices.
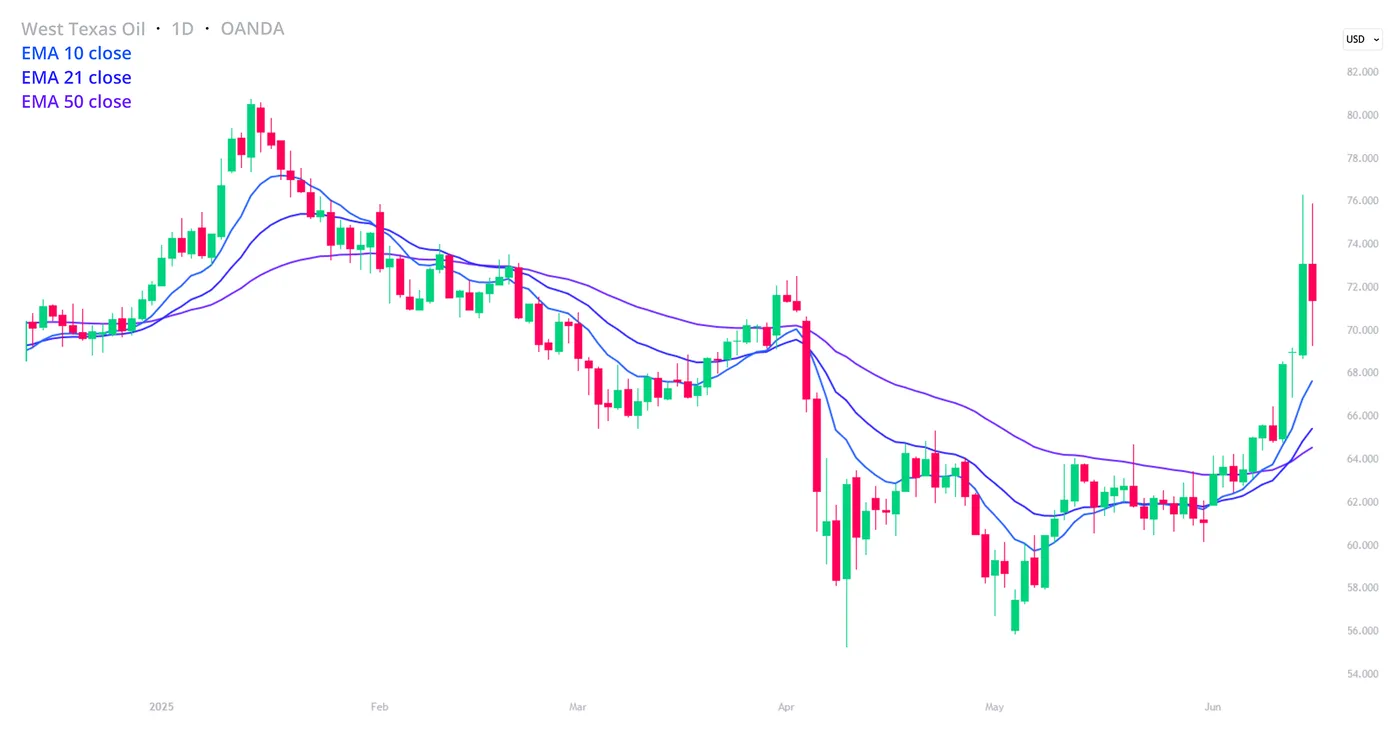
WTICOUSD,OANDA,TradingView, 16/06/2025
While market speculation and general uncertainty ran wild late last week, recent developments, courtesy of 47th US President Donald Trump, would suggest some potential for a de-escalation in tensions.
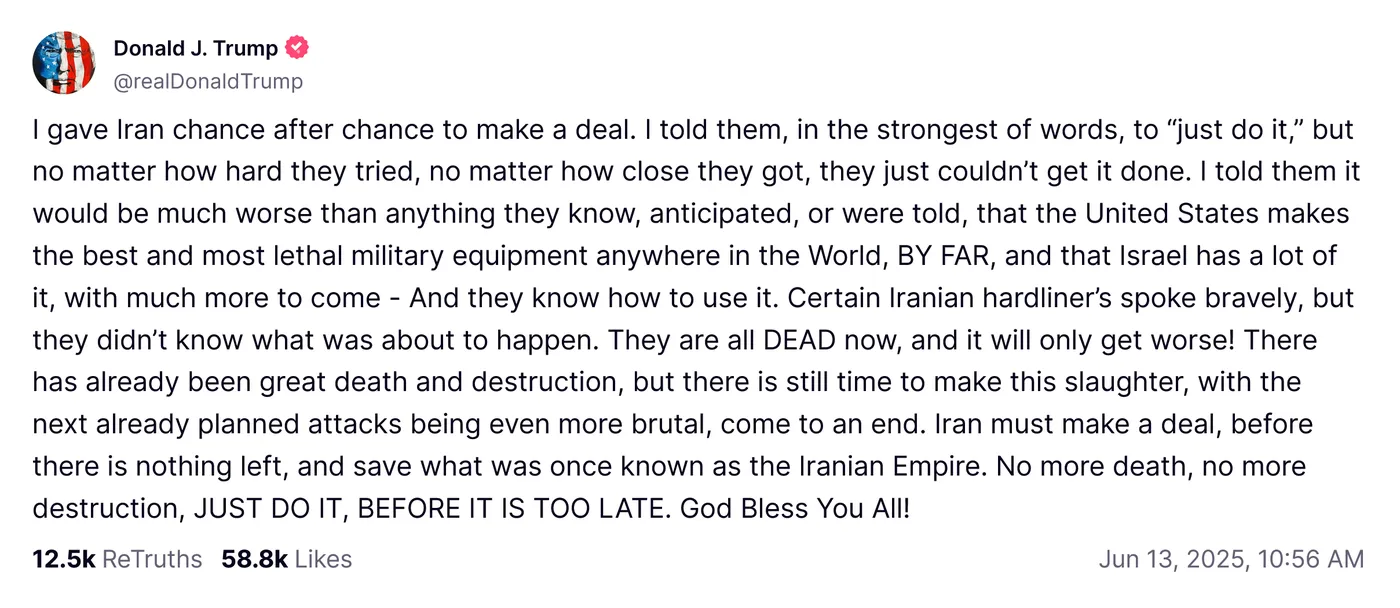
@realDonalTrump, TruthSocial, 13/06/2025
Making reference to previous successes in brokering deals, albeit self-proclaimed, via a TruthSocial post, a general air of comparative optimism surrounds current conflicts, with oil pricing cooling from highs in today’s session.
Trump also commented further over the weekend, encouraging negotiations between the two nations.
With the recent rally underpinned by a risk to supply, a key development is that the Strait of Hormuz, part of Iran’s territorial waters, remains open as usual, helping pacify market fears. Some worry it could be obstructed, or even completely closed, amid an escalation in the current conflict.
In somewhat typical market fashion, geopolitical factors often introduce immediate volatility, but sustained price levels, either higher or lower, require actual change to market fundamentals to stick the landing.
Either way, the next few days remain crucial for ongoing negotiations and by extension, crude oil pricing.
Nasdaq Leads US Indices as Market Mood Gets Euphoric
The euphoric mood in markets has not failed to surprise any players as we approach the upcoming G7 meeting.
Index futures complete their contango transition from the June to the September contracts.
For a quick reminder, a contango happens when futures pricing is above spot pricing, the more typical pricing for futures, as markets always price a time premium. This is considered positive, as markets have been trending upwards in the past 18 years.
However, the roll of futures contracts is far from the only component allowing Equities to rise: Iran's freshly announced demands for a ceasefire with Israel are taken as a optimistic development to what could have been a much more chaotic conflict;
The US hasn't even had to step in, allowing market fears to reverse sharply: All US Equity indices are trading above +1.2% on the day
The Nasdaq is once again leading gains, up 1.35% as we speak, as prices are overlapping last Thursday's highs before the risk-off sharp fall.
Let's take a look at what that infers for technical signals going into the Wednesday 18th FOMC meeting.
Nasdaq 100 Technical Analysis
Nasdaq 100 Daily Chart
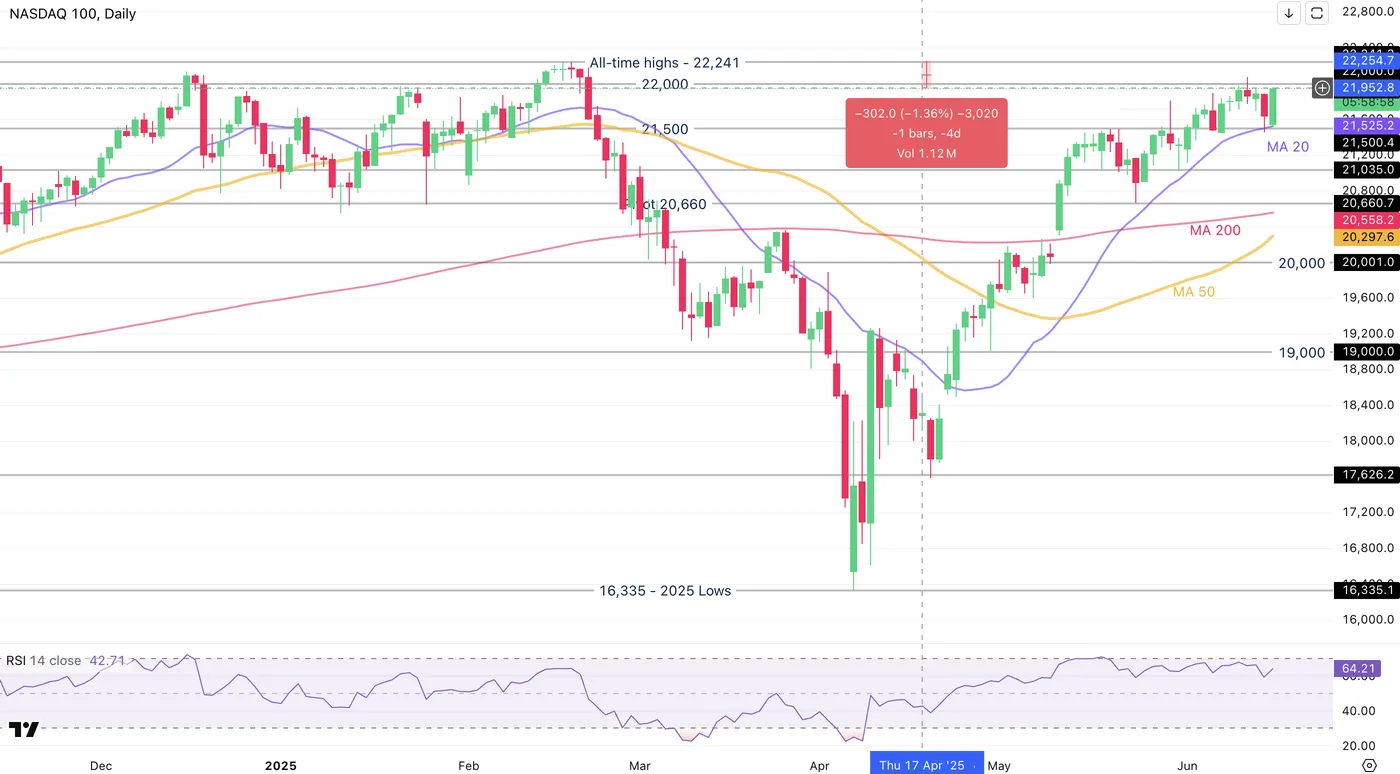
Nasdaq 100 Daily Chart, June 16, 2025 – Source: TradingView
Daily charts are showing further consolidation around and below 1.5% from the January 2025 all-time highs (22,241) – Even with the Daily RSI just hovering around overbought conditions, supported by its Moving Average 20.
The current daily candle is a bullish engulfing candle as markets erase the end-of-week correction, though prices will have to rally further to break last Wednesday post-CPI highs of 22,074.
One thing to note is that a further rise in the Index would create a Daily Golden Cross as the MA 50 gets closer to cross above the MA 200 – A typically bullish signs for Markets.
One fundamental hurdle to this outcome is a potential slowdown from buyers as key players prepare their position books for the important FOMC meeting where Summary of Economic Projections are released – the Federal Reserve's economic forecast.
Nasdaq 100 4H Chart
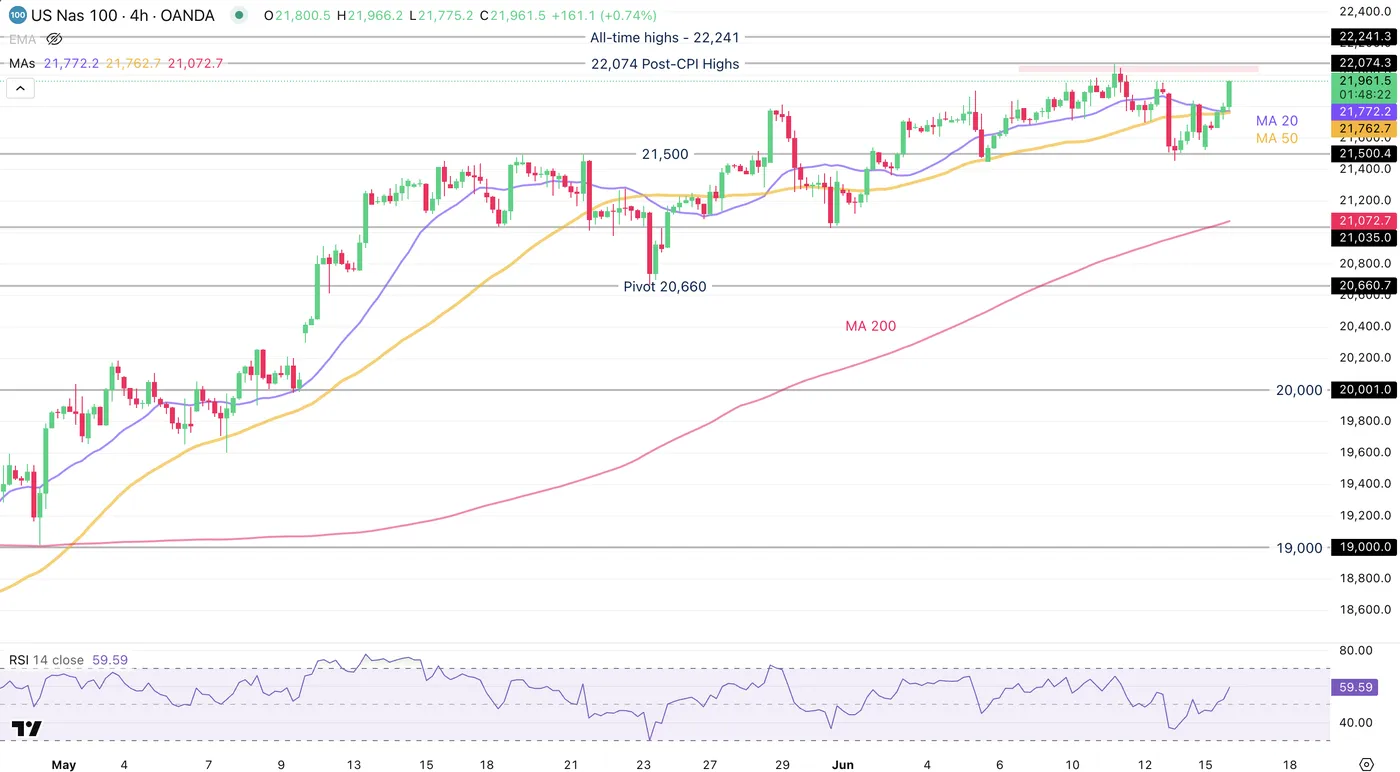
Nasdaq 100 4H Chart, June 16, 2025 – Source: TradingView
Last Thursday and Friday moves now only look like a technical healthy retracement with prices now rebounding sharply on the 4H MA 20 and 50.
Buyers will have to keep rallying towards the 22,000 psychological level – less than 50 points away. The RSI is rising and still has space before the move gets overbought.
One other fundamental hurdle is potential hawkish talk from the Bank of Japan in tonight's Rate Decision which would slow down Carry trades, which are so beneficial to US Equities.
Technical hurdles are thin though we will spot them with more details in the 1H chart right after.
Nasdaq 100 1H Chart
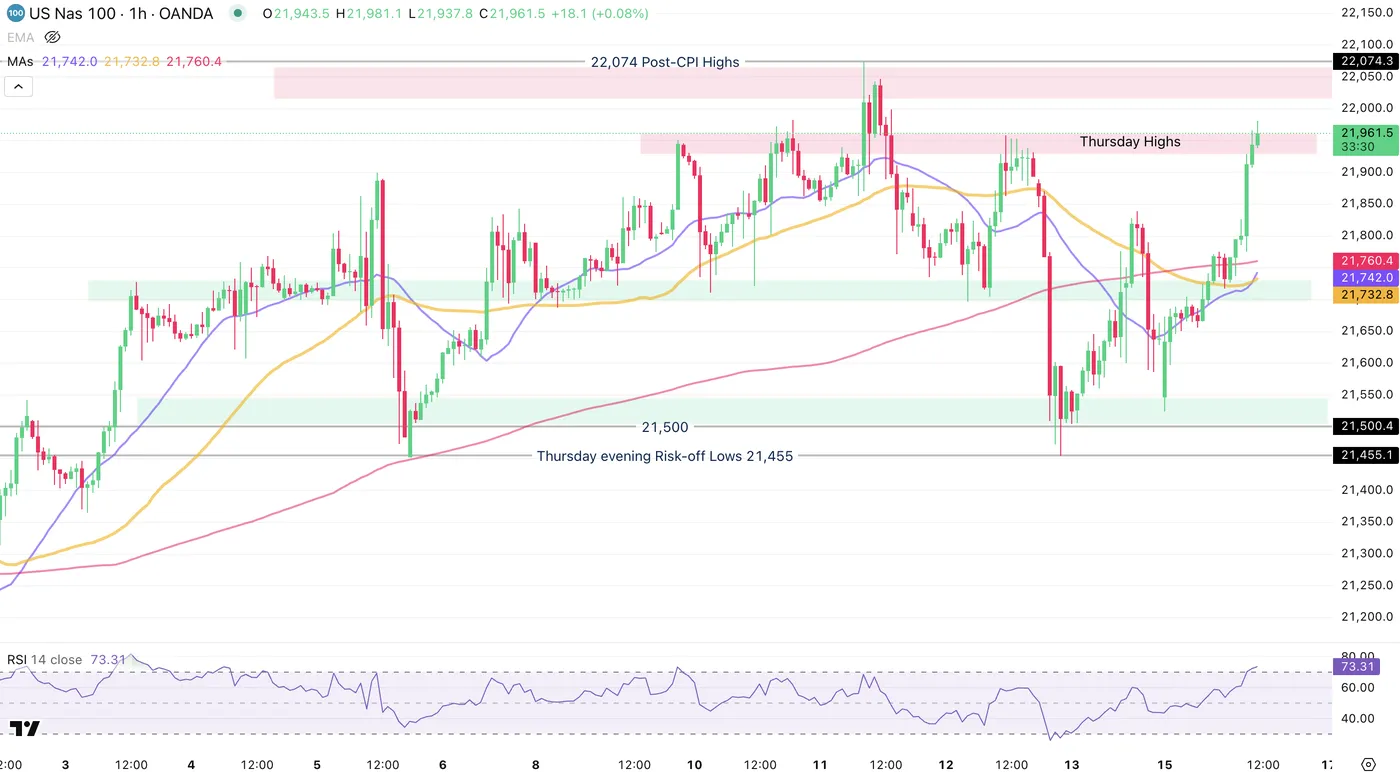
Nasdaq 100 1H Chart, June 16, 2025 – Source: TradingView
The Nasdaq is smashing through last Thursday highs of 21,957 with the up-move stalling slowly as the RSI indicates overbought conditions.
Look at 21,930 for the low of the immediate pivot/resistance zone where we are currently trading.
Key 1H moving averages are all around the same spot 200 points below and may act as a magnet for consolidation as buyers may take their foot of the pedal ahead of key Central Bank rate decisions. The MAs are at a confluence with the immediate support zone between 21,700 and 21,730.
One other component to such a sharp reversal is a quick accumulation of short positioning as market fears create added volatility – The unwinding of such positions create strong reversal candles such as the consecutive bull candles since the Sunday gap down open.
The next key resistance except for the one prices are trading in right now is the post-CPI highs mentioned earlier – a break of the 21,074 and consolidation above would point towards the All-Time High resistance zone around 22,000.
Safe Trades!
Bitcoin (BTCUSD) Forecasting the Rally from the Equal Legs Area
Hello fellow traders. In this technical article we’re going to take a look at the Elliott Wave charts charts of BTCUSD published in members area of the website. As our members know Bitcoin has given us 3 waves pull back recently that found buyers right at the equal legs area. We have been favoring the long side due to impulsive bullish sequences the crypto is showing. In further text we’re going to explain the short term Elliott Wave forecast.
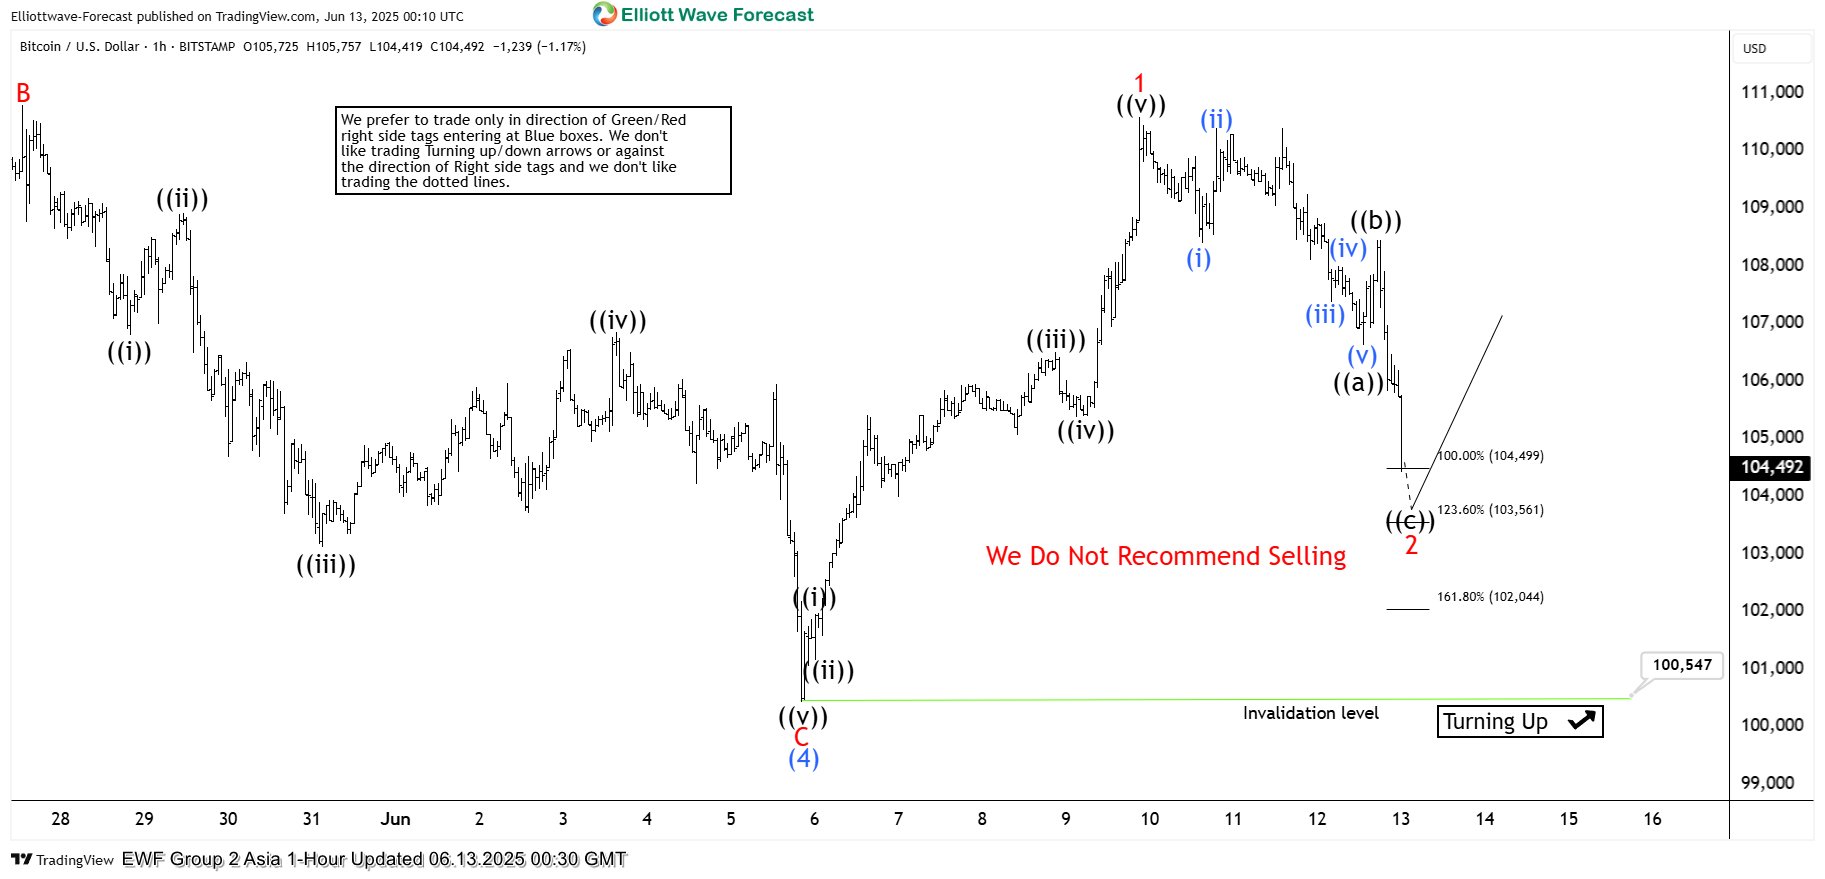
BTCUSD Elliott Wave 1 Hour Chart 06.13.2025
Current view suggests Bitcoin ended cycle from the 100,547 low as wave 1 red. We got 5 waves up in the rally from the mentioned low. Currently the crypto is doing intraday pull back , wave 2 red. The correction has reached the extreme zone, but it still appears incomplete at this time. We may see further short-term weakness within the highlighted area. We expect buyers to appear in the 104,499–102,044 zone, leading to a potential rally toward new highs or at least a 3-wave bounce.
Did you know ? 90% of traders fail because they don’t understand market patterns. Are you in the top 10%? Test yourself with this advanced Elliott Wave Test
Note: Keep in mind not every chart is trading recommendation. Official trading strategy on How to trade 3, 7, or 11 swing and equal leg is explained in details in Educational Video, available for members viewing inside the membership area.
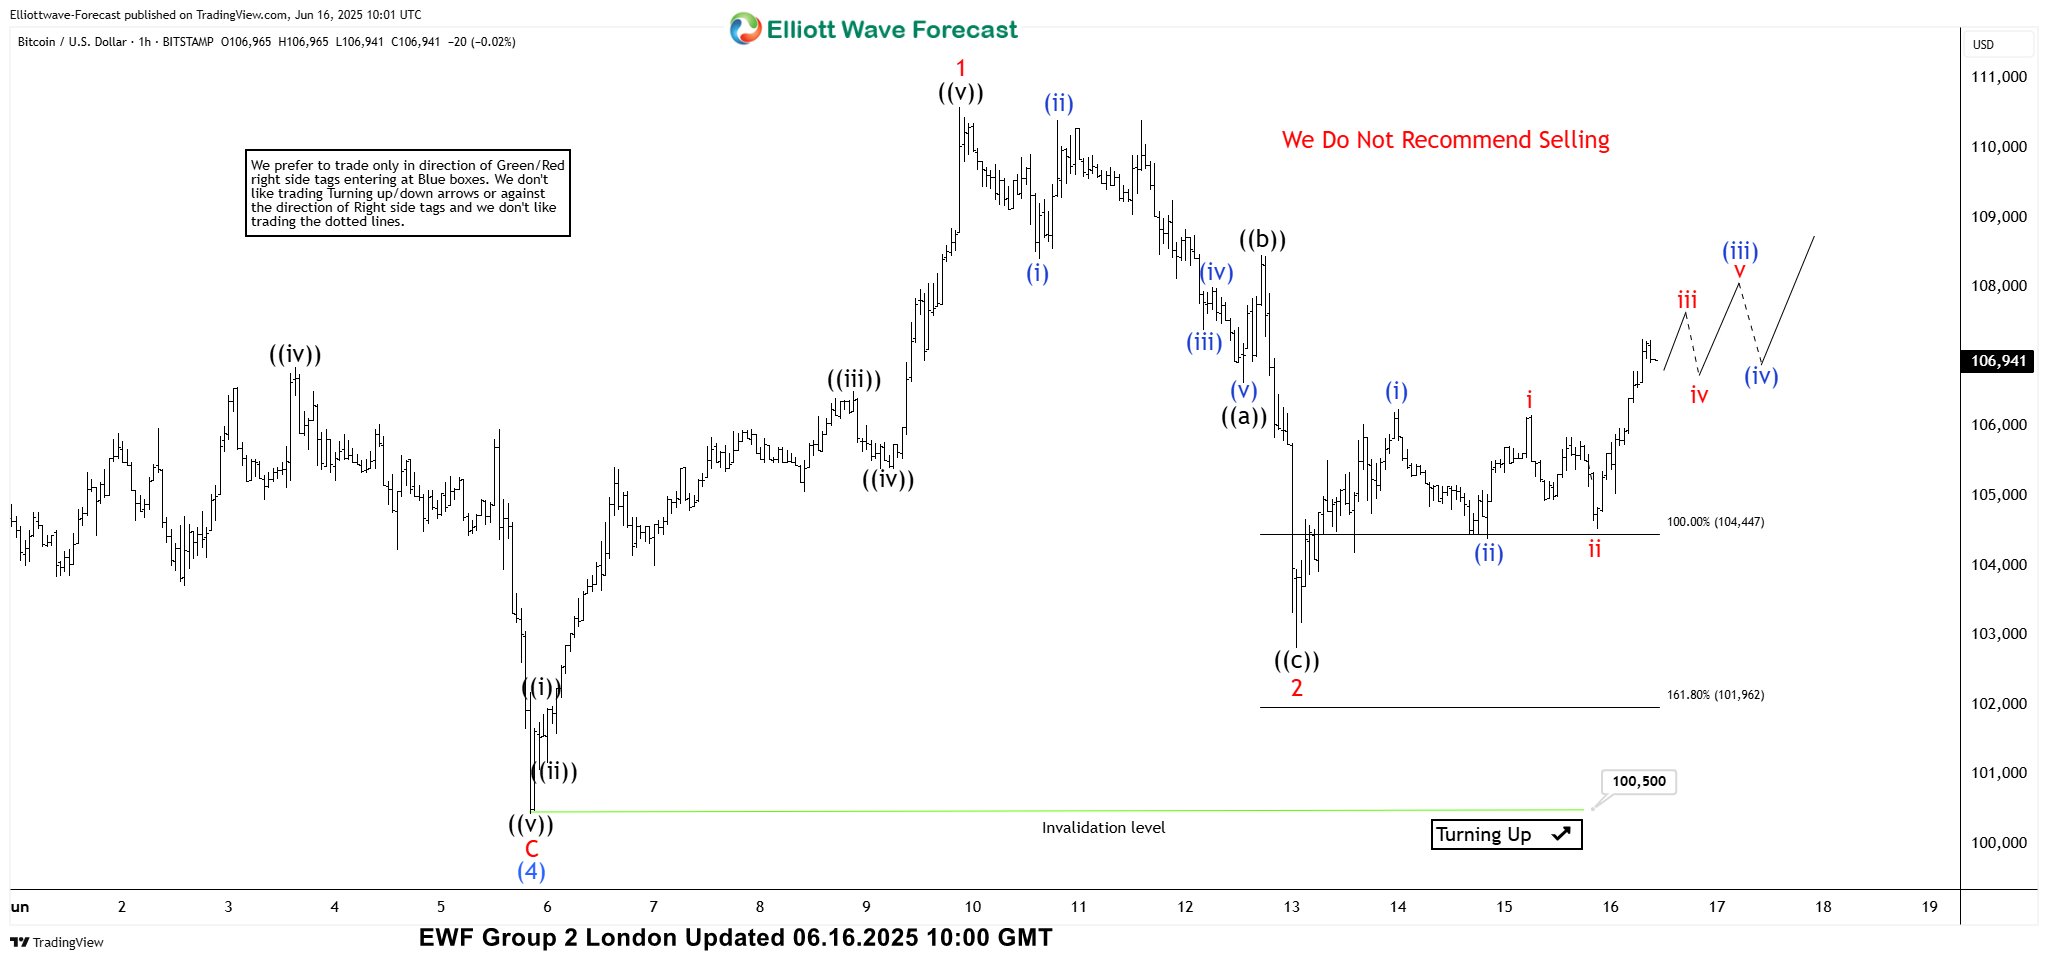
BTCUSD Elliott Wave 1 Hour Chart 06.16.2025
BTCUSD found buyers at the marked equal legs area as expected and we got good reaction from there. We count pull back completed at 102,848 low. We don’t recommend selling in any proposed pull back. The price should ideally hold above 102,848 low to keep proposed view intact. We would like to see break above 1 red peak 110,607 to confirm next leg up is in progress. Bitcoin is ideally targeting 112,794 area next.
Keep in mind that market is dynamic and presented view could have changed in the mean time. You can check most recent charts with target levels in the membership area of the site. Best instruments to trade are those having incomplete bullish or bearish swings sequences. We put them in Sequence Report and best among them are shown in the Live Trading Room.
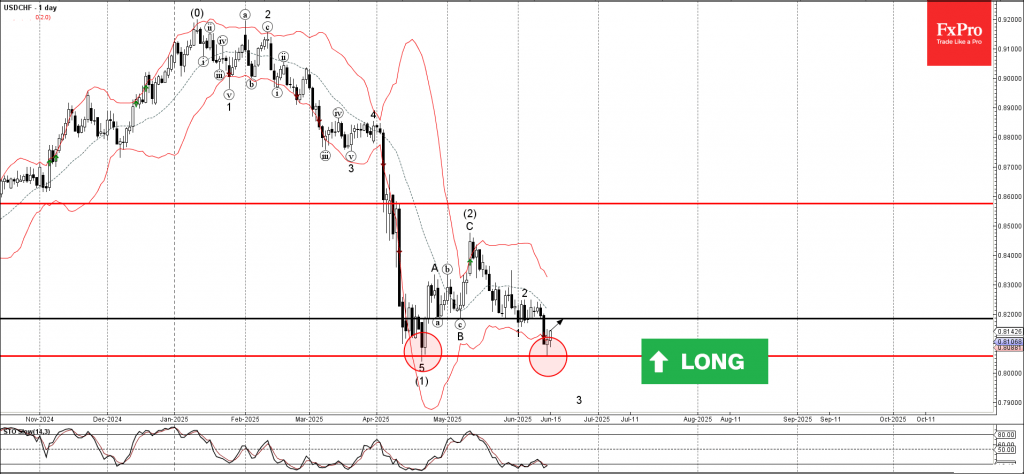
USDCHF Wave Analysis
USDCHF: ⬆️ Buy
- USDCHF reversed from key support level 0.8055
- Likely to rise to resistance level 0.8185
USDCHF currency pair recently reversed up from the key support level 0.8055, which stopped the previous impulse wave (1) at the end of April.
The support zone near the support level 0.8055 was strengthened by the lower daily Bollinger Band.
Given the oversold daily Stochastic, USDCHF currency pair can be expected to rise to the next resistance level 0.8185 (former support from May and the start of June).
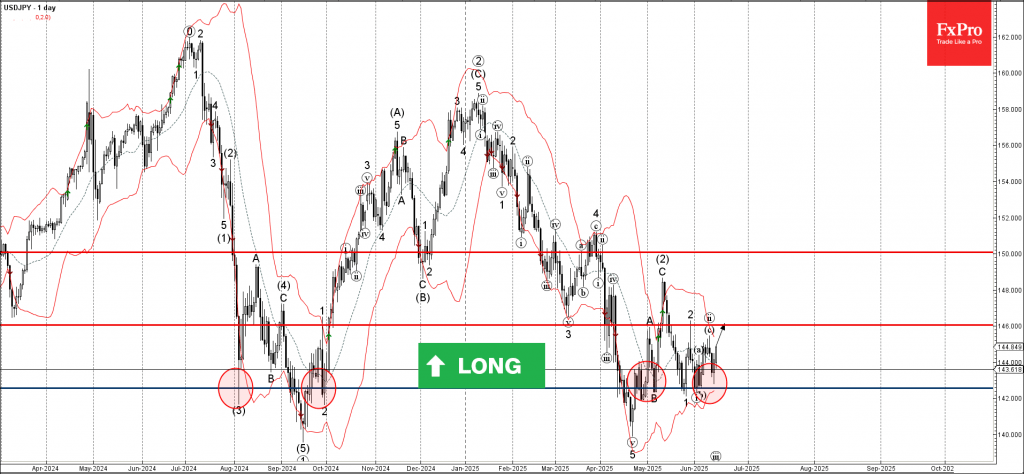
USDJPY Wave Analysis
USDJPY: ⬆️ Buy
- USDJPY reversed from the support zone
- Likely to rise to the resistance level 146.00
USDJPY currency pair recently reversed from the support zone surrounding the pivotal support level 142.50, which has been reversing the price from the start of August.
The upward reversal from the support level 142.50 created the daily Japanese candlesticks reversal pattern Piercing Line.
USDJPY currency pair can be expected to rise to the next resistance level 146.00 (top of the previous correction 2 from last month).
Ethereum Wave Analysis
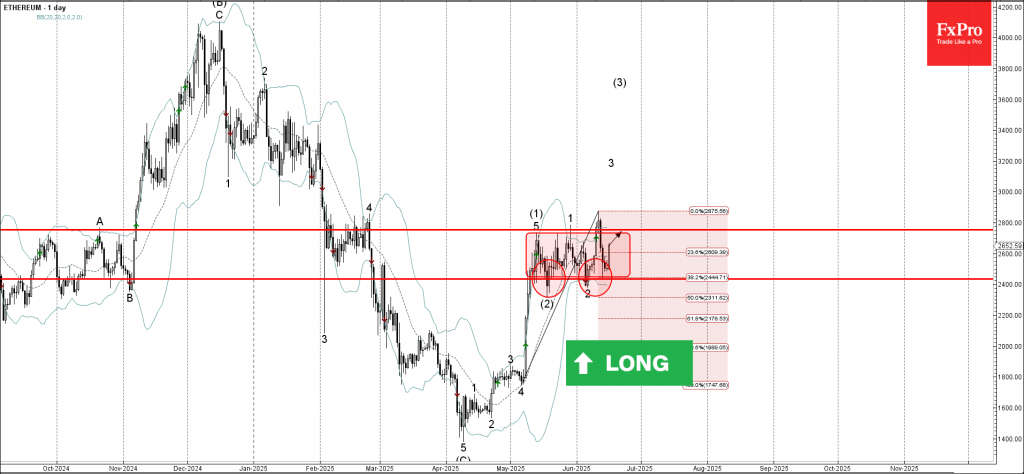
Ethereum: ⬆️ Buy
- Ethereum moving inside sideways price range
- Likely to rise to the resistance level 2754.00
Ethereum cryptocurrency recently reversed up from the support zone between the support level 2435,00 (lower border of the active narrow sideways price range from May), lower daily Bollinger Band and the 38.2% Fibonacci correction of the upward impulse from May.
The upward reversal from this support zone continues the active minor impulse wave 3 of the intermediate impulse wave (3) from last month.
Ethereum can be expected to rise to the next resistance level 2754.00 (upper border of the active sideways price range).
Elliott Wave Blue Box Payoff: AUDUSD Reacts Higher
In this technical blog, we will look at the past performance of the 1-hour Elliott Wave Charts of AUDUSD. In which, the rally from 08 April 2025 low is unfolding as corrective sequence but showed a higher high sequence therefore, called for an extension higher to take place. We knew that the structure in AUDUSD should remain supported & extend higher. So, we advised members not to sell the pair & buy the dips in 3, 7, or 11 swings at the blue box areas. We will explain the structure & forecast below:
AUDUSD 1-Hour Elliott Wave Chart From 6.13.2025
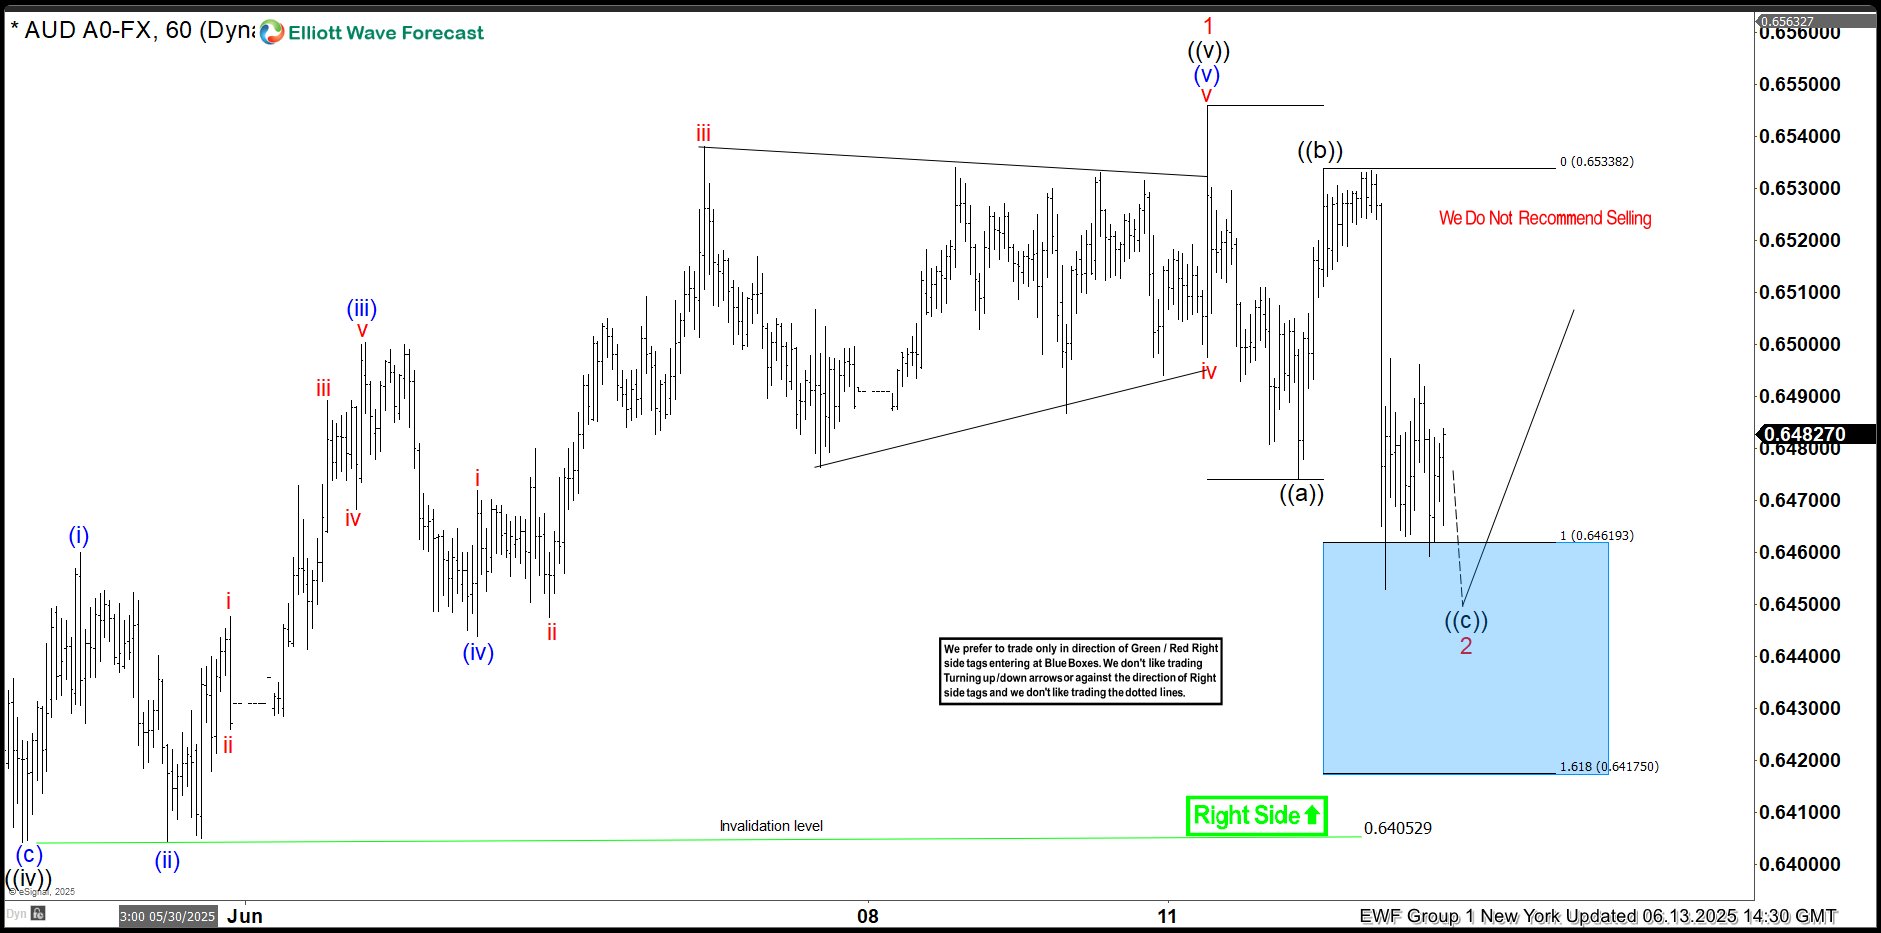
Here’s the 1-hour Elliott wave Chart from the 6.13.2025 NY update. In which, the rally to $0.6545 high completed wave 1 & made a pullback in wave 2. The internals of that pullback unfolded as Elliott wave zigzag correction where wave ((a)) ended at $0.6474 low. Then a rally to $0.6533 high-ended wave ((b)) bounce. Then started the next leg lower in wave ((c)) towards $0.6461- $0.6417 blue box area. From there, buyers were expected to appear looking for new highs ideally or for a 3-wave bounce minimum.
AUDUSD Latest 1-Hour Elliott Wave Chart From 6.16.2025
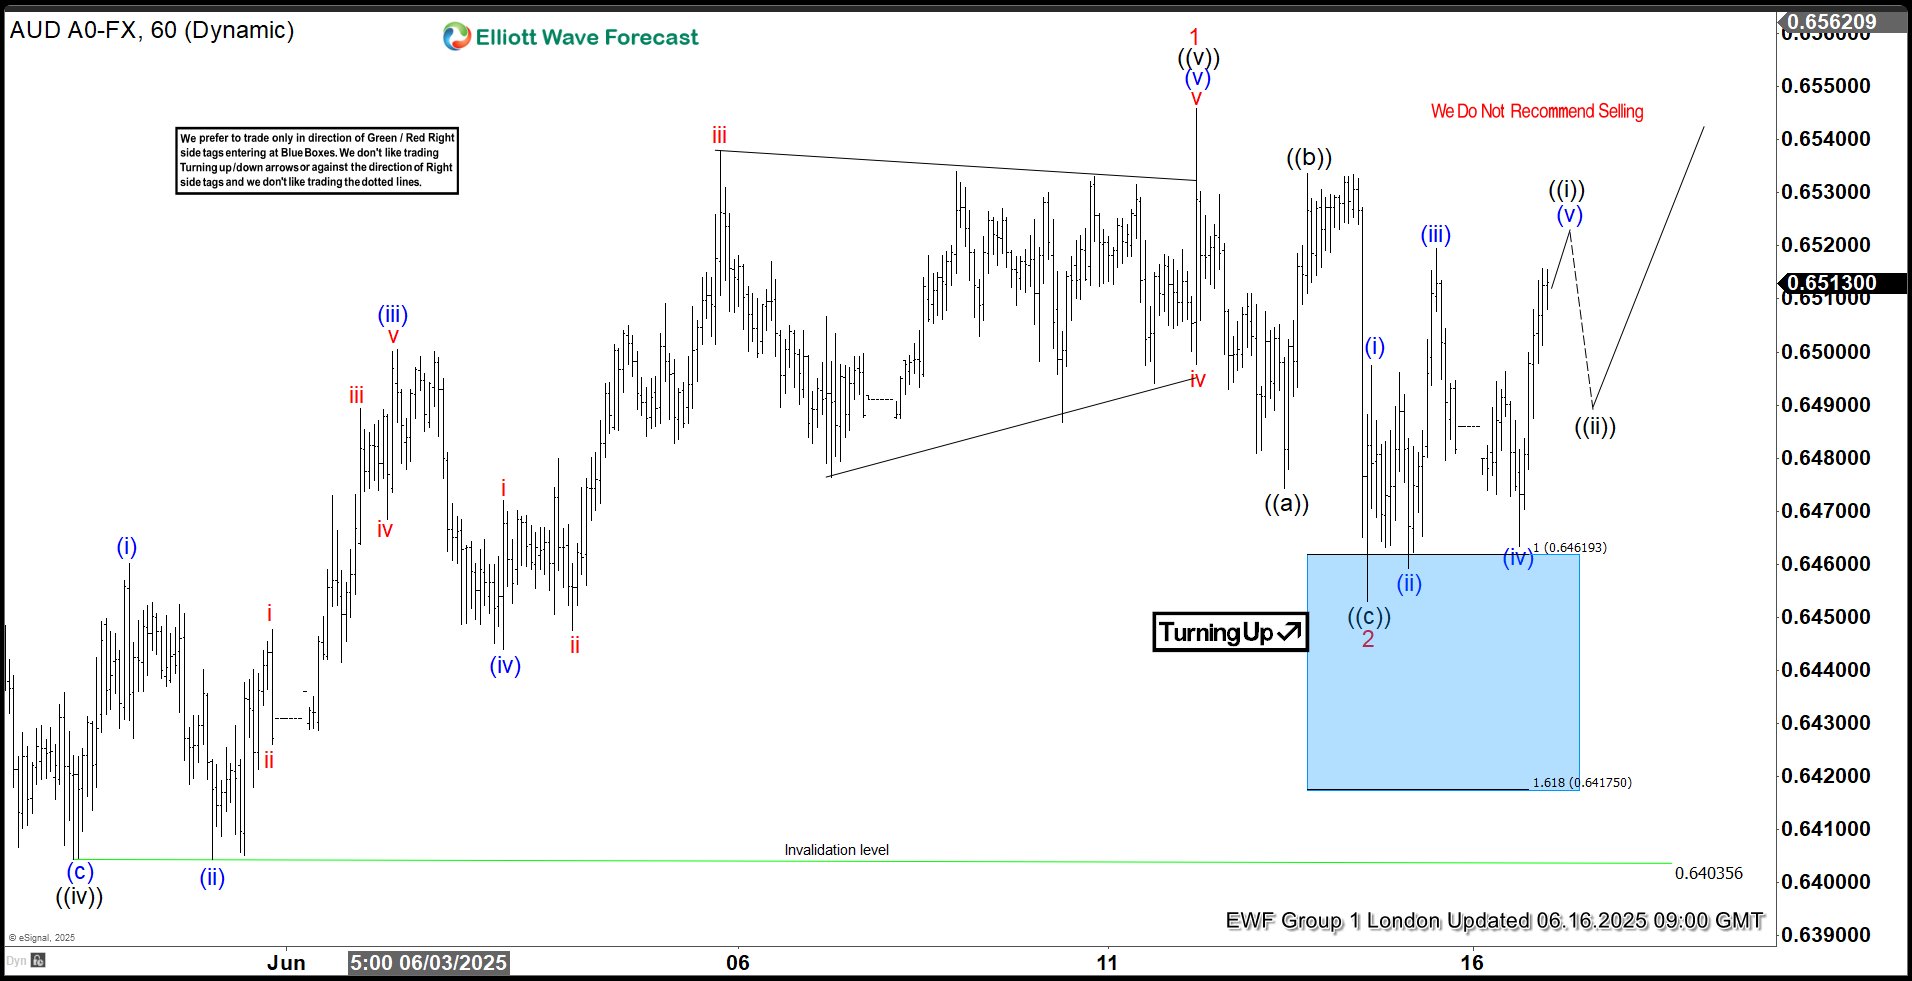
This is the latest 1-hour Elliott wave Chart from the 6.16.2025 London update. In which the pair is showing a strong reaction higher taking place, right after ending the correction within the blue box area. Allowed members to create a risk-free position shortly after taking the long position at the blue box area. However, a break above $0.6545 high is needed to confirm the next extension higher & avoid double correction lower.